| Param | Original file | Final file |
|---|---|---|
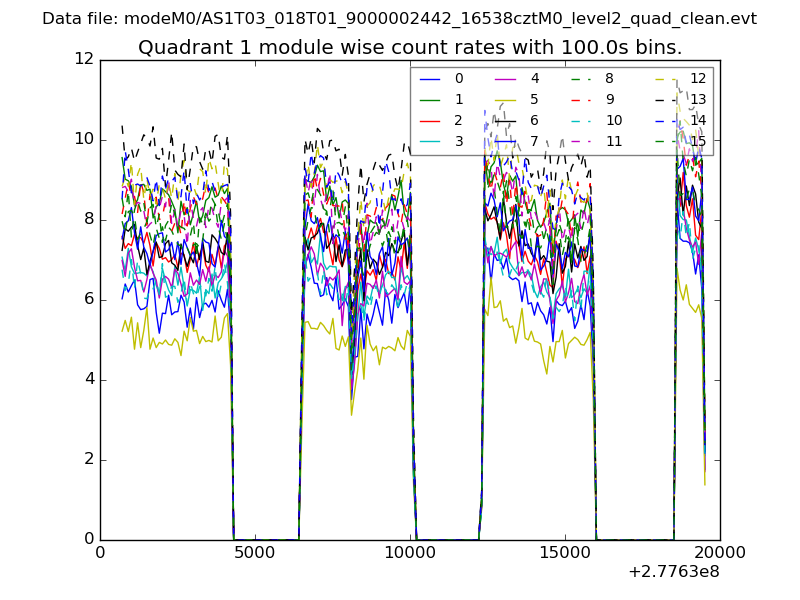
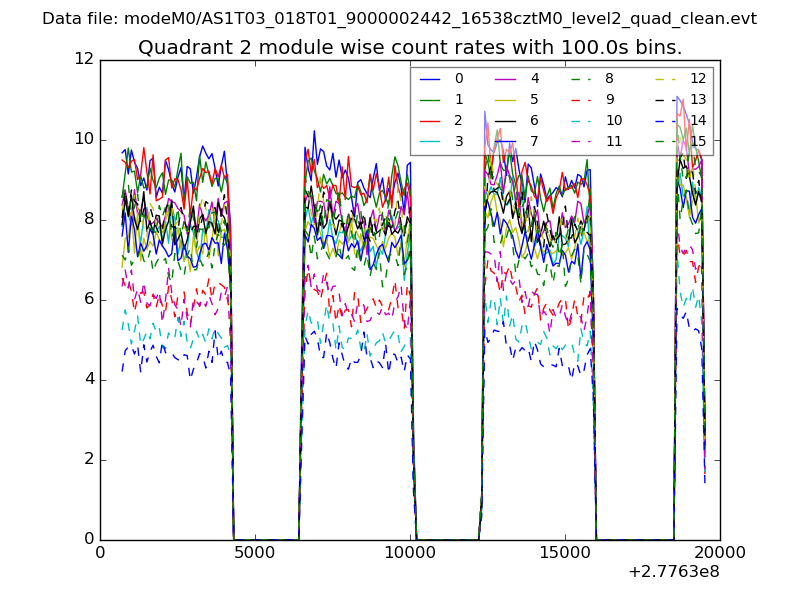
| Filename | modeM0/AS1T03_018T01_9000002442_16538cztM0_level2.evt | modeM0/AS1T03_018T01_9000002442_16538cztM0_level2_quad_clean.evt |
| Size (bytes) | 1,297,033,920 | 226,013,760 |
| Size | 1.2 GB | 215.5 MB |
| Events in quadrant A | 8,887,207 | 1,413,343 |
| Events in quadrant B | 10,326,502 | 1,418,751 |
| Events in quadrant C | 10,117,186 | 1,406,626 |
| Events in quadrant D | 8,742,177 | 1,374,748 |
| Mode M0 | |||
|---|---|---|---|
| Quadrant | BADHDUFLAG | Total packets | Discarded packets |
| A | 0 | 38067 | 5 |
| B | 0 | 41714 | 4 |
| C | 0 | 41382 | 4 |
| D | 0 | 38341 | 4 |
| Mode M9 | |||
|---|---|---|---|
| Quadrant | BADHDUFLAG | Total packets | Discarded packets |
| A | 0 | 21 | 0 |
| B | 0 | 21 | 0 |
| C | 0 | 21 | 0 |
| D | 0 | 22 | 0 |
| Mode SS | |||
|---|---|---|---|
| Quadrant | BADHDUFLAG | Total packets | Discarded packets |
| A | 0 | 364 | 0 |
| B | 0 | 364 | 0 |
| C | 0 | 364 | 0 |
| D | 0 | 364 | 0 |
| Quadrant | Total seconds | Saturated seconds | Saturation percentage |
|---|---|---|---|
| A | 17871 | 289 | 1.617145% |
| B | 17871 | 509 | 2.848190% |
| C | 17871 | 342 | 1.913715% |
| D | 17871 | 223 | 1.247832% |
Noise dominated data is calculated using 1-second bins in cleaned event files. If a bin has >2000 counts, and if more than 50% of those come from <1% of pixels, then it is considered to be noise-dominated and hence unusable.
| Quadrant | # 1 sec bins | Bins with >0 counts | Bins with >2000 counts | High rate bins dominated by noise | Noise dominated (total time) | Noise dominated (detector-on time) | Marked lightcurve |
|---|---|---|---|---|---|---|---|
| A | 19917 | 17872 | 66 | 66 | 0.33% | 0.37% | 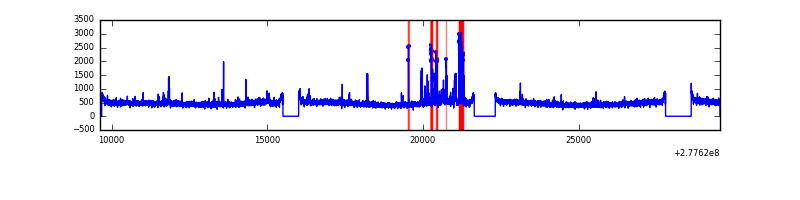 |
| B | 19917 | 17872 | 245 | 245 | 1.23% | 1.37% | 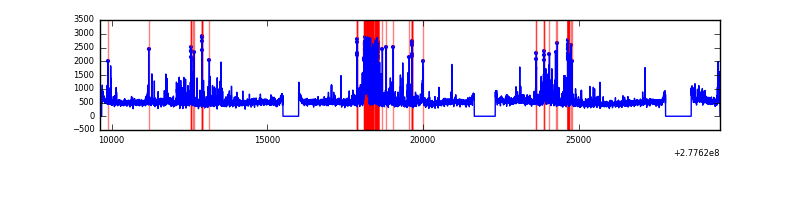 |
| C | 19917 | 17872 | 26 | 26 | 0.13% | 0.15% | 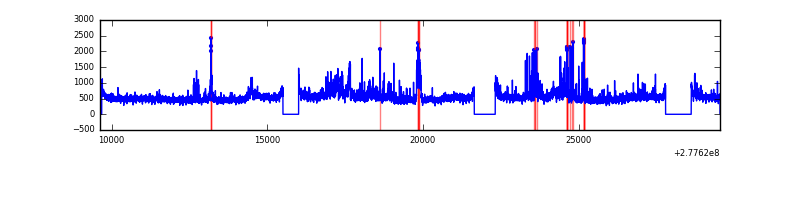 |
| D | 19917 | 17872 | 60 | 60 | 0.30% | 0.34% | 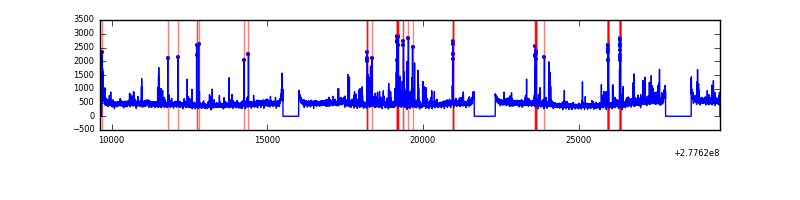 |
Top three noisy pixels from each quadrant. If the there are fewer than three noisy pixels in the level2.evt file, extra rows are filled as -1
| Pixel properties | Quadrant properties | ||||||
|---|---|---|---|---|---|---|---|
| Quadrant | DetID | PixID | Counts | Sigma | Mean | Median | Sigma |
| A | 15 | 174 | 528679 | 1225.76 | 2140 | 2092 | 429.6 |
| A | 3 | 1 | 111199 | 253.97 | 2140 | 2092 | 429.6 |
| A | 0 | 226 | 18812 | 38.92 | 2140 | 2092 | 429.6 |
| B | 0 | 85 | 538371 | 1318.63 | 2136 | 2080 | 406.7 |
| B | 7 | 220 | 381640 | 933.26 | 2136 | 2080 | 406.7 |
| B | 15 | 35 | 314523 | 768.23 | 2136 | 2080 | 406.7 |
| C | 3 | 233 | 1759717 | 3655.83 | 2057 | 2072 | 480.8 |
| C | 14 | 238 | 316430 | 653.85 | 2057 | 2072 | 480.8 |
| C | 7 | 247 | 22416 | 42.31 | 2057 | 2072 | 480.8 |
| D | 1 | 52 | 636643 | 1246.64 | 2085 | 2021 | 509.1 |
| D | 10 | 70 | 97954 | 188.45 | 2085 | 2021 | 509.1 |
| D | 2 | 234 | 66471 | 126.6 | 2085 | 2021 | 509.1 |
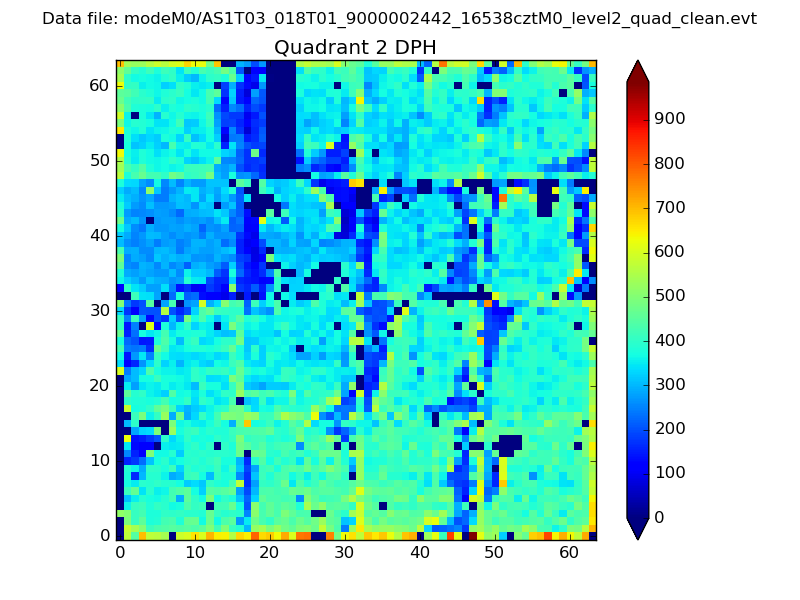
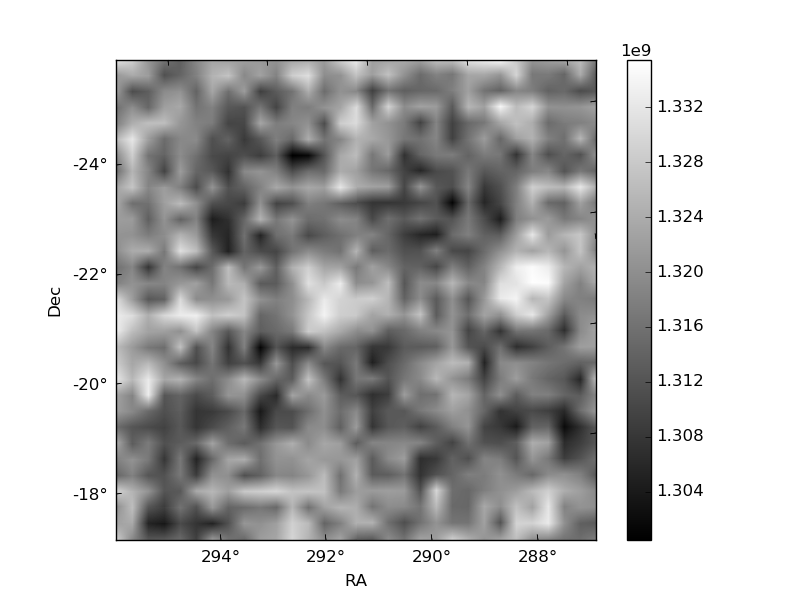
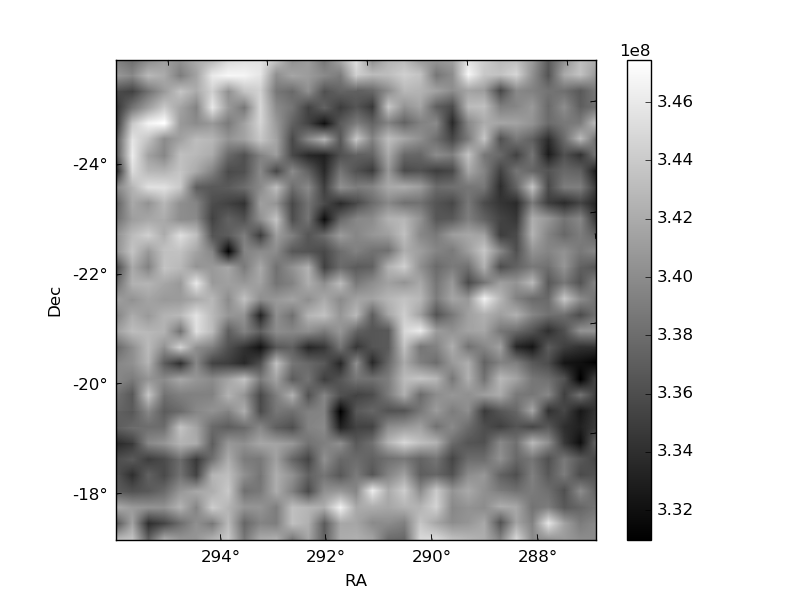
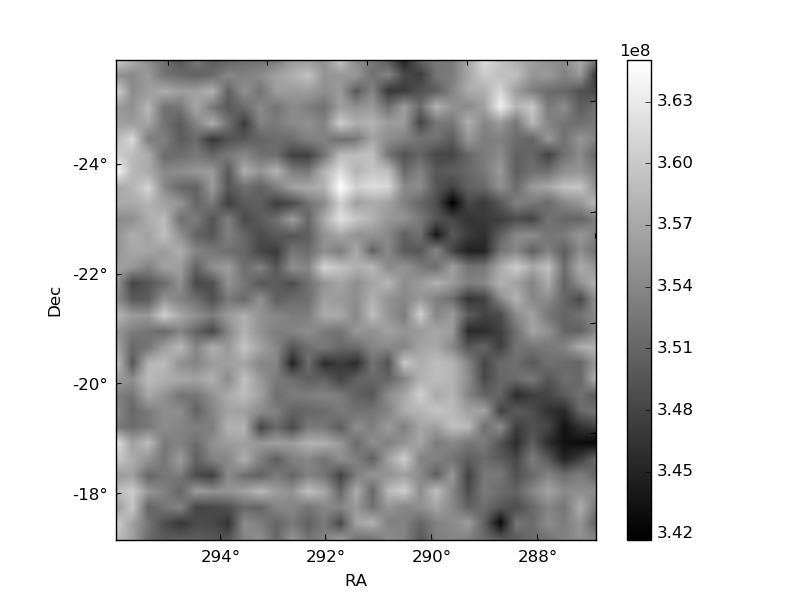
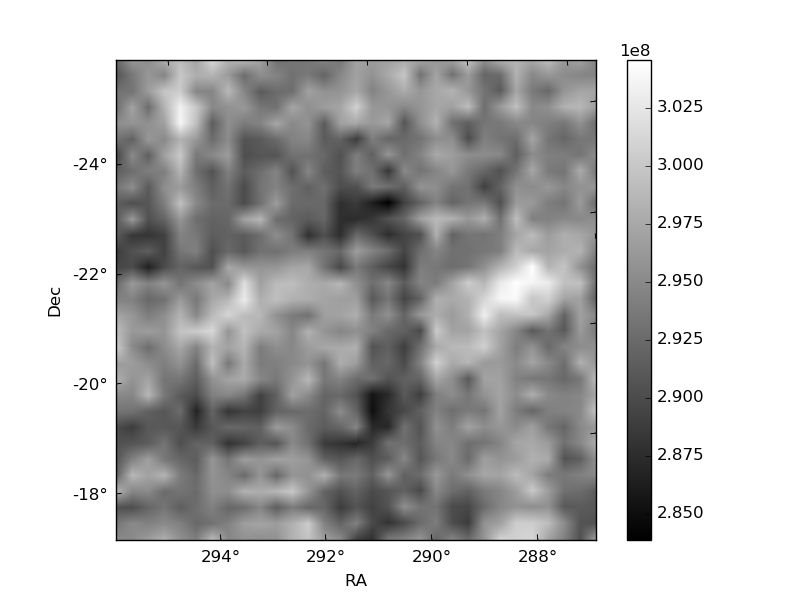
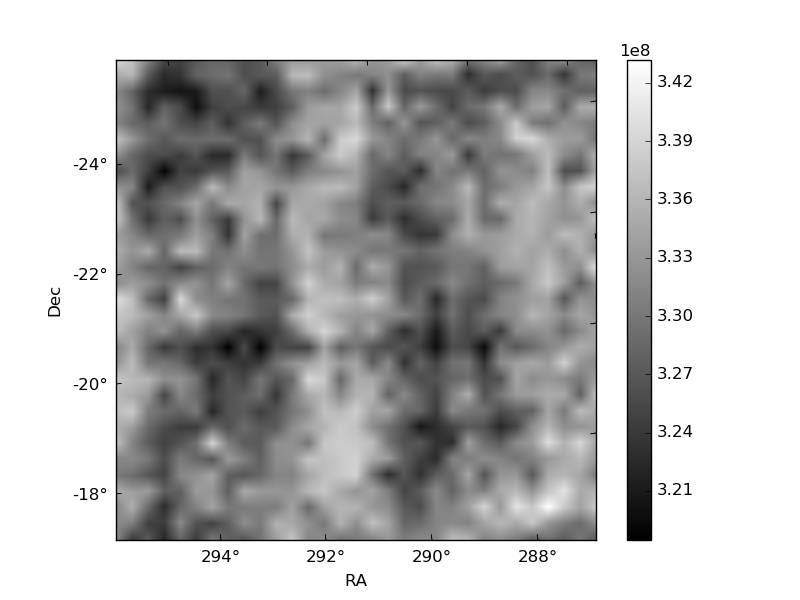
Histogram calculated using DETX and DETY for each event in the final _common_clean file
| Quadrant A | 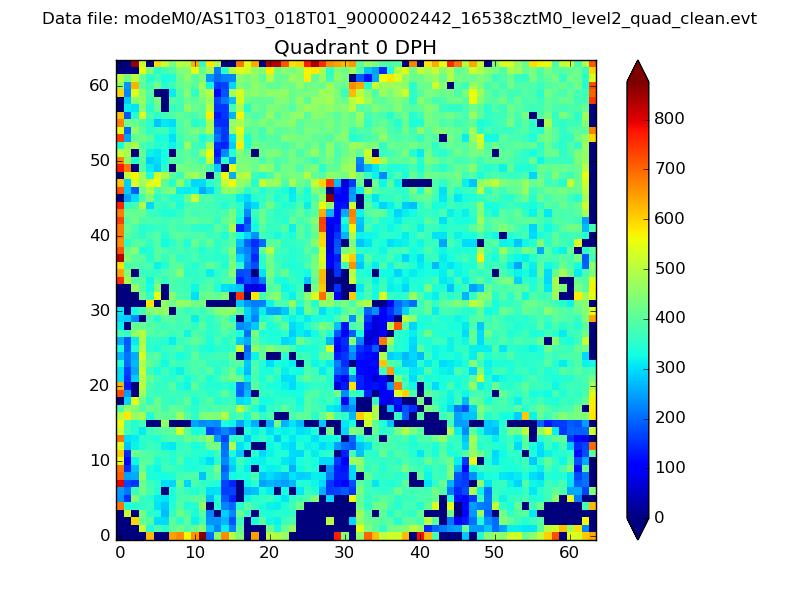 |
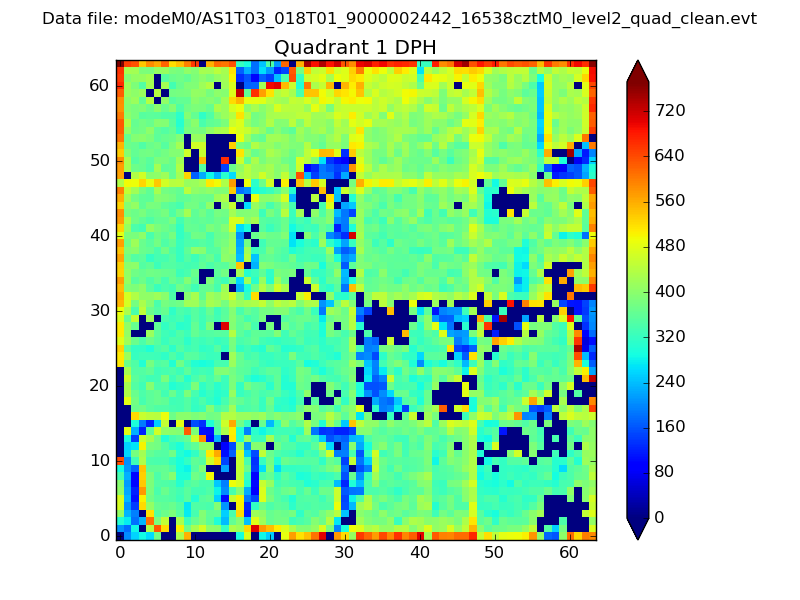 |
Quadrant B |
|---|---|---|---|
| Quadrant D | 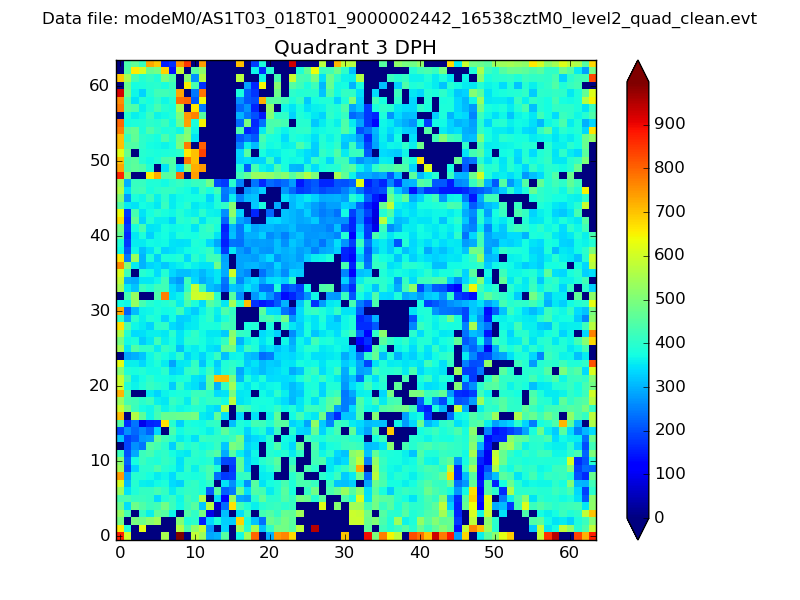 |
 |
Quadrant C |
| Plot type | Count rate plots | Images |
|---|---|---|
| Comparison with Poisson distribution Blue bars denote a histogram of data divided into 1 sec bins. Red curve is a Poisson curve with rate = median count rate of data. |
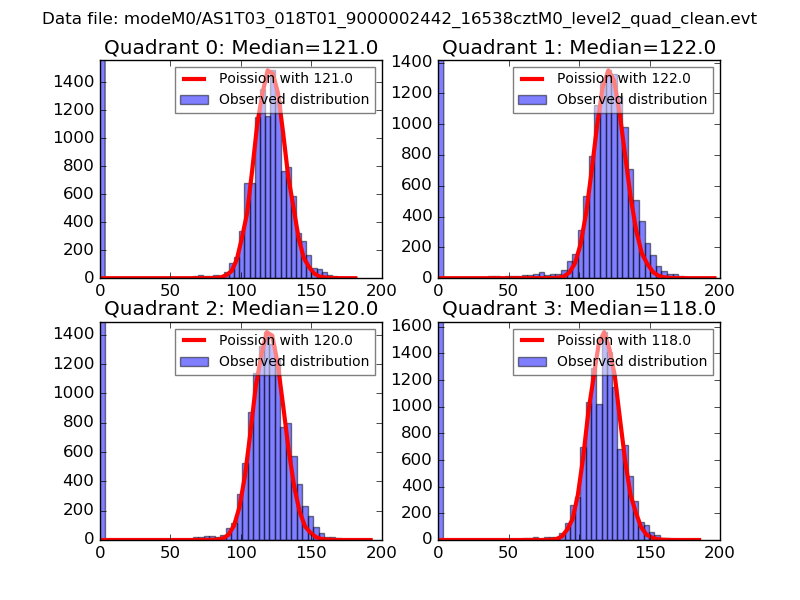 |
 |
| Quadrant-wise count rates Data is divided into 100 sec bins |
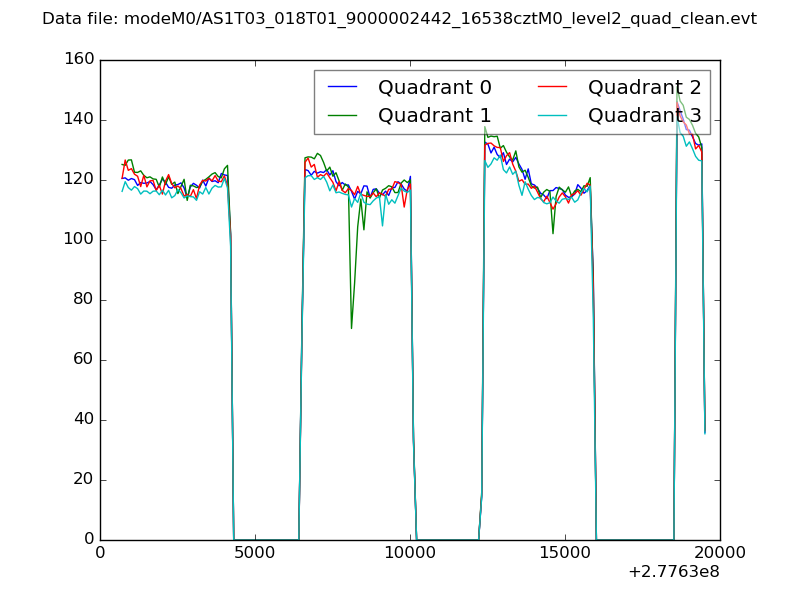 |
|
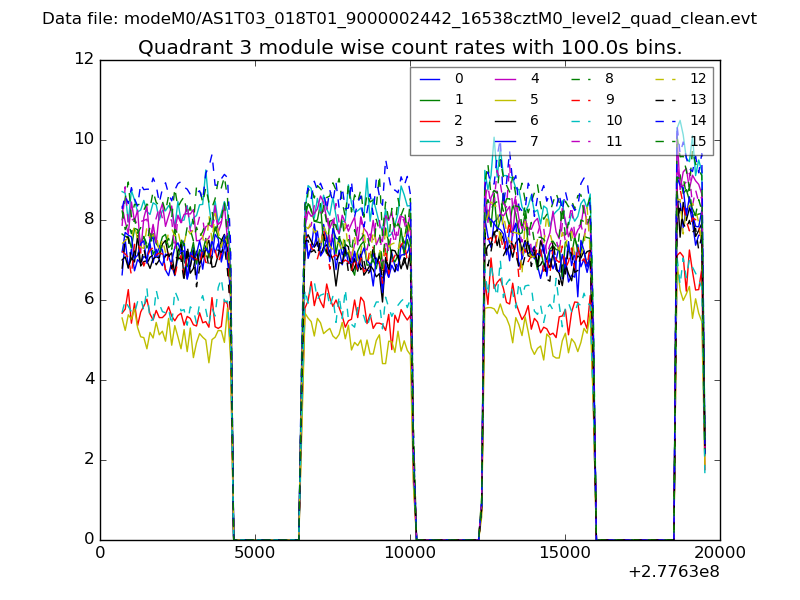
| Module-wise count rates for Quadrant A Data is divided into 100 sec bins |
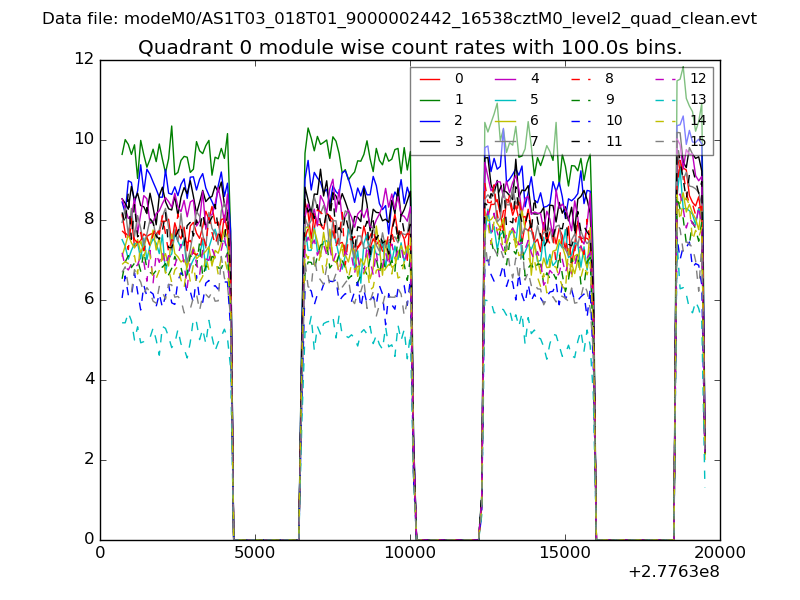 |
 |
| Module-wise count rates for Quadrant B Data is divided into 100 sec bins |
 |
 |
| Module-wise count rates for Quadrant C Data is divided into 100 sec bins |
 |
 |
| Module-wise count rates for Quadrant D Data is divided into 100 sec bins |
 |
 |
| Parameter | Plot |
|---|---|
| CZT HV Monitor | 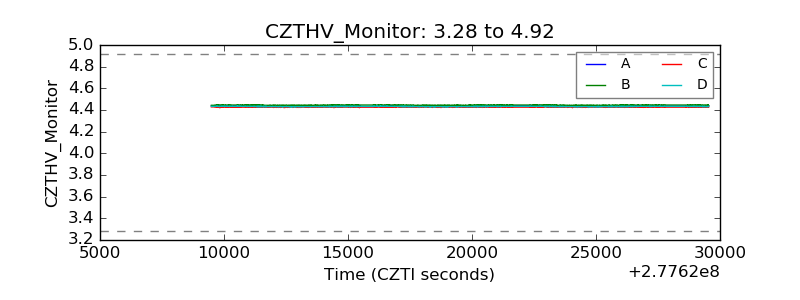 |
| D_VDD | 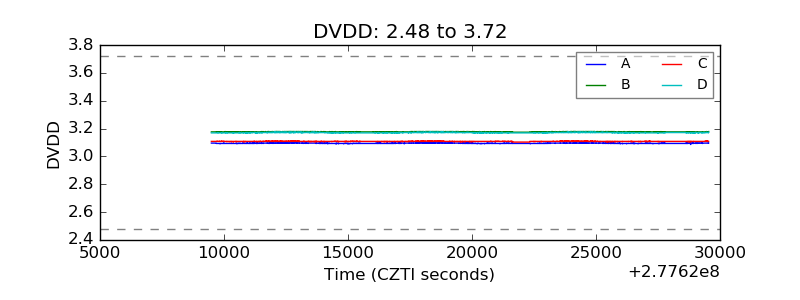 |
| Temperature 1 |  |
| Veto HV Monitor | 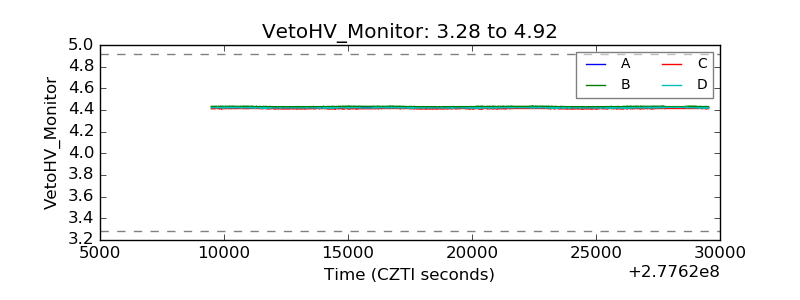 |
| Veto LLD | 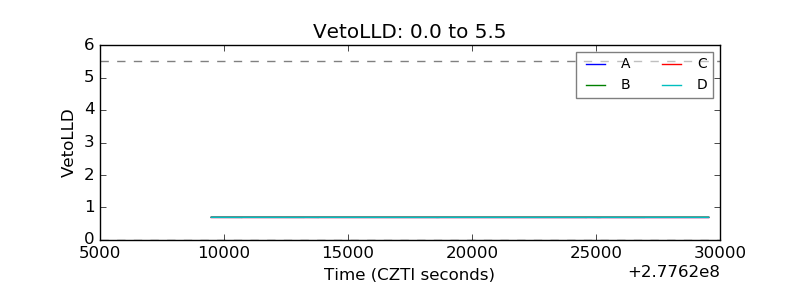 |
| Alpha Counter | 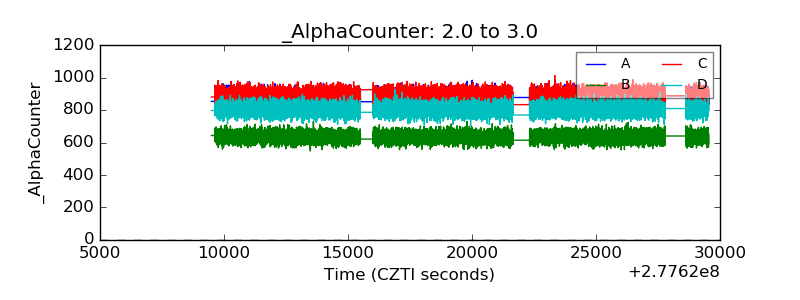 |
| _CPM_Rate | 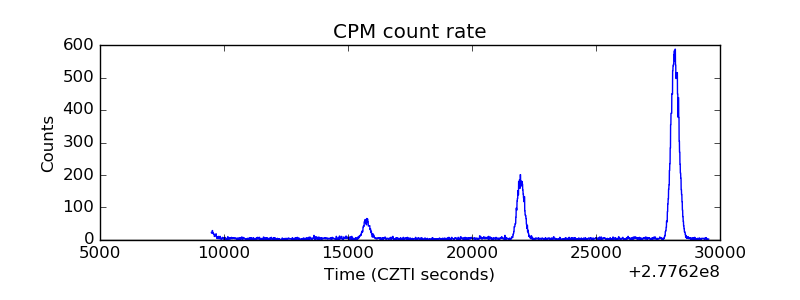 |
| CZT Counter | 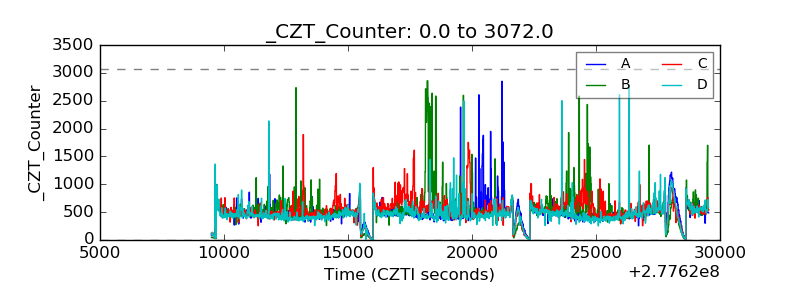 |
| +2.5 Volts monitor |  |
| +5 Volts monitor |  |
| _ROLL_ROT | 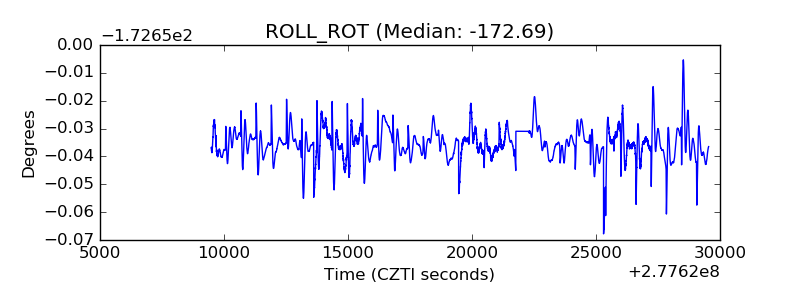 |
| _Roll_DEC | 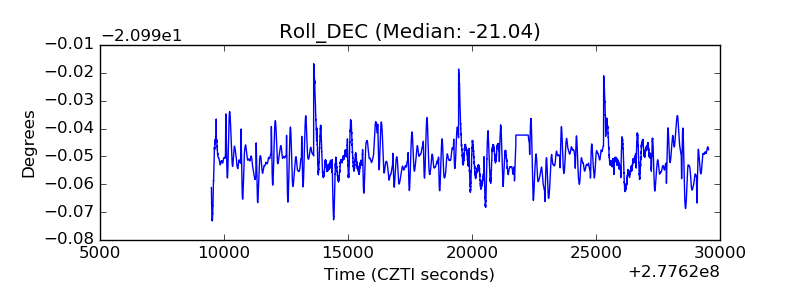 |
| _Roll_RA | 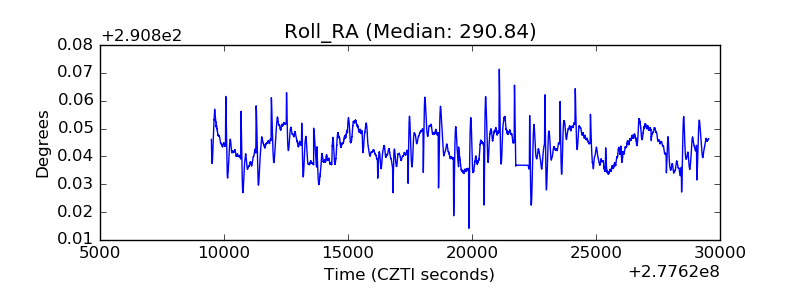 |
| Veto Counter | 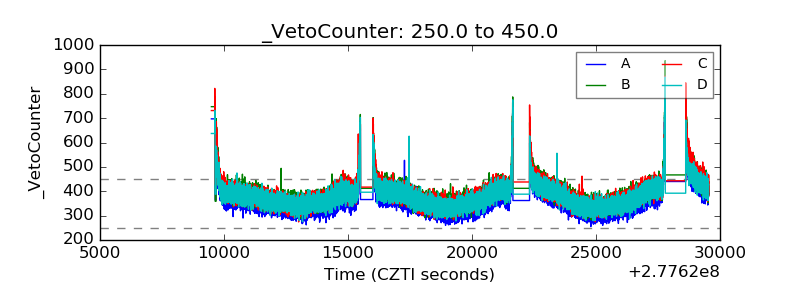 |