| Param | Original file | Final file |
|---|---|---|
| Filename | modeM0/AS1T03_018T01_9000002442_16539cztM0_level2.evt | modeM0/AS1T03_018T01_9000002442_16539cztM0_level2_quad_clean.evt |
| Size (bytes) | 466,859,520 | 90,987,840 |
| Size | 445.2 MB | 86.8 MB |
| Events in quadrant A | 3,199,258 | 578,180 |
| Events in quadrant B | 3,775,937 | 585,712 |
| Events in quadrant C | 3,343,035 | 572,165 |
| Events in quadrant D | 3,370,366 | 557,112 |
| Mode M0 | |||
|---|---|---|---|
| Quadrant | BADHDUFLAG | Total packets | Discarded packets |
| A | 0 | 13818 | 2 |
| B | 0 | 15437 | 1 |
| C | 0 | 14110 | 1 |
| D | 0 | 14260 | 1 |
| Mode M9 | |||
|---|---|---|---|
| Quadrant | BADHDUFLAG | Total packets | Discarded packets |
| A | 0 | 10 | 0 |
| B | 0 | 10 | 0 |
| C | 0 | 10 | 0 |
| D | 0 | 10 | 0 |
| Mode SS | |||
|---|---|---|---|
| Quadrant | BADHDUFLAG | Total packets | Discarded packets |
| A | 0 | 134 | 0 |
| B | 0 | 134 | 0 |
| C | 0 | 134 | 0 |
| D | 0 | 134 | 0 |
| Quadrant | Total seconds | Saturated seconds | Saturation percentage |
|---|---|---|---|
| A | 6632 | 54 | 0.814234% |
| B | 6632 | 84 | 1.266586% |
| C | 6632 | 78 | 1.176116% |
| D | 6632 | 76 | 1.145959% |
Noise dominated data is calculated using 1-second bins in cleaned event files. If a bin has >2000 counts, and if more than 50% of those come from <1% of pixels, then it is considered to be noise-dominated and hence unusable.
| Quadrant | # 1 sec bins | Bins with >0 counts | Bins with >2000 counts | High rate bins dominated by noise | Noise dominated (total time) | Noise dominated (detector-on time) | Marked lightcurve |
|---|---|---|---|---|---|---|---|
| A | 7623 | 6633 | 8 | 8 | 0.10% | 0.12% | 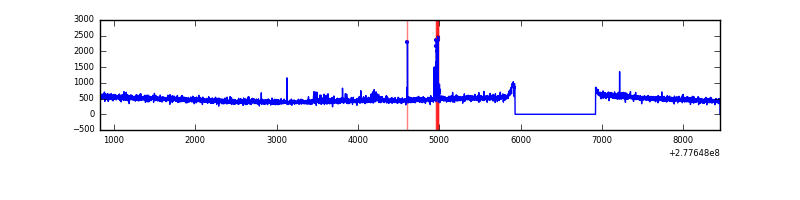 |
| B | 7623 | 6633 | 13 | 13 | 0.17% | 0.20% | 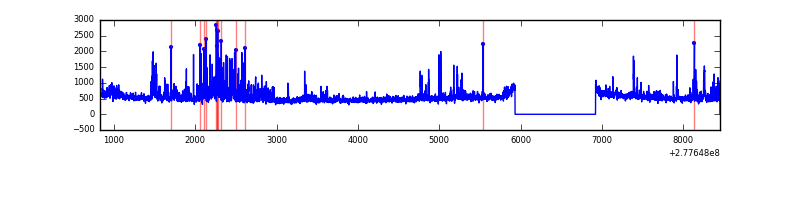 |
| C | 7623 | 6633 | 4 | 4 | 0.05% | 0.06% | 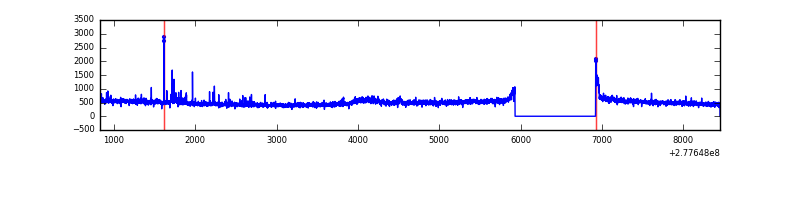 |
| D | 7623 | 6633 | 30 | 30 | 0.39% | 0.45% | 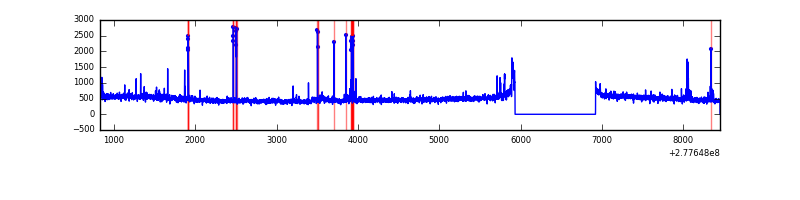 |
Top three noisy pixels from each quadrant. If the there are fewer than three noisy pixels in the level2.evt file, extra rows are filled as -1
| Pixel properties | Quadrant properties | ||||||
|---|---|---|---|---|---|---|---|
| Quadrant | DetID | PixID | Counts | Sigma | Mean | Median | Sigma |
| A | 15 | 174 | 61107 | 367.92 | 805 | 788 | 163.9 |
| A | 3 | 1 | 39319 | 235.02 | 805 | 788 | 163.9 |
| A | 0 | 226 | 6954 | 37.61 | 805 | 788 | 163.9 |
| B | 0 | 85 | 243581 | 1566.1 | 804 | 784 | 155.0 |
| B | 15 | 35 | 119526 | 765.92 | 804 | 784 | 155.0 |
| B | 0 | 229 | 69769 | 444.97 | 804 | 784 | 155.0 |
| C | 3 | 233 | 215000 | 1195.31 | 766 | 772 | 179.2 |
| C | 14 | 238 | 117757 | 652.73 | 766 | 772 | 179.2 |
| C | 7 | 247 | 14911 | 78.89 | 766 | 772 | 179.2 |
| D | 1 | 52 | 254267 | 1337.25 | 776 | 753 | 189.6 |
| D | 2 | 33 | 87451 | 457.32 | 776 | 753 | 189.6 |
| D | 10 | 70 | 46558 | 241.62 | 776 | 753 | 189.6 |
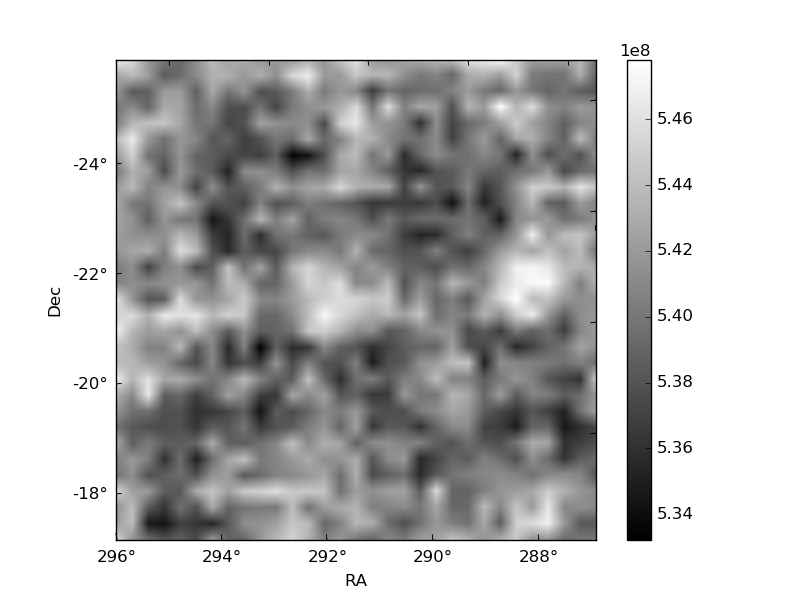
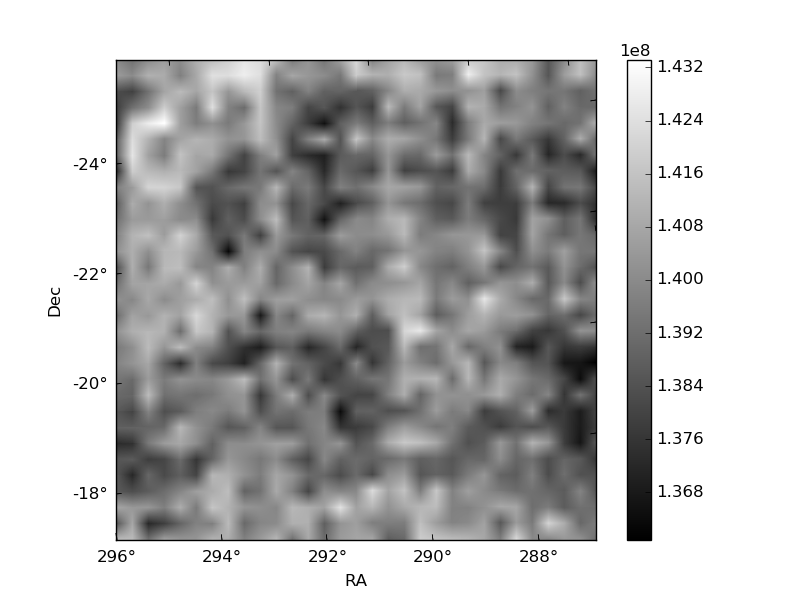
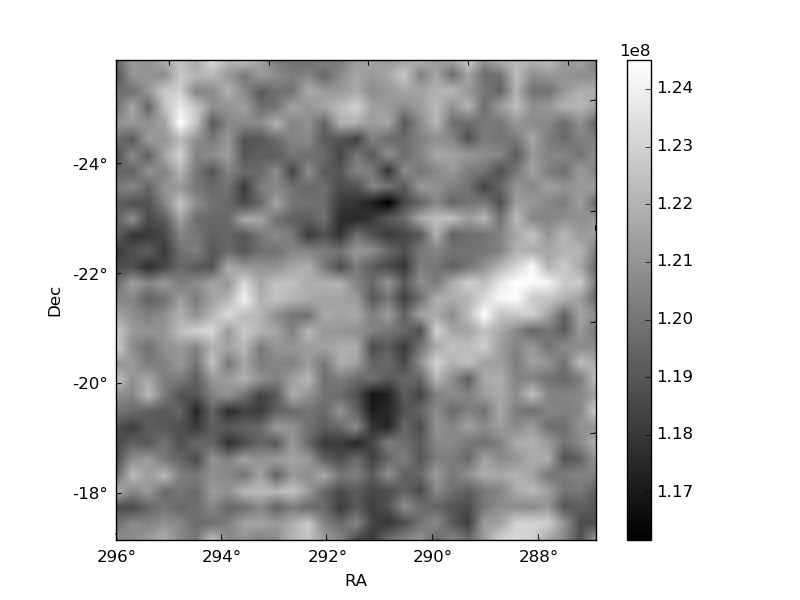
Histogram calculated using DETX and DETY for each event in the final _common_clean file
| Quadrant A | 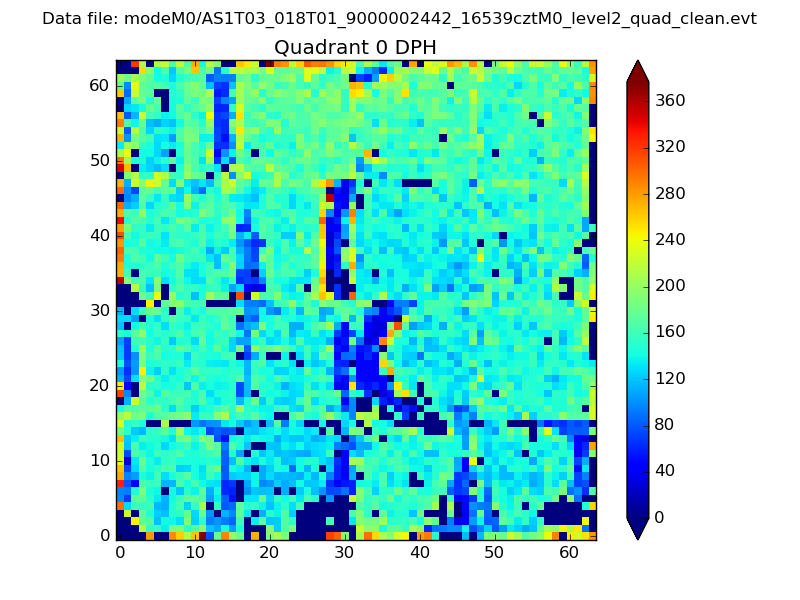 |
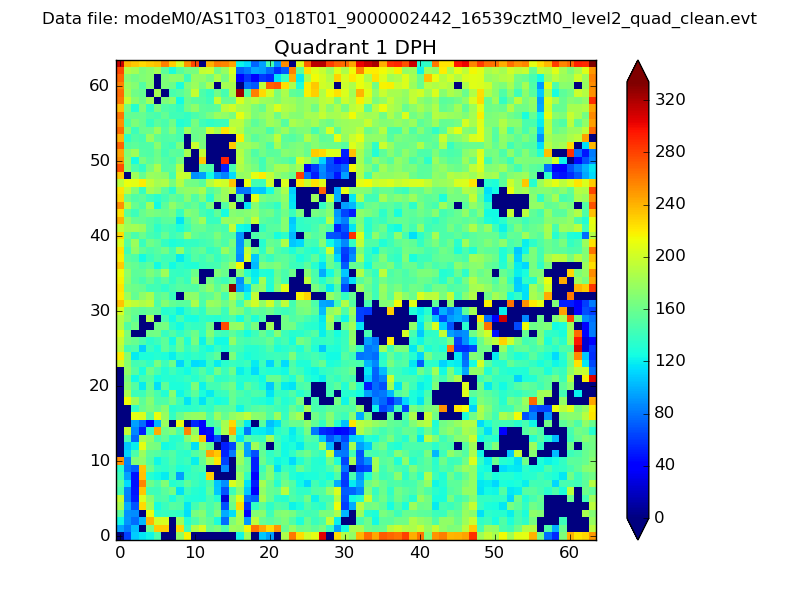 |
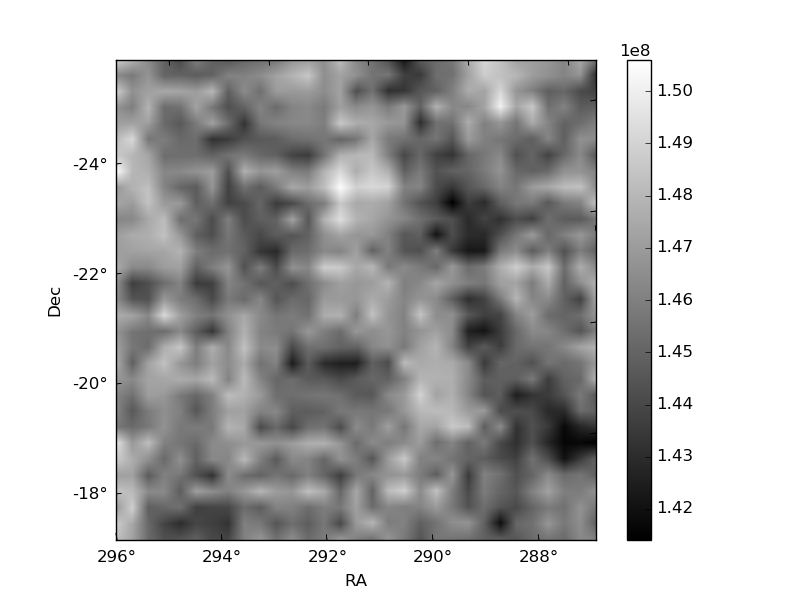
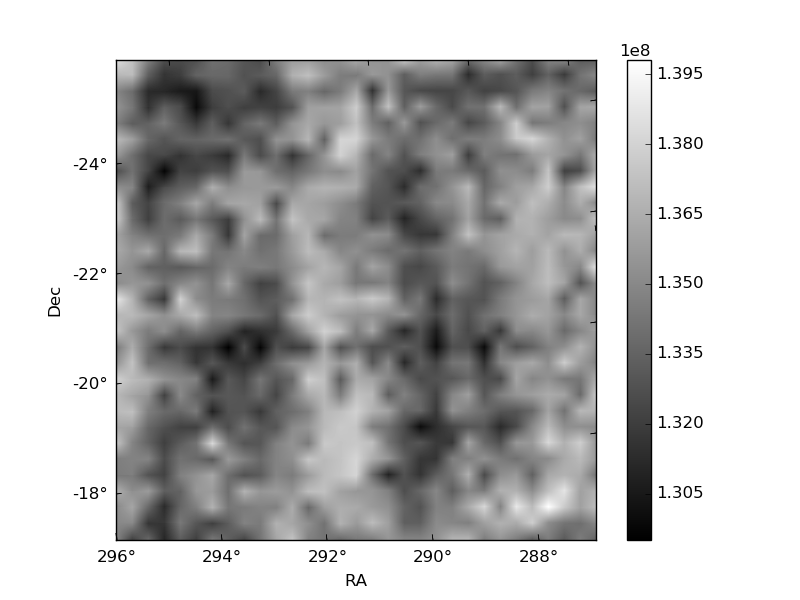
Quadrant B |
|---|---|---|---|
| Quadrant D | 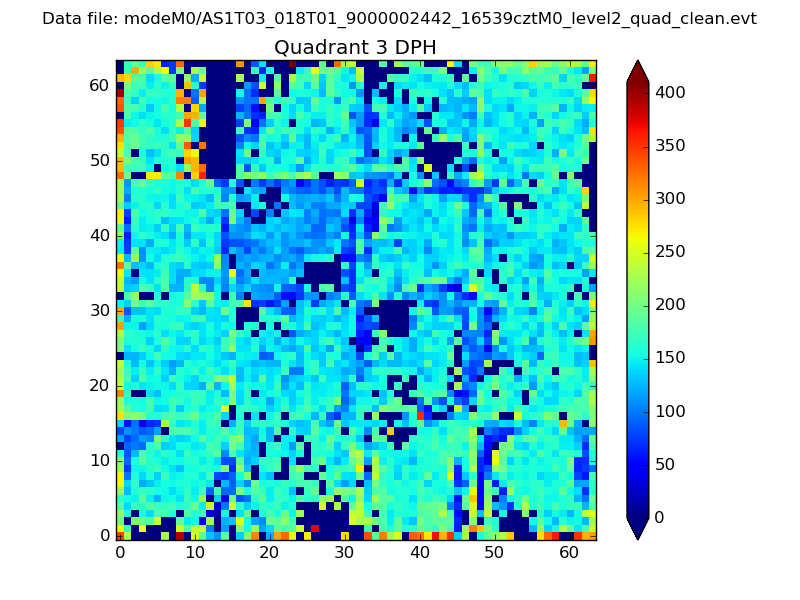 |
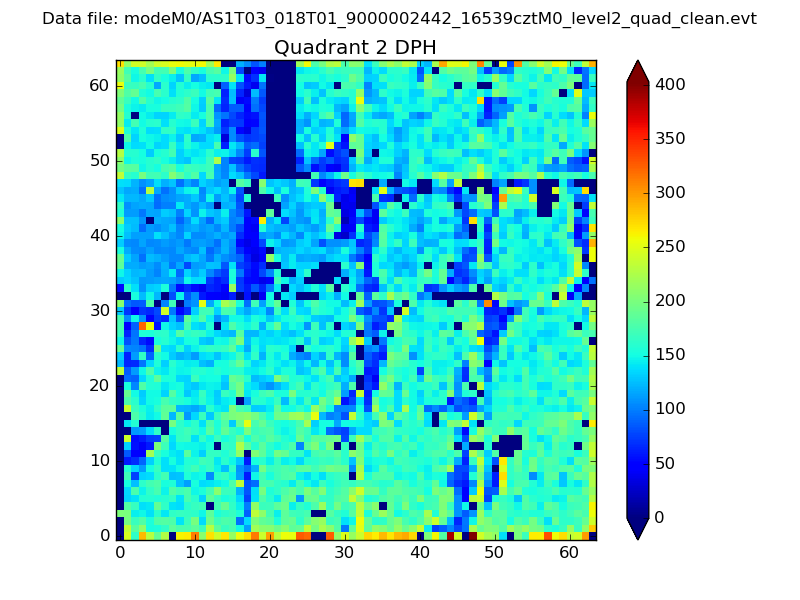 |
Quadrant C |
| Plot type | Count rate plots | Images |
|---|---|---|
| Comparison with Poisson distribution Blue bars denote a histogram of data divided into 1 sec bins. Red curve is a Poisson curve with rate = median count rate of data. |
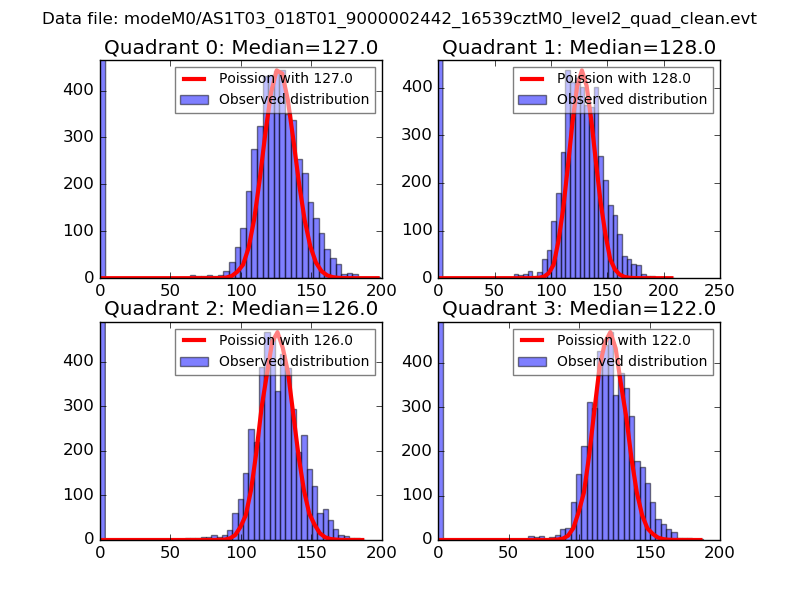 |
 |
| Quadrant-wise count rates Data is divided into 100 sec bins |
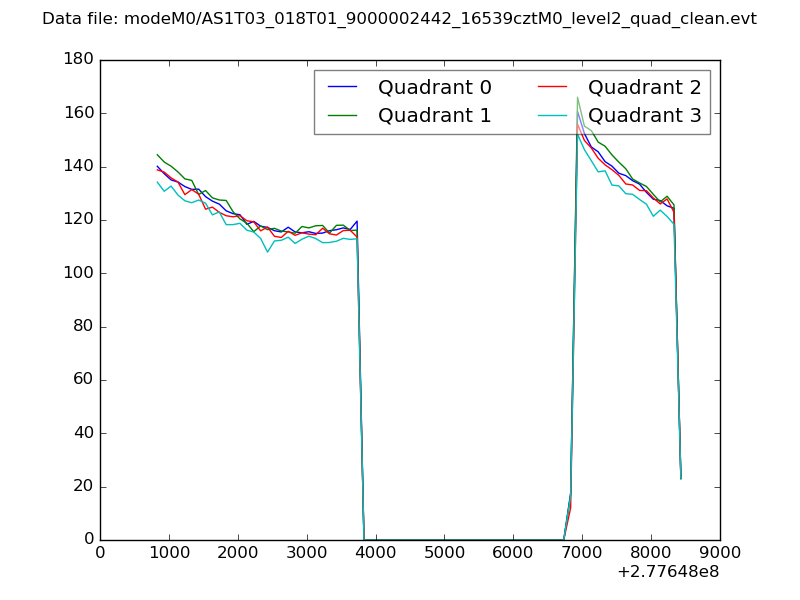 |
|
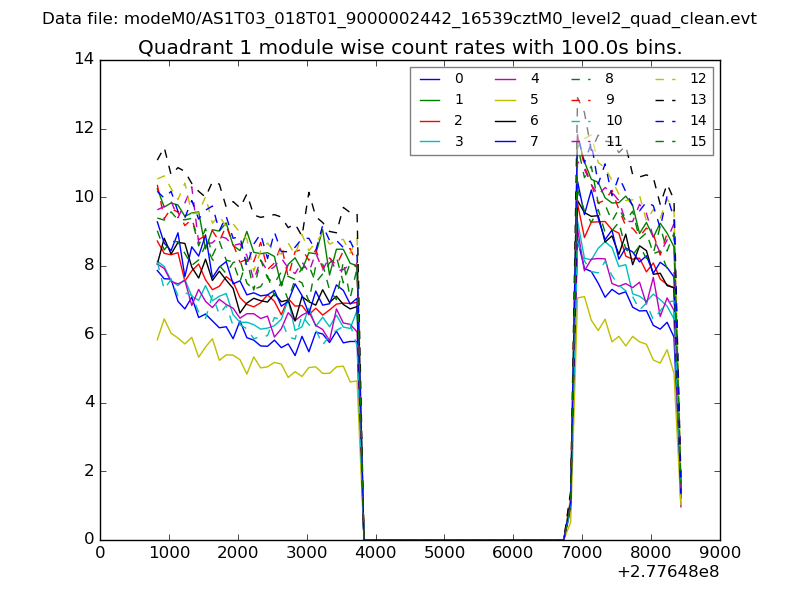
| Module-wise count rates for Quadrant A Data is divided into 100 sec bins |
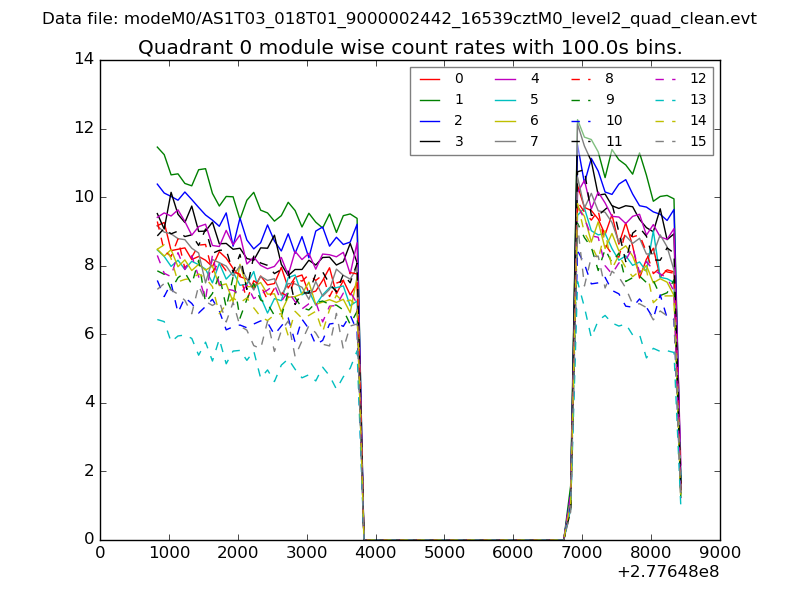 |
 |
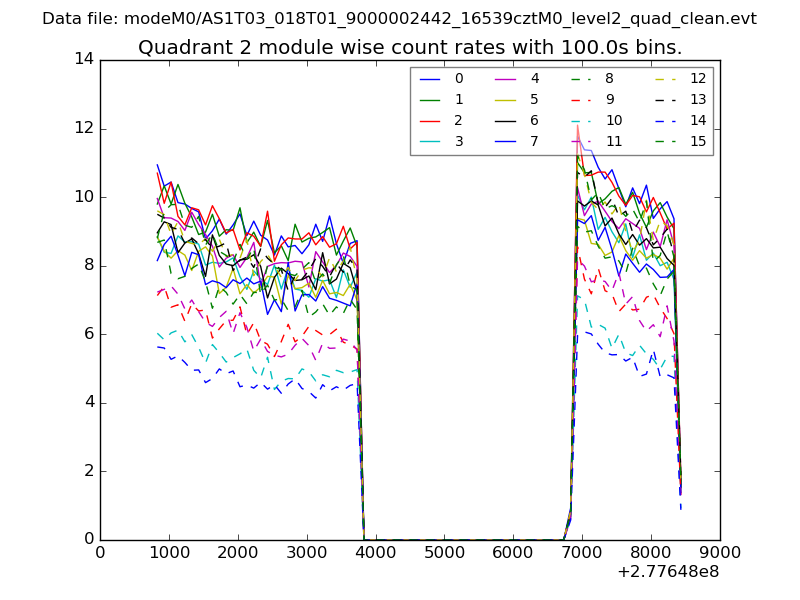
| Module-wise count rates for Quadrant B Data is divided into 100 sec bins |
 |
 |
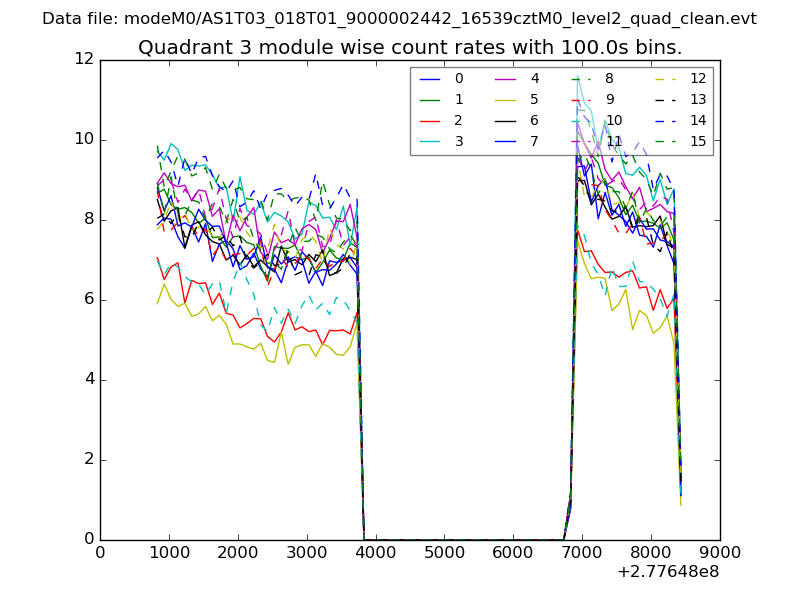
| Module-wise count rates for Quadrant C Data is divided into 100 sec bins |
 |
 |
| Module-wise count rates for Quadrant D Data is divided into 100 sec bins |
 |
 |
| Parameter | Plot |
|---|---|
| CZT HV Monitor | 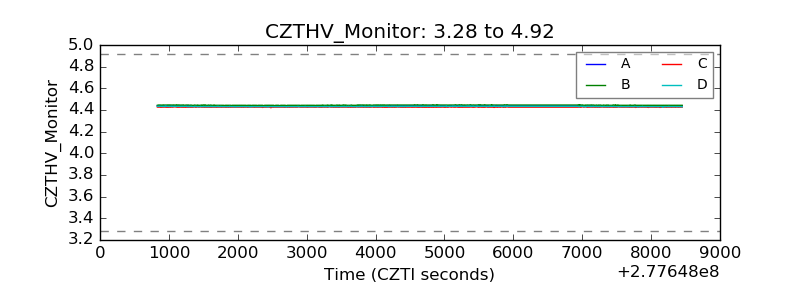 |
| D_VDD | 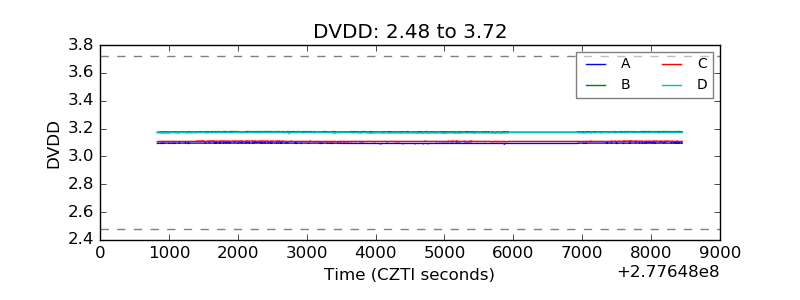 |
| Temperature 1 | 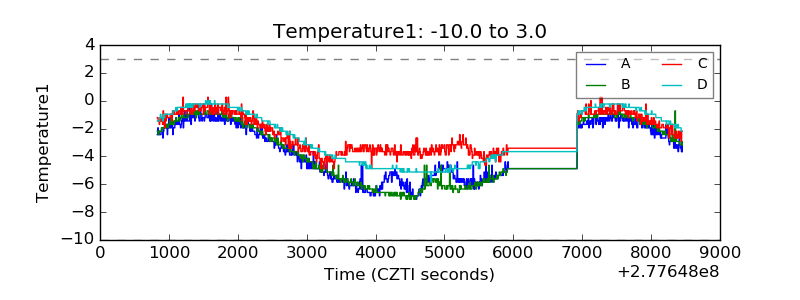 |
| Veto HV Monitor |  |
| Veto LLD | 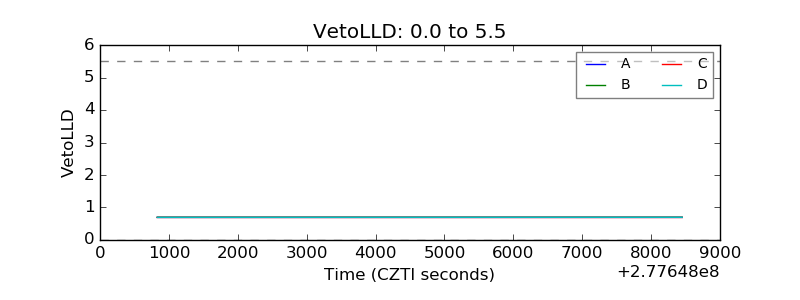 |
| Alpha Counter | 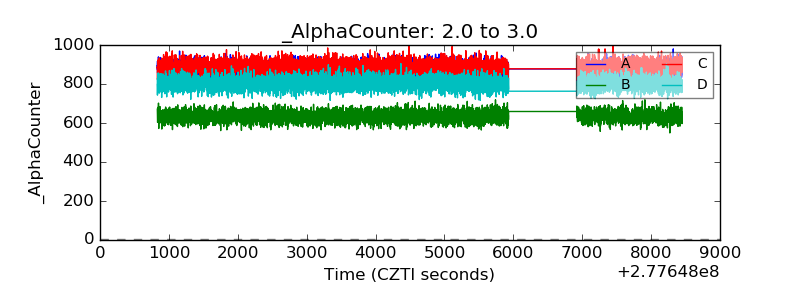 |
| _CPM_Rate | 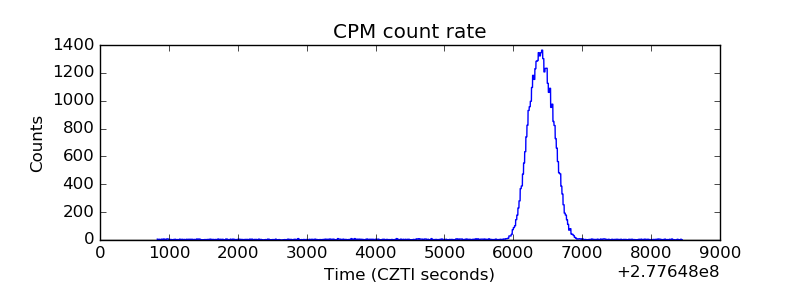 |
| CZT Counter | 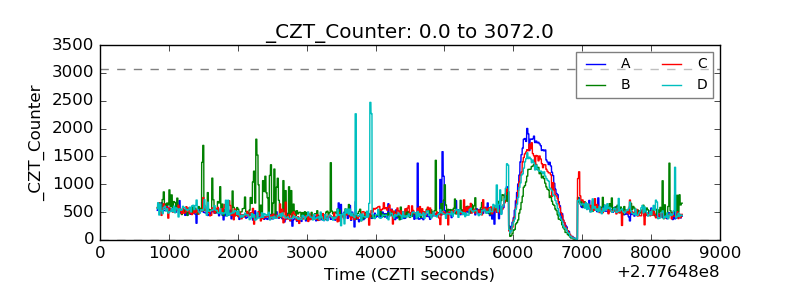 |
| +2.5 Volts monitor |  |
| +5 Volts monitor |  |
| _ROLL_ROT | 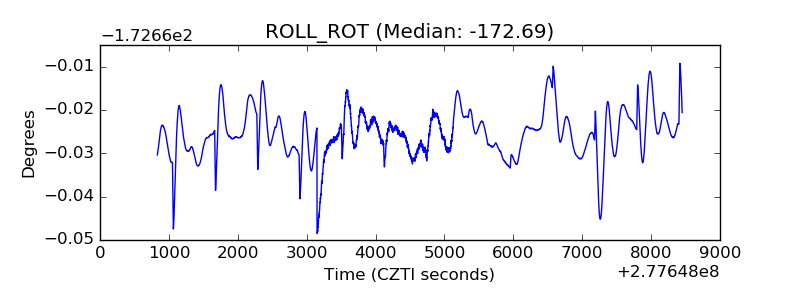 |
| _Roll_DEC | 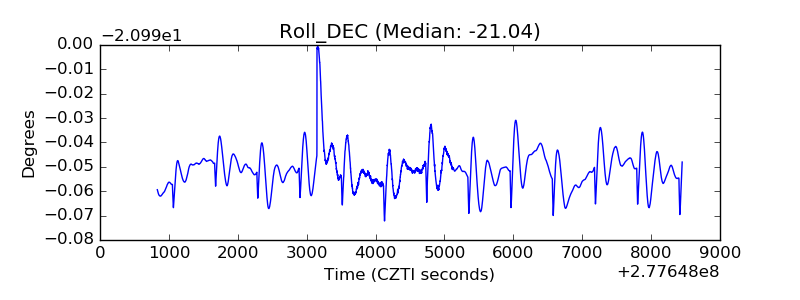 |
| _Roll_RA | 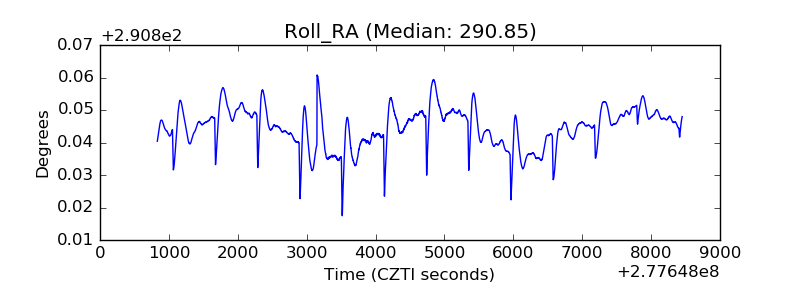 |
| Veto Counter | 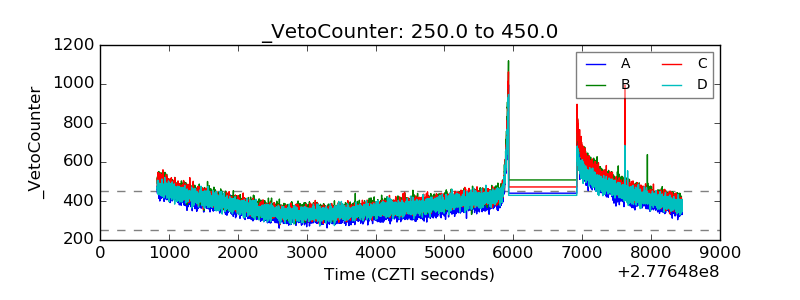 |