| Param | Original file | Final file |
|---|---|---|
| Filename | modeM0/AS1T03_018T01_9000002442_16541cztM0_level2.evt | modeM0/AS1T03_018T01_9000002442_16541cztM0_level2_quad_clean.evt |
| Size (bytes) | 463,233,600 | 88,856,640 |
| Size | 441.8 MB | 84.7 MB |
| Events in quadrant A | 3,179,648 | 565,055 |
| Events in quadrant B | 3,556,361 | 578,166 |
| Events in quadrant C | 3,494,927 | 558,980 |
| Events in quadrant D | 3,361,595 | 540,353 |
| Mode M0 | |||
|---|---|---|---|
| Quadrant | BADHDUFLAG | Total packets | Discarded packets |
| A | 0 | 13678 | 3 |
| B | 0 | 14690 | 2 |
| C | 0 | 14805 | 2 |
| D | 0 | 14167 | 2 |
| Mode M9 | |||
|---|---|---|---|
| Quadrant | BADHDUFLAG | Total packets | Discarded packets |
| A | 0 | 11 | 0 |
| B | 0 | 11 | 0 |
| C | 0 | 11 | 0 |
| D | 0 | 11 | 0 |
| Mode SS | |||
|---|---|---|---|
| Quadrant | BADHDUFLAG | Total packets | Discarded packets |
| A | 0 | 130 | 0 |
| B | 0 | 130 | 0 |
| C | 0 | 130 | 0 |
| D | 0 | 130 | 0 |
| Quadrant | Total seconds | Saturated seconds | Saturation percentage |
|---|---|---|---|
| A | 6429 | 40 | 0.622181% |
| B | 6429 | 60 | 0.933271% |
| C | 6429 | 92 | 1.431016% |
| D | 6430 | 74 | 1.150855% |
Noise dominated data is calculated using 1-second bins in cleaned event files. If a bin has >2000 counts, and if more than 50% of those come from <1% of pixels, then it is considered to be noise-dominated and hence unusable.
| Quadrant | # 1 sec bins | Bins with >0 counts | Bins with >2000 counts | High rate bins dominated by noise | Noise dominated (total time) | Noise dominated (detector-on time) | Marked lightcurve |
|---|---|---|---|---|---|---|---|
| A | 7545 | 6430 | 1 | 1 | 0.01% | 0.02% | 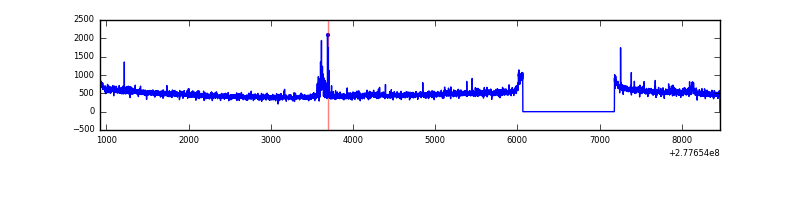 |
| B | 7545 | 6430 | 10 | 10 | 0.13% | 0.16% | 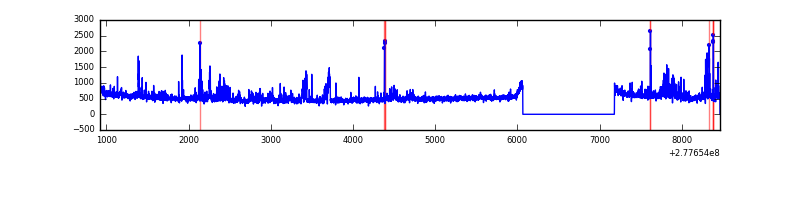 |
| C | 7545 | 6430 | 2 | 2 | 0.03% | 0.03% | 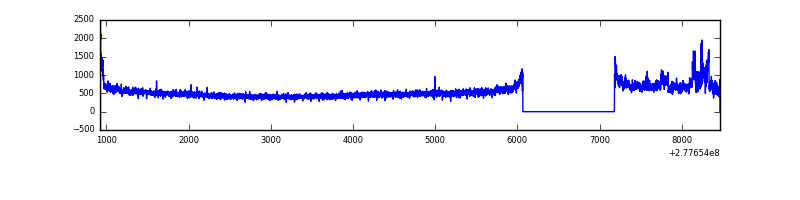 |
| D | 7546 | 6431 | 56 | 56 | 0.74% | 0.87% |  |
Top three noisy pixels from each quadrant. If the there are fewer than three noisy pixels in the level2.evt file, extra rows are filled as -1
| Pixel properties | Quadrant properties | ||||||
|---|---|---|---|---|---|---|---|
| Quadrant | DetID | PixID | Counts | Sigma | Mean | Median | Sigma |
| A | 3 | 1 | 55049 | 338.2 | 795 | 779 | 160.5 |
| A | 15 | 174 | 55046 | 338.18 | 795 | 779 | 160.5 |
| A | 15 | 223 | 8929 | 50.79 | 795 | 779 | 160.5 |
| B | 15 | 35 | 128446 | 834.66 | 799 | 780 | 153.0 |
| B | 7 | 220 | 54823 | 353.32 | 799 | 780 | 153.0 |
| B | 0 | 229 | 50051 | 322.13 | 799 | 780 | 153.0 |
| C | 3 | 233 | 396605 | 2225.95 | 761 | 768 | 177.8 |
| C | 14 | 238 | 117348 | 655.58 | 761 | 768 | 177.8 |
| C | 7 | 247 | 13483 | 71.5 | 761 | 768 | 177.8 |
| D | 1 | 52 | 208796 | 1109.46 | 766 | 743 | 187.5 |
| D | 10 | 70 | 117652 | 623.43 | 766 | 743 | 187.5 |
| D | 9 | 85 | 79348 | 419.17 | 766 | 743 | 187.5 |
Histogram calculated using DETX and DETY for each event in the final _common_clean file
| Quadrant A |  |
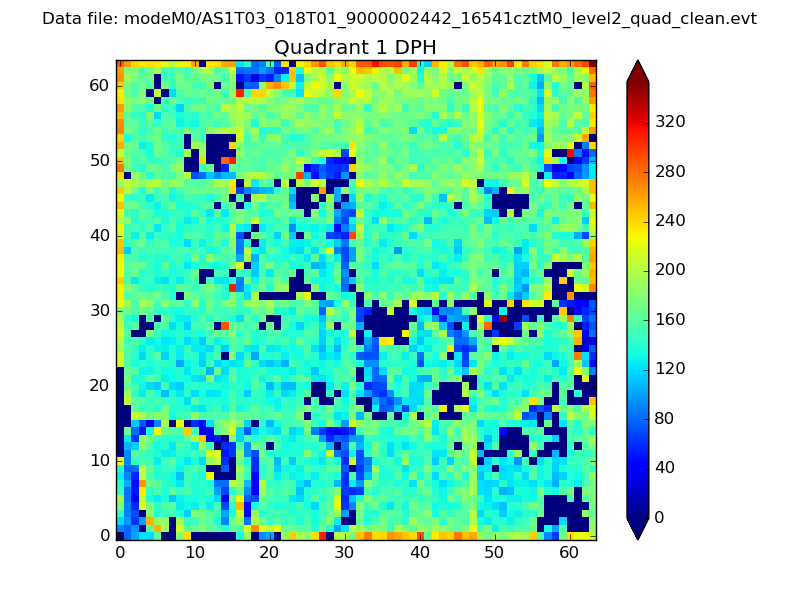 |
Quadrant B |
|---|---|---|---|
| Quadrant D |  |
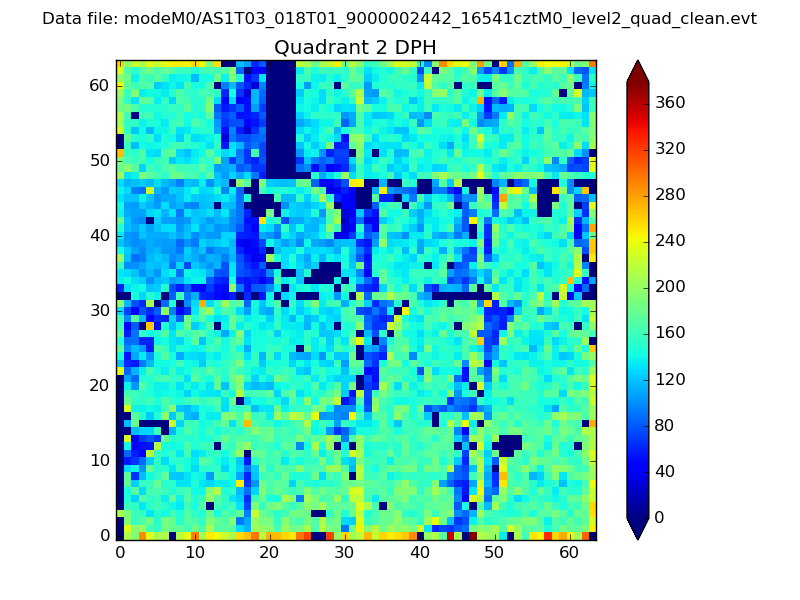 |
Quadrant C |
| Plot type | Count rate plots | Images |
|---|---|---|
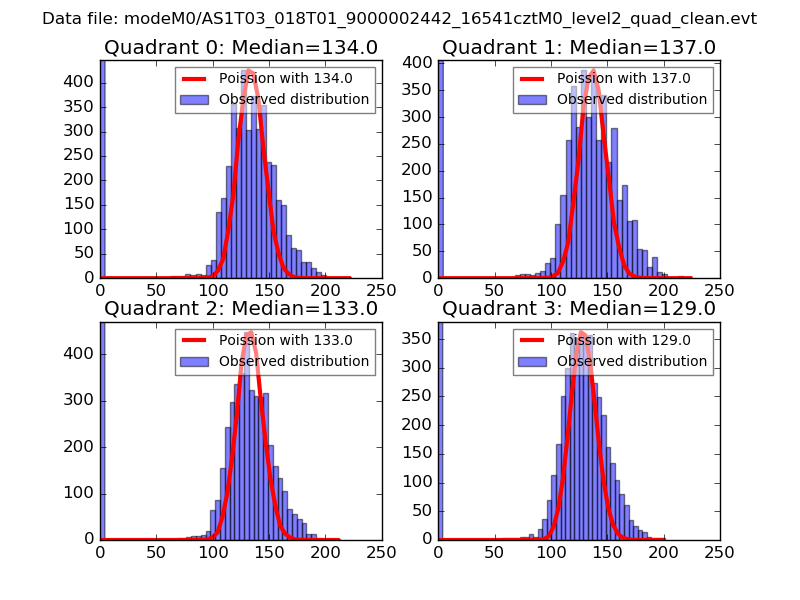
| Comparison with Poisson distribution Blue bars denote a histogram of data divided into 1 sec bins. Red curve is a Poisson curve with rate = median count rate of data. |
 |
 |
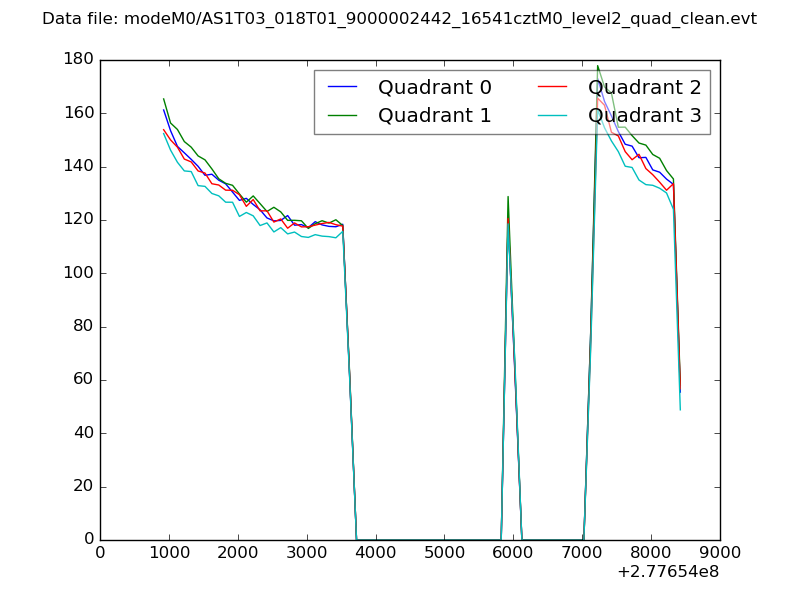
| Quadrant-wise count rates Data is divided into 100 sec bins |
 |
|
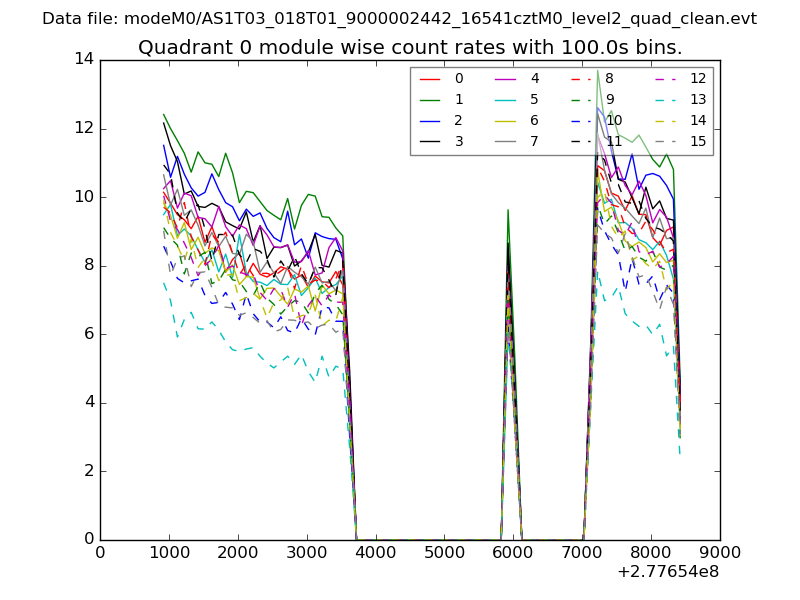
| Module-wise count rates for Quadrant A Data is divided into 100 sec bins |
 |
 |
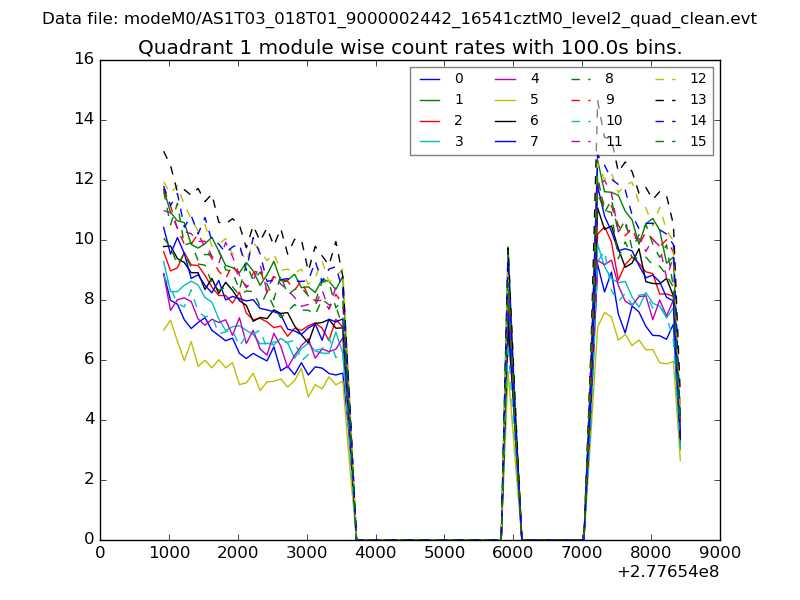
| Module-wise count rates for Quadrant B Data is divided into 100 sec bins |
 |
 |
| Module-wise count rates for Quadrant C Data is divided into 100 sec bins |
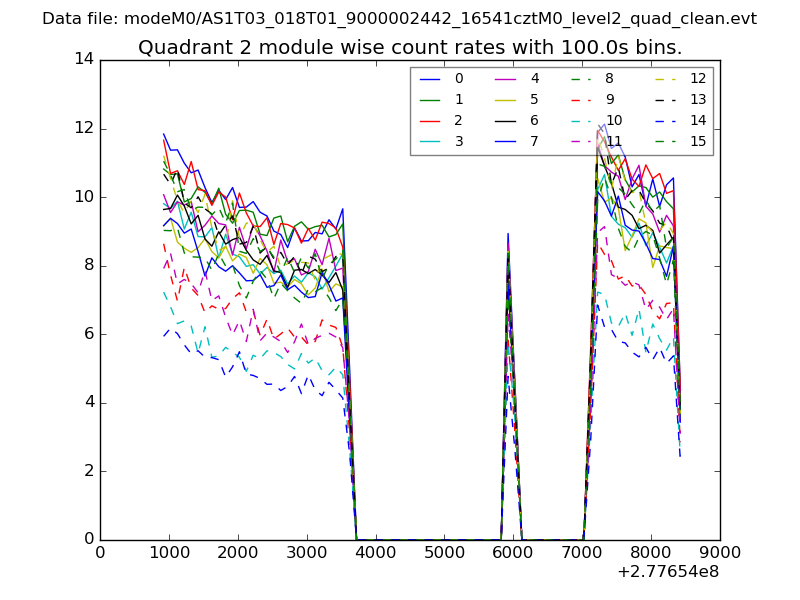 |
 |
| Module-wise count rates for Quadrant D Data is divided into 100 sec bins |
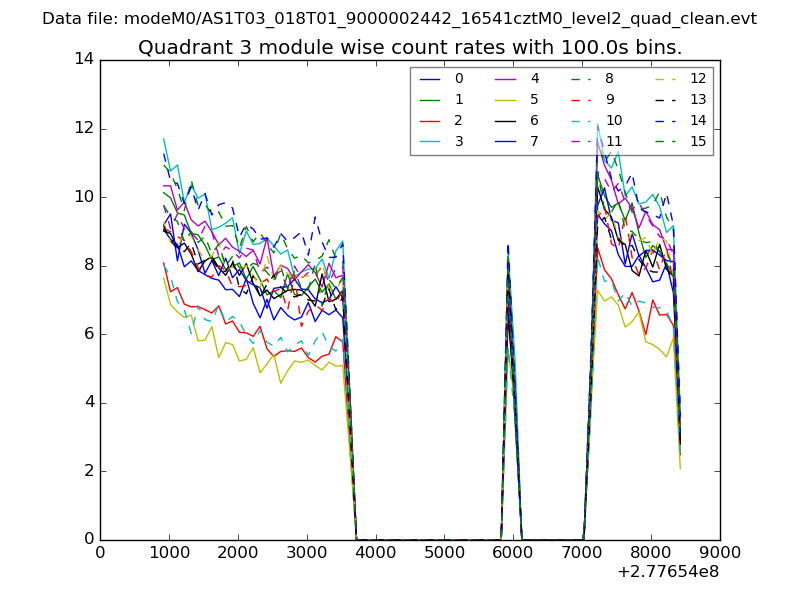 |
 |
| Parameter | Plot |
|---|---|
| CZT HV Monitor | 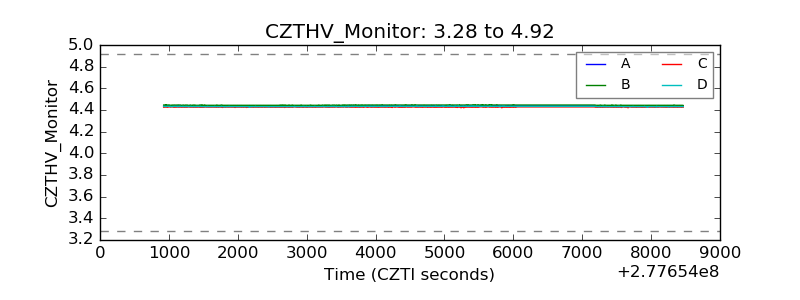 |
| D_VDD |  |
| Temperature 1 | 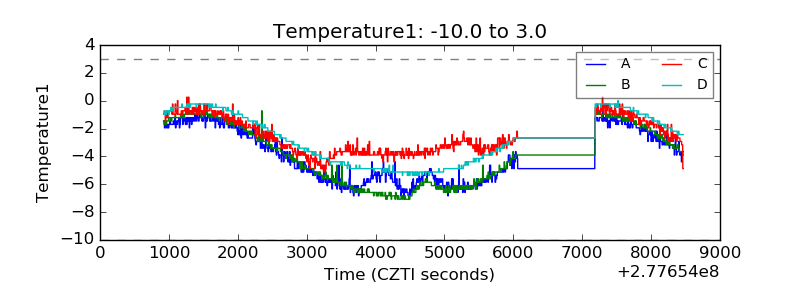 |
| Veto HV Monitor | 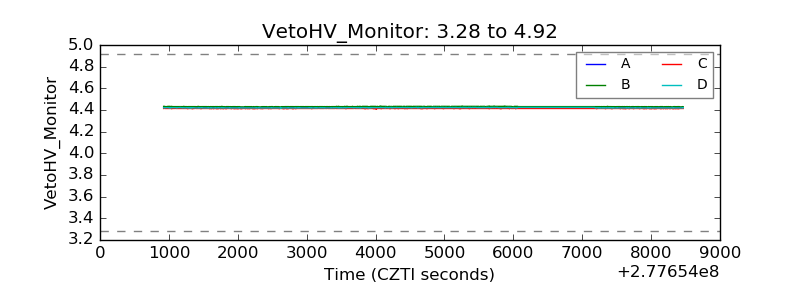 |
| Veto LLD | 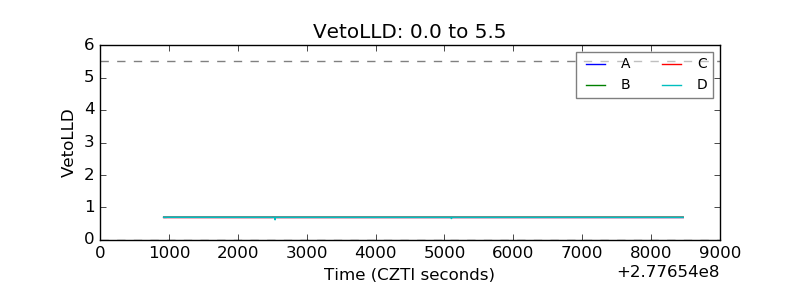 |
| Alpha Counter | 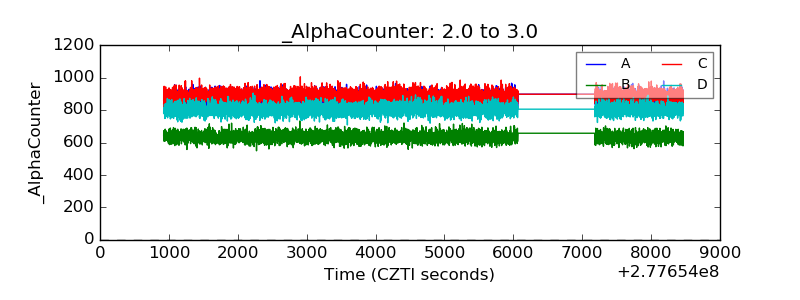 |
| _CPM_Rate | 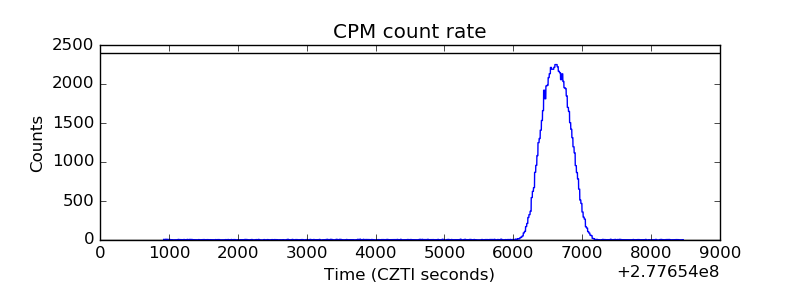 |
| CZT Counter | 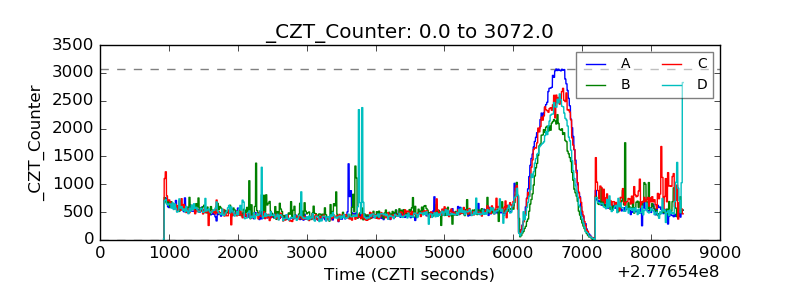 |
| +2.5 Volts monitor |  |
| +5 Volts monitor | 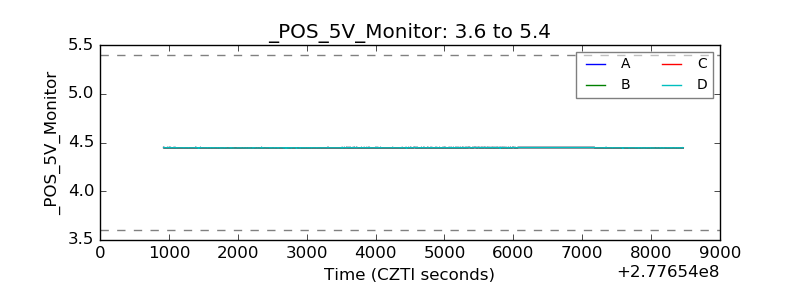 |
| _ROLL_ROT | 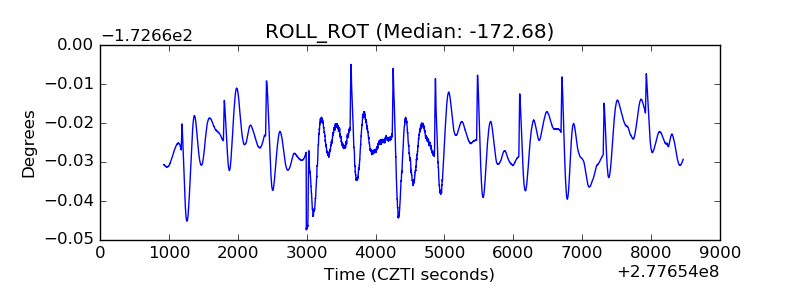 |
| _Roll_DEC | 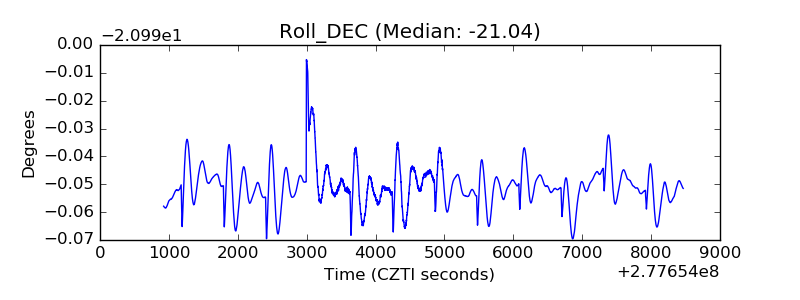 |
| _Roll_RA | 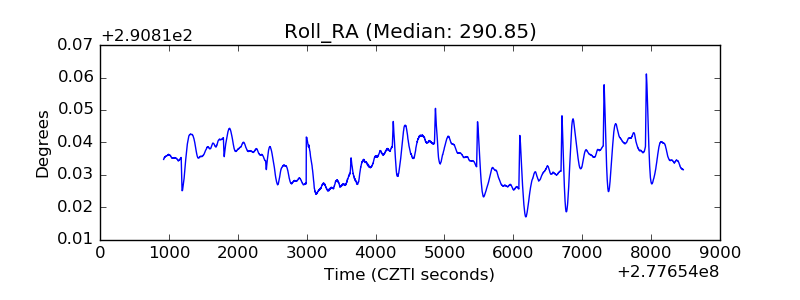 |
| Veto Counter | 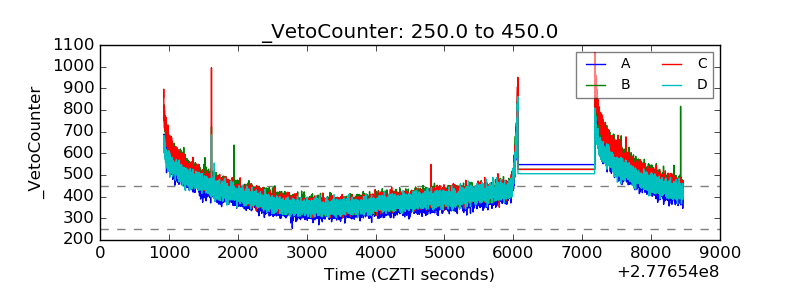 |