| Param | Original file | Final file |
|---|---|---|
| Filename | modeM0/AS1T03_018T01_9000002442_16543cztM0_level2.evt | modeM0/AS1T03_018T01_9000002442_16543cztM0_level2_quad_clean.evt |
| Size (bytes) | 500,287,680 | 90,313,920 |
| Size | 477.1 MB | 86.1 MB |
| Events in quadrant A | 3,166,855 | 585,440 |
| Events in quadrant B | 4,251,606 | 588,281 |
| Events in quadrant C | 4,048,929 | 574,015 |
| Events in quadrant D | 3,264,492 | 555,648 |
| Mode M0 | |||
|---|---|---|---|
| Quadrant | BADHDUFLAG | Total packets | Discarded packets |
| A | 0 | 13216 | 3 |
| B | 0 | 16568 | 2 |
| C | 0 | 16219 | 2 |
| D | 0 | 13608 | 2 |
| Mode M9 | |||
|---|---|---|---|
| Quadrant | BADHDUFLAG | Total packets | Discarded packets |
| A | 0 | 16 | 0 |
| B | 0 | 16 | 0 |
| C | 0 | 16 | 0 |
| D | 0 | 17 | 0 |
| Mode SS | |||
|---|---|---|---|
| Quadrant | BADHDUFLAG | Total packets | Discarded packets |
| A | 0 | 126 | 0 |
| B | 0 | 126 | 0 |
| C | 0 | 126 | 0 |
| D | 0 | 126 | 0 |
| Quadrant | Total seconds | Saturated seconds | Saturation percentage |
|---|---|---|---|
| A | 6181 | 36 | 0.582430% |
| B | 6181 | 326 | 5.274227% |
| C | 6181 | 144 | 2.329720% |
| D | 6181 | 65 | 1.051610% |
Noise dominated data is calculated using 1-second bins in cleaned event files. If a bin has >2000 counts, and if more than 50% of those come from <1% of pixels, then it is considered to be noise-dominated and hence unusable.
| Quadrant | # 1 sec bins | Bins with >0 counts | Bins with >2000 counts | High rate bins dominated by noise | Noise dominated (total time) | Noise dominated (detector-on time) | Marked lightcurve |
|---|---|---|---|---|---|---|---|
| A | 7472 | 6183 | 2 | 2 | 0.03% | 0.03% | 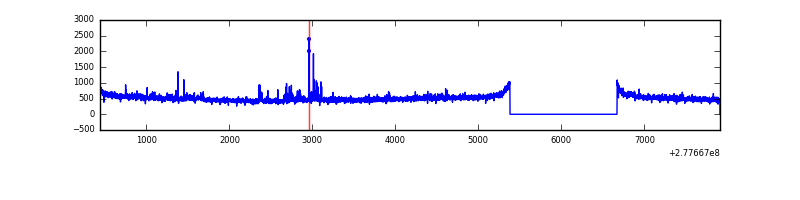 |
| B | 7472 | 6182 | 275 | 275 | 3.68% | 4.45% | 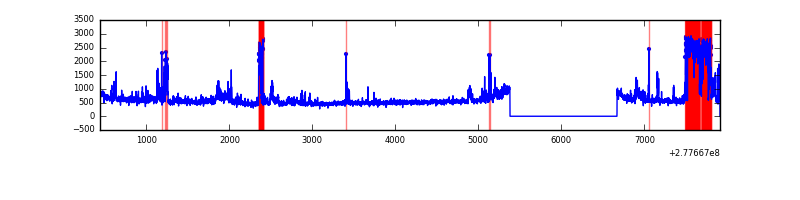 |
| C | 7472 | 6182 | 26 | 26 | 0.35% | 0.42% | 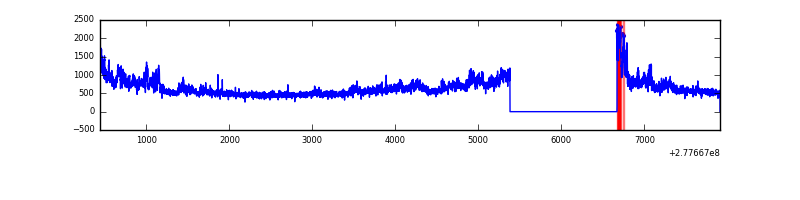 |
| D | 7472 | 6182 | 44 | 44 | 0.59% | 0.71% | 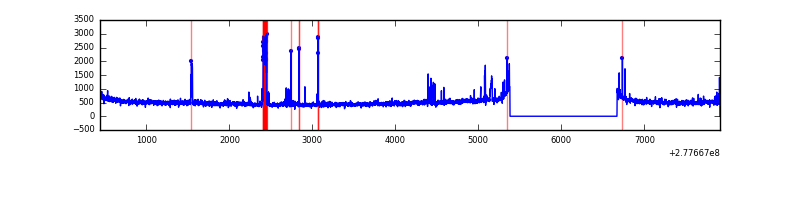 |
Top three noisy pixels from each quadrant. If the there are fewer than three noisy pixels in the level2.evt file, extra rows are filled as -1
| Pixel properties | Quadrant properties | ||||||
|---|---|---|---|---|---|---|---|
| Quadrant | DetID | PixID | Counts | Sigma | Mean | Median | Sigma |
| A | 15 | 174 | 60579 | 373.01 | 793 | 779 | 160.3 |
| A | 3 | 1 | 43864 | 268.75 | 793 | 779 | 160.3 |
| A | 15 | 223 | 11415 | 66.34 | 793 | 779 | 160.3 |
| B | 10 | 16 | 627152 | 4232.01 | 790 | 773 | 148.0 |
| B | 15 | 35 | 169734 | 1141.55 | 790 | 773 | 148.0 |
| B | 0 | 229 | 143028 | 961.12 | 790 | 773 | 148.0 |
| C | 3 | 233 | 963003 | 5461.43 | 760 | 768 | 176.2 |
| C | 14 | 238 | 119318 | 672.86 | 760 | 768 | 176.2 |
| C | 7 | 247 | 6273 | 31.24 | 760 | 768 | 176.2 |
| D | 1 | 52 | 262048 | 1420.27 | 758 | 740 | 184.0 |
| D | 10 | 70 | 101023 | 545.06 | 758 | 740 | 184.0 |
| D | 2 | 234 | 21598 | 113.37 | 758 | 740 | 184.0 |
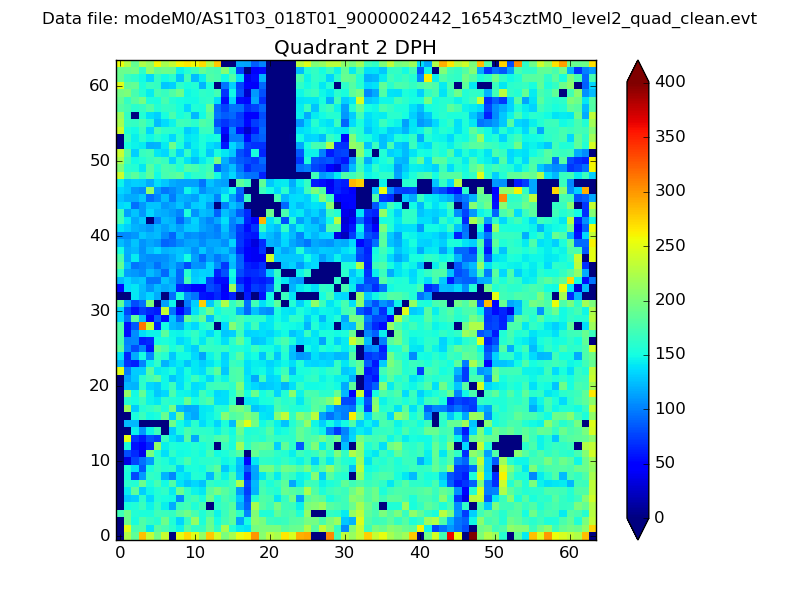
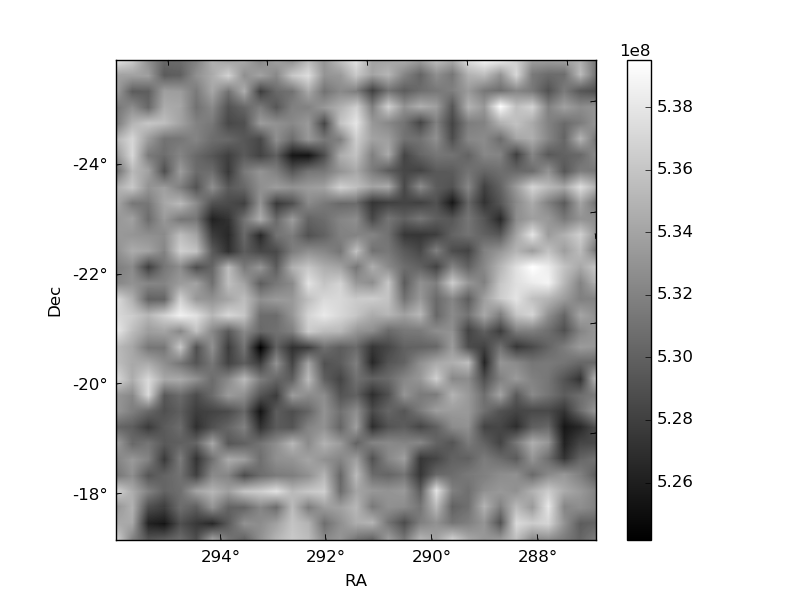
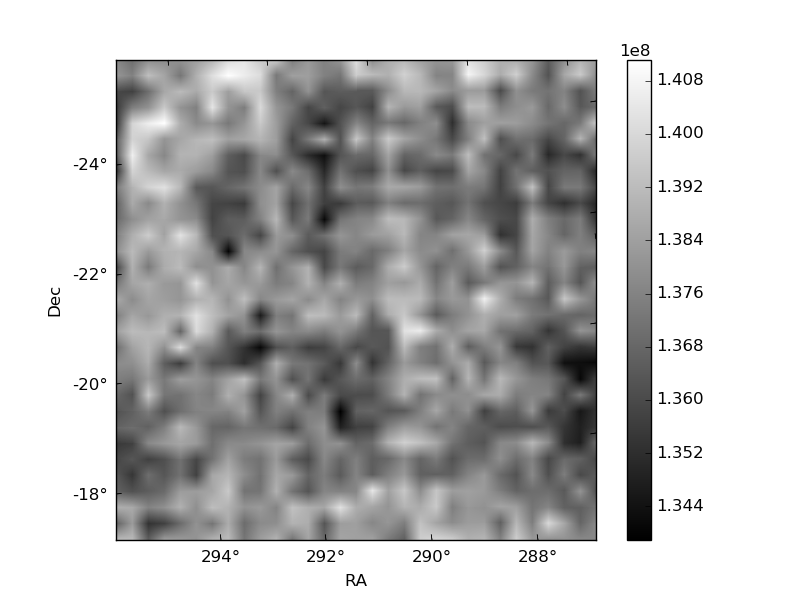
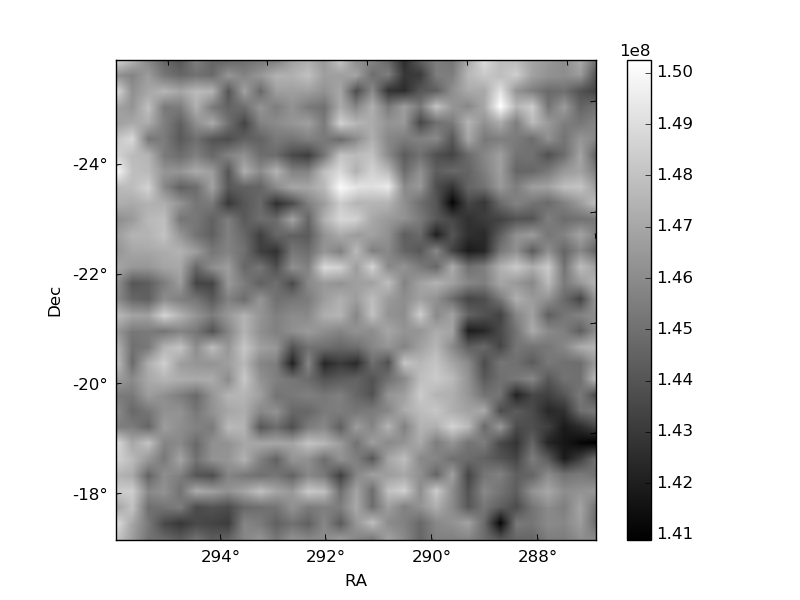
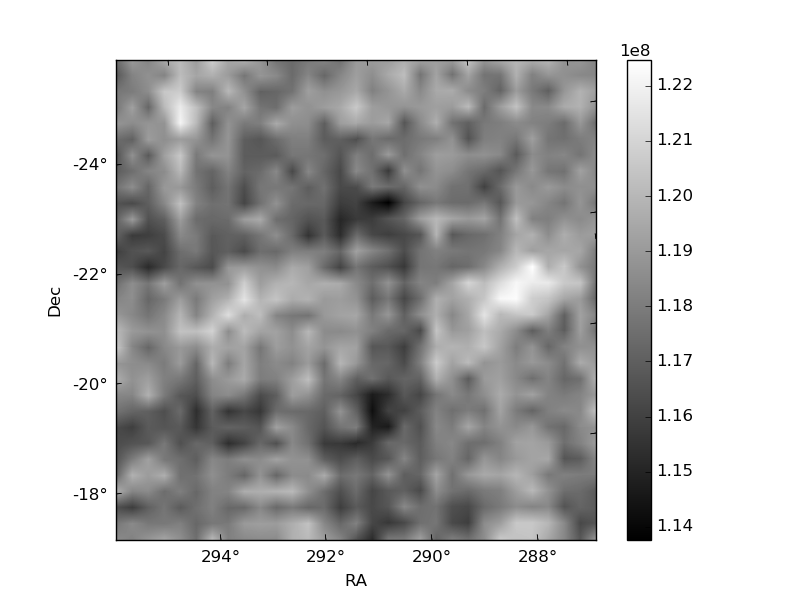
Histogram calculated using DETX and DETY for each event in the final _common_clean file
| Quadrant A | 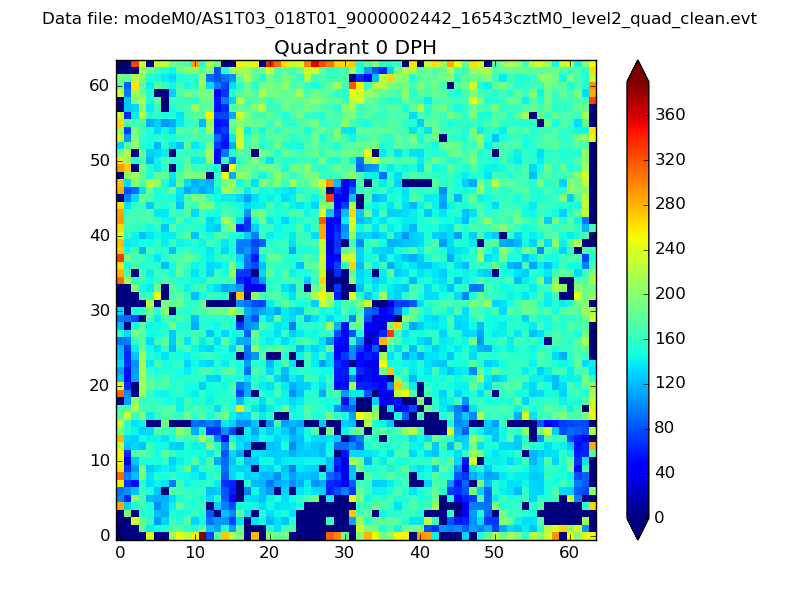 |
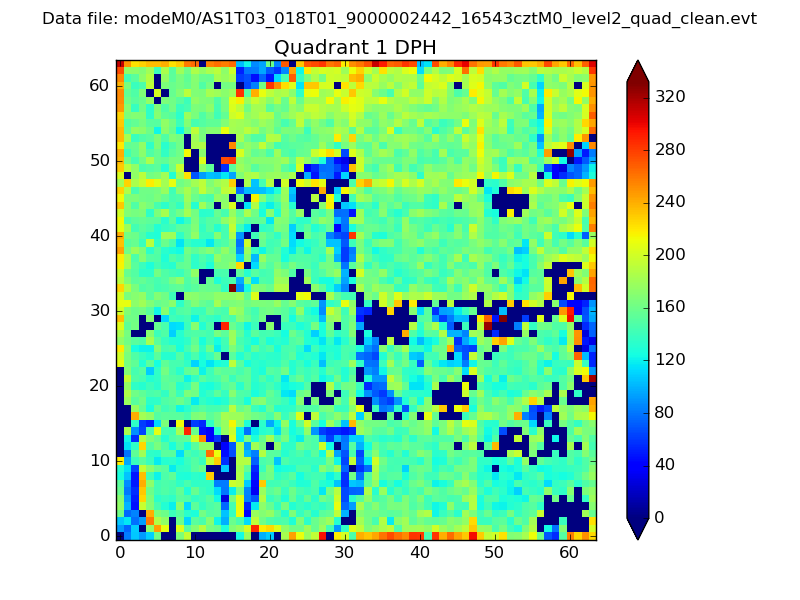 |
Quadrant B |
|---|---|---|---|
| Quadrant D | 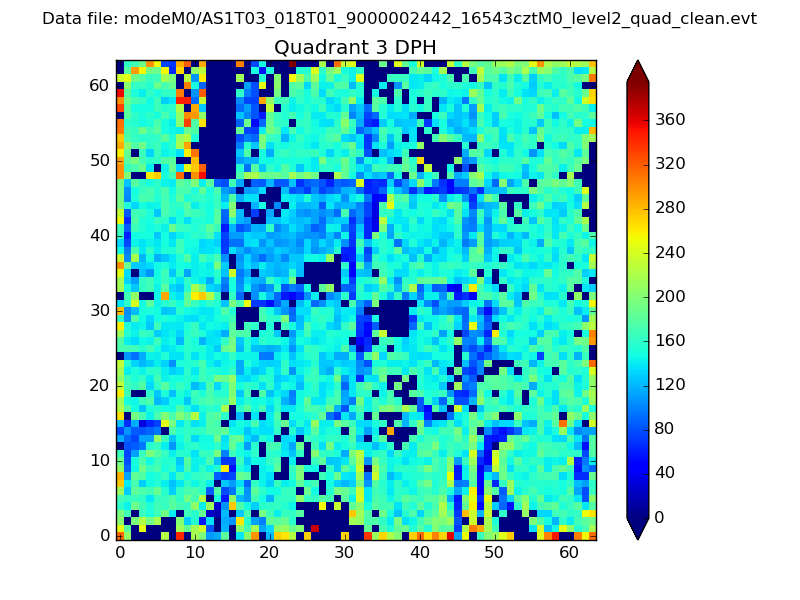 |
 |
Quadrant C |
| Plot type | Count rate plots | Images |
|---|---|---|
| Comparison with Poisson distribution Blue bars denote a histogram of data divided into 1 sec bins. Red curve is a Poisson curve with rate = median count rate of data. |
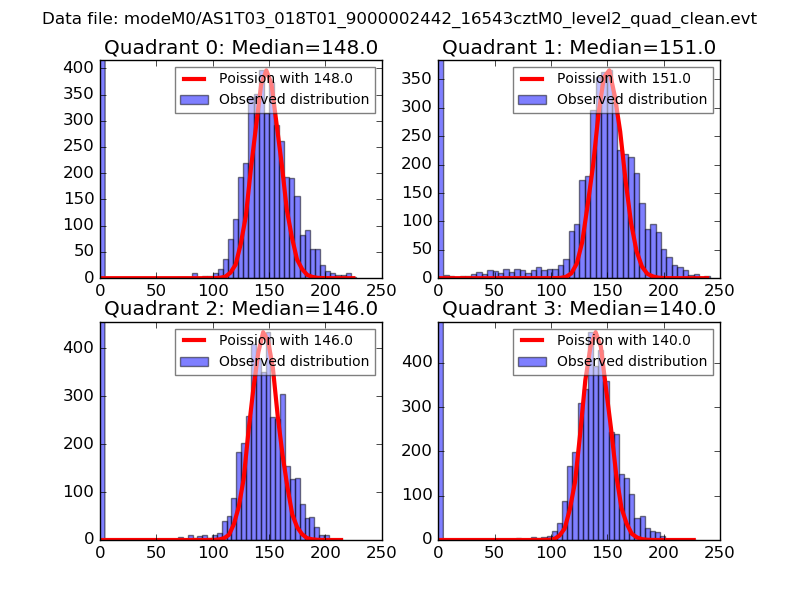 |
 |
| Quadrant-wise count rates Data is divided into 100 sec bins |
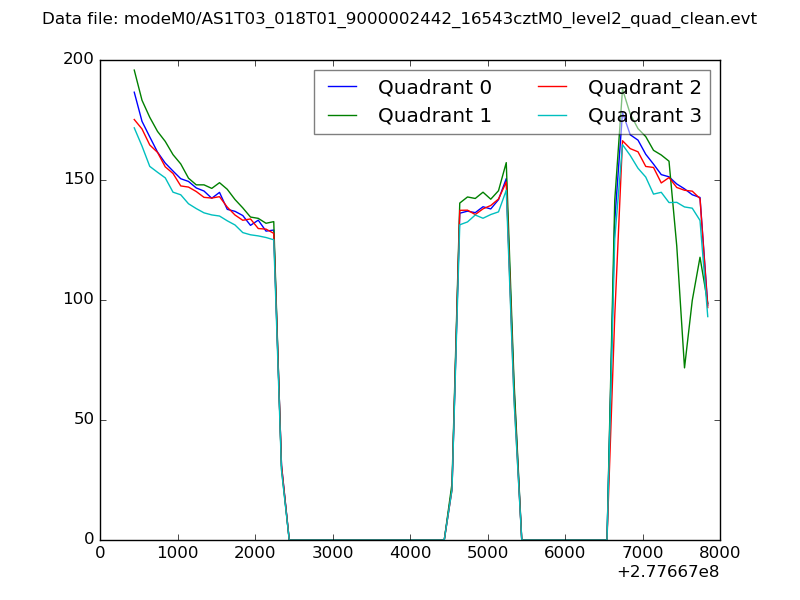 |
|
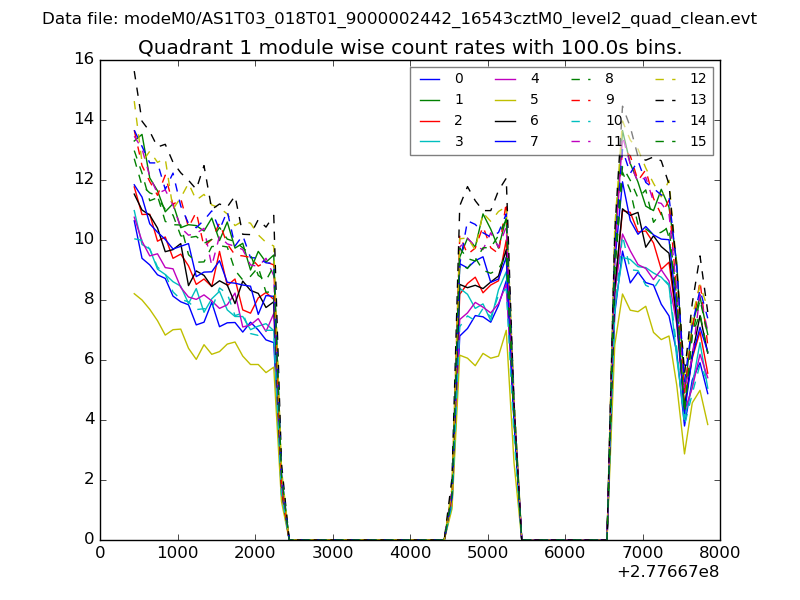
| Module-wise count rates for Quadrant A Data is divided into 100 sec bins |
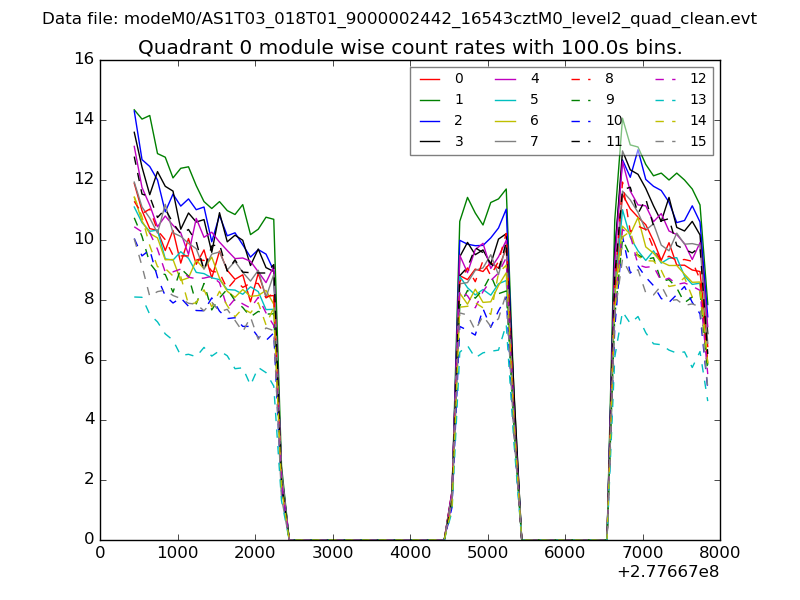 |
 |
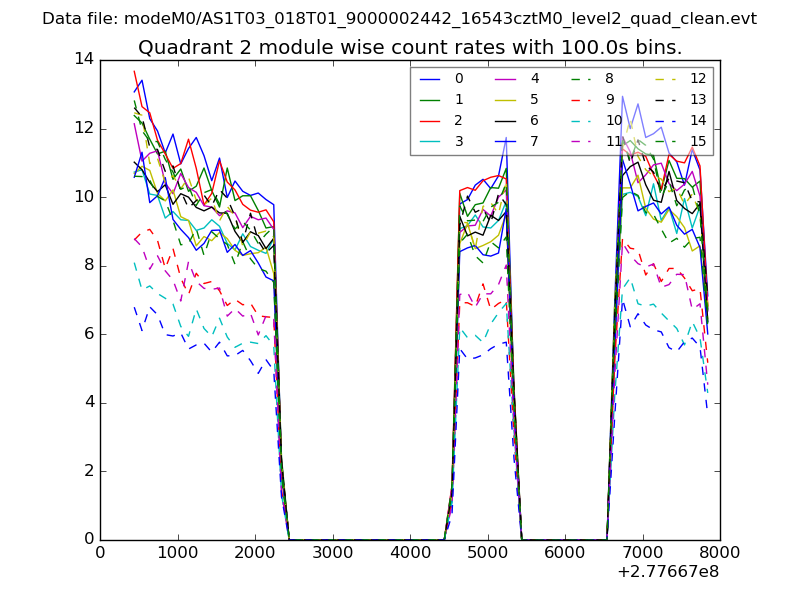
| Module-wise count rates for Quadrant B Data is divided into 100 sec bins |
 |
 |
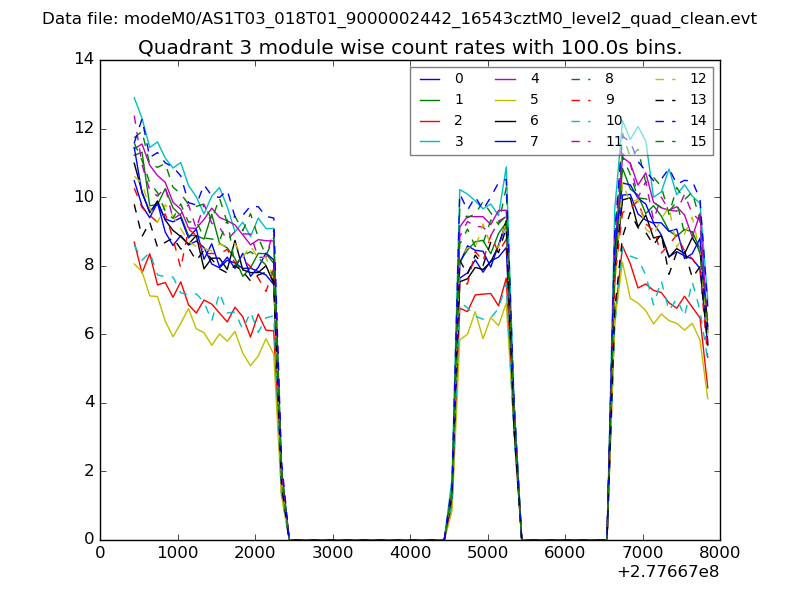
| Module-wise count rates for Quadrant C Data is divided into 100 sec bins |
 |
 |
| Module-wise count rates for Quadrant D Data is divided into 100 sec bins |
 |
 |
| Parameter | Plot |
|---|---|
| CZT HV Monitor |  |
| D_VDD | 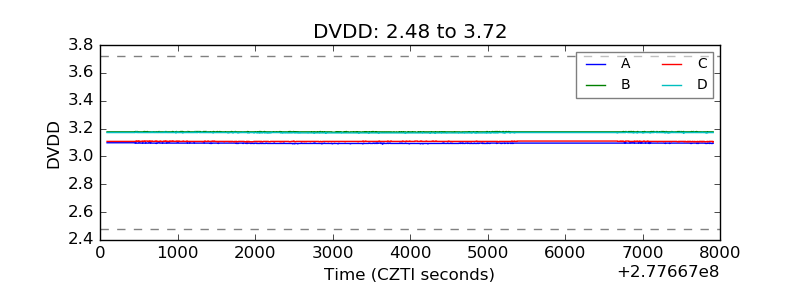 |
| Temperature 1 | 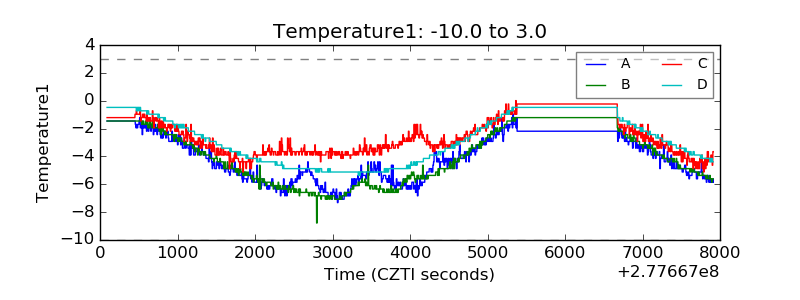 |
| Veto HV Monitor | 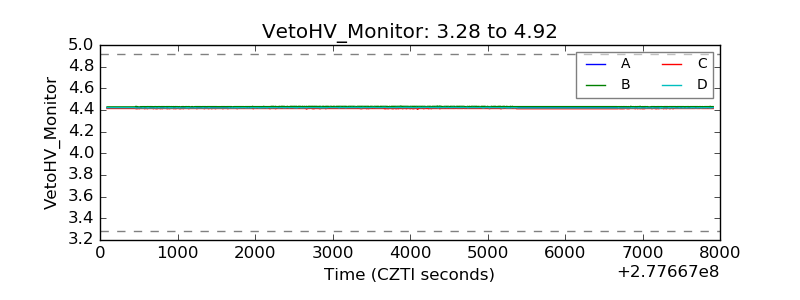 |
| Veto LLD | 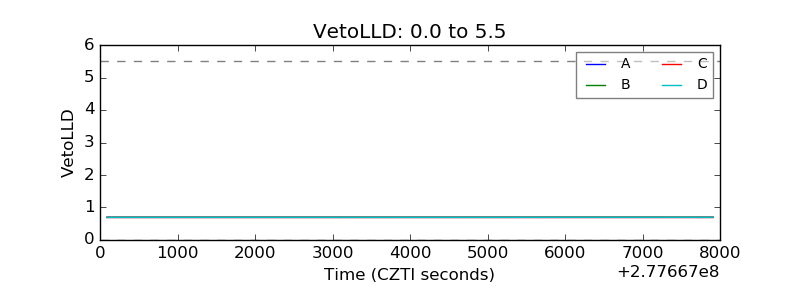 |
| Alpha Counter | 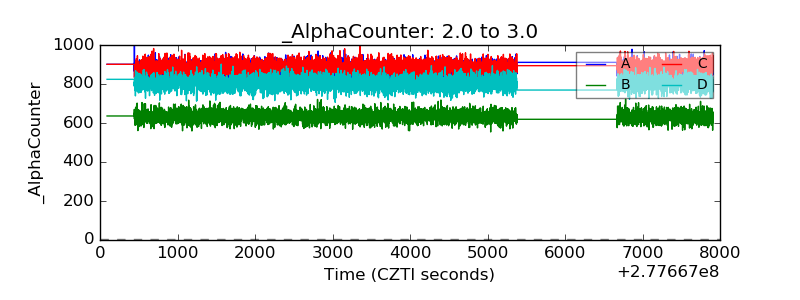 |
| _CPM_Rate | 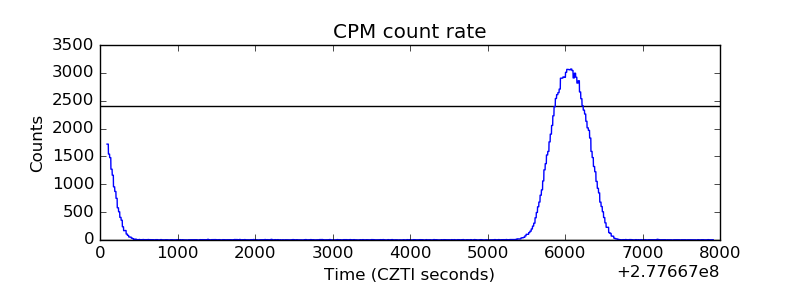 |
| CZT Counter | 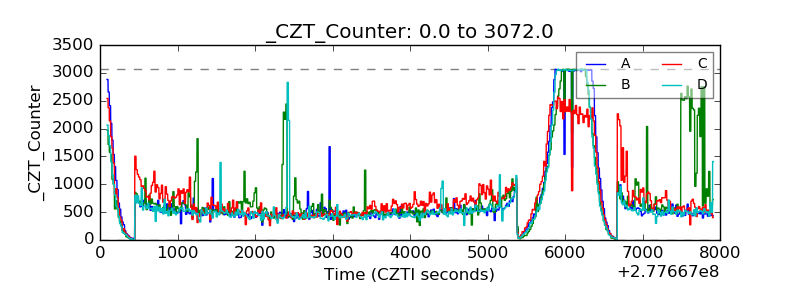 |
| +2.5 Volts monitor |  |
| +5 Volts monitor | 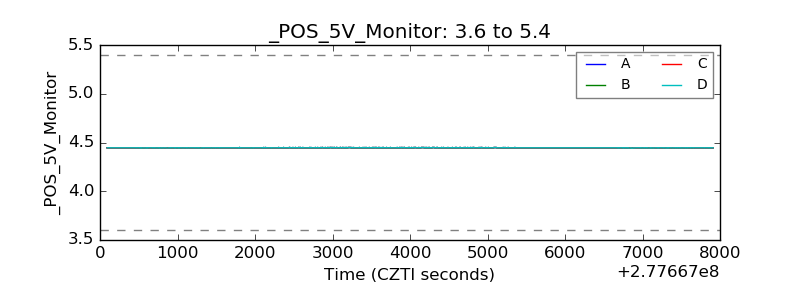 |
| _ROLL_ROT | 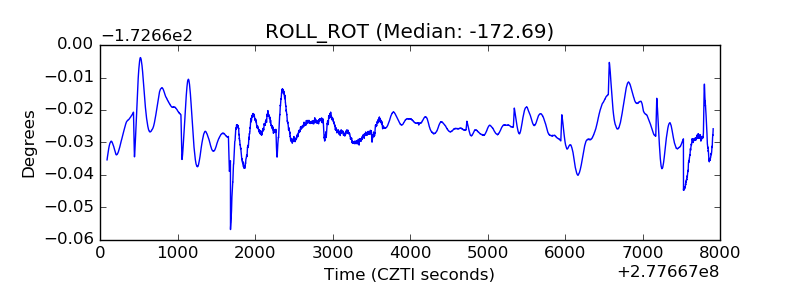 |
| _Roll_DEC | 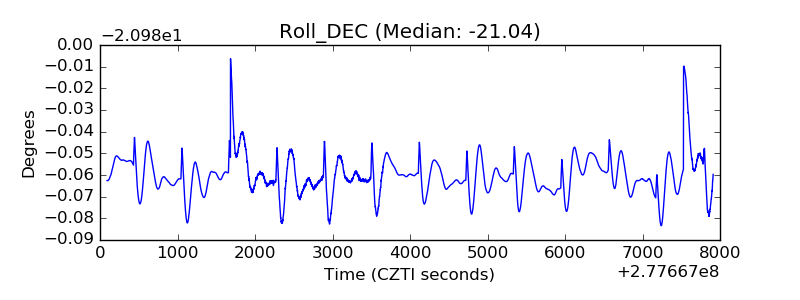 |
| _Roll_RA | 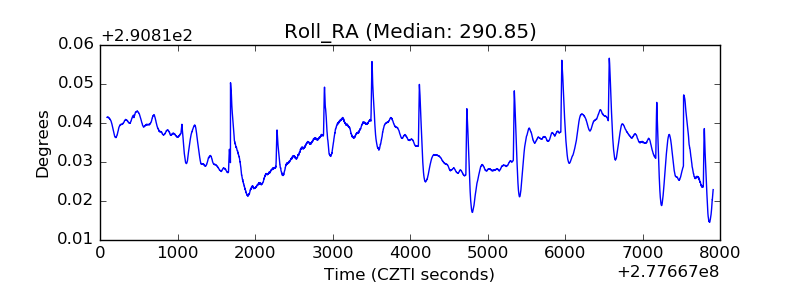 |
| Veto Counter | 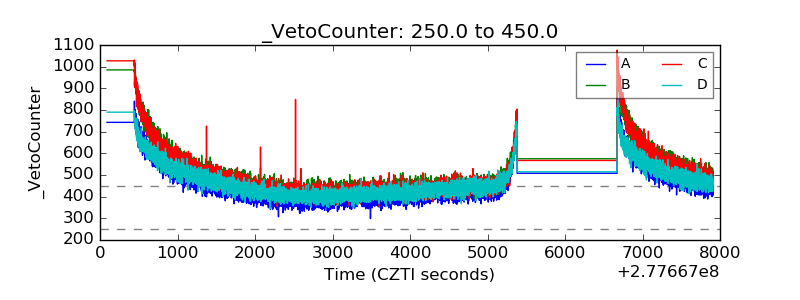 |