| Param | Original file | Final file |
|---|---|---|
| Filename | modeM0/AS1T03_018T01_9000002442_16545cztM0_level2.evt | modeM0/AS1T03_018T01_9000002442_16545cztM0_level2_quad_clean.evt |
| Size (bytes) | 575,956,800 | 77,964,480 |
| Size | 549.3 MB | 74.4 MB |
| Events in quadrant A | 3,028,512 | 490,425 |
| Events in quadrant B | 3,552,543 | 503,343 |
| Events in quadrant C | 4,893,099 | 481,331 |
| Events in quadrant D | 5,548,742 | 452,153 |
| Mode M0 | |||
|---|---|---|---|
| Quadrant | BADHDUFLAG | Total packets | Discarded packets |
| A | 0 | 12849 | 3 |
| B | 0 | 14419 | 2 |
| C | 0 | 18466 | 2 |
| D | 0 | 20738 | 2 |
| Mode M9 | |||
|---|---|---|---|
| Quadrant | BADHDUFLAG | Total packets | Discarded packets |
| A | 0 | 24 | 0 |
| B | 0 | 24 | 0 |
| C | 0 | 24 | 0 |
| D | 0 | 25 | 0 |
| Mode SS | |||
|---|---|---|---|
| Quadrant | BADHDUFLAG | Total packets | Discarded packets |
| A | 0 | 126 | 0 |
| B | 0 | 126 | 0 |
| C | 0 | 126 | 0 |
| D | 0 | 126 | 0 |
| Quadrant | Total seconds | Saturated seconds | Saturation percentage |
|---|---|---|---|
| A | 6211 | 13 | 0.209306% |
| B | 6211 | 79 | 1.271937% |
| C | 6211 | 431 | 6.939301% |
| D | 6211 | 158 | 2.543874% |
Noise dominated data is calculated using 1-second bins in cleaned event files. If a bin has >2000 counts, and if more than 50% of those come from <1% of pixels, then it is considered to be noise-dominated and hence unusable.
| Quadrant | # 1 sec bins | Bins with >0 counts | Bins with >2000 counts | High rate bins dominated by noise | Noise dominated (total time) | Noise dominated (detector-on time) | Marked lightcurve |
|---|---|---|---|---|---|---|---|
| A | 7511 | 6212 | 0 | 0 | 0.00% | 0.00% | 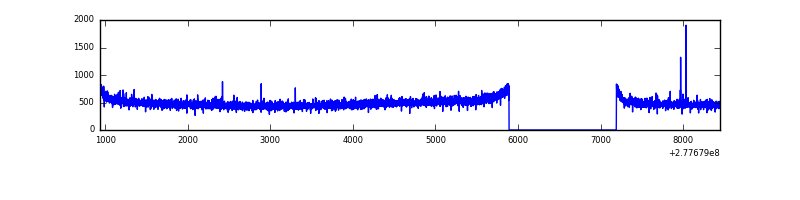 |
| B | 7512 | 6212 | 20 | 20 | 0.27% | 0.32% | 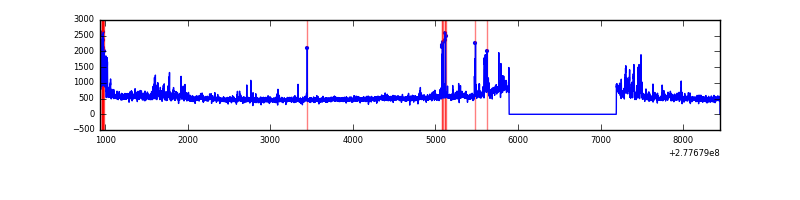 |
| C | 7511 | 6211 | 305 | 305 | 4.06% | 4.91% | 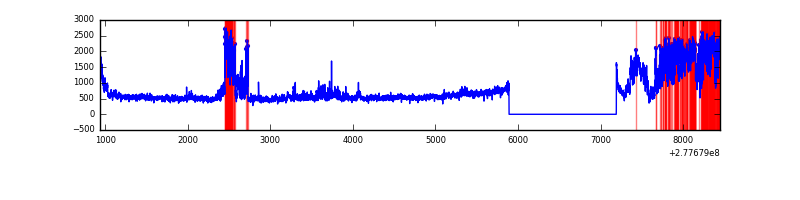 |
| D | 7512 | 6213 | 70 | 70 | 0.93% | 1.13% | 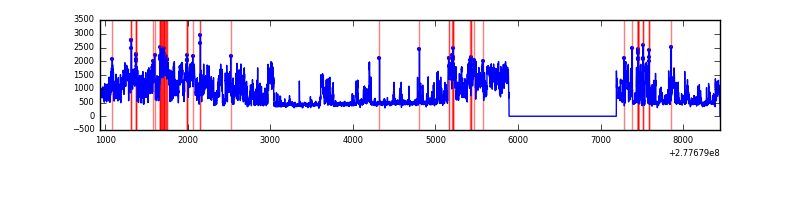 |
Top three noisy pixels from each quadrant. If the there are fewer than three noisy pixels in the level2.evt file, extra rows are filled as -1
| Pixel properties | Quadrant properties | ||||||
|---|---|---|---|---|---|---|---|
| Quadrant | DetID | PixID | Counts | Sigma | Mean | Median | Sigma |
| A | 3 | 1 | 11026 | 65.1 | 782 | 766 | 157.6 |
| A | 15 | 174 | 8529 | 49.26 | 782 | 766 | 157.6 |
| A | 0 | 226 | 6785 | 38.19 | 782 | 766 | 157.6 |
| B | 15 | 35 | 160694 | 1074.74 | 792 | 772 | 148.8 |
| B | 0 | 229 | 84382 | 561.89 | 792 | 772 | 148.8 |
| B | 7 | 220 | 56660 | 375.59 | 792 | 772 | 148.8 |
| C | 3 | 233 | 1854131 | 10666.7 | 747 | 754 | 173.8 |
| C | 14 | 238 | 115871 | 662.53 | 747 | 754 | 173.8 |
| C | 7 | 247 | 9175 | 48.47 | 747 | 754 | 173.8 |
| D | 1 | 52 | 2535714 | 13928.42 | 749 | 726 | 182.0 |
| D | 2 | 33 | 60445 | 328.12 | 749 | 726 | 182.0 |
| D | 10 | 199 | 31815 | 170.82 | 749 | 726 | 182.0 |
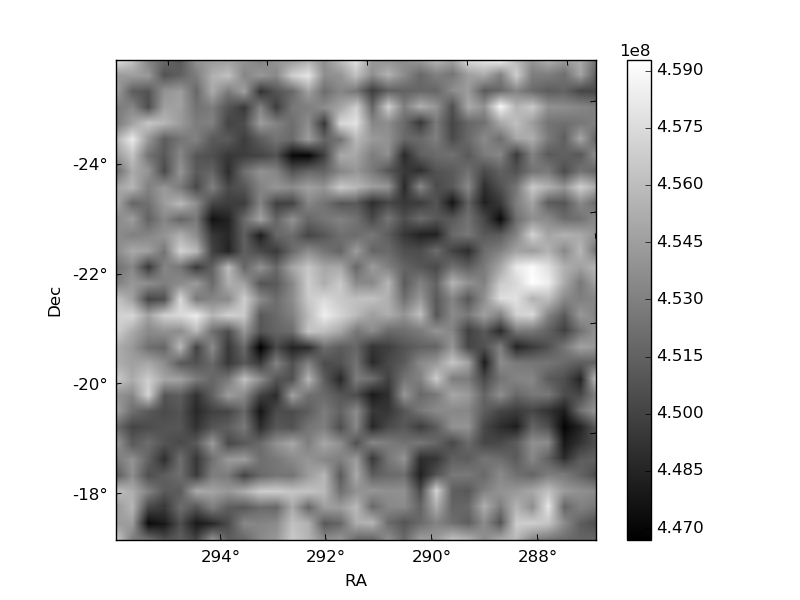
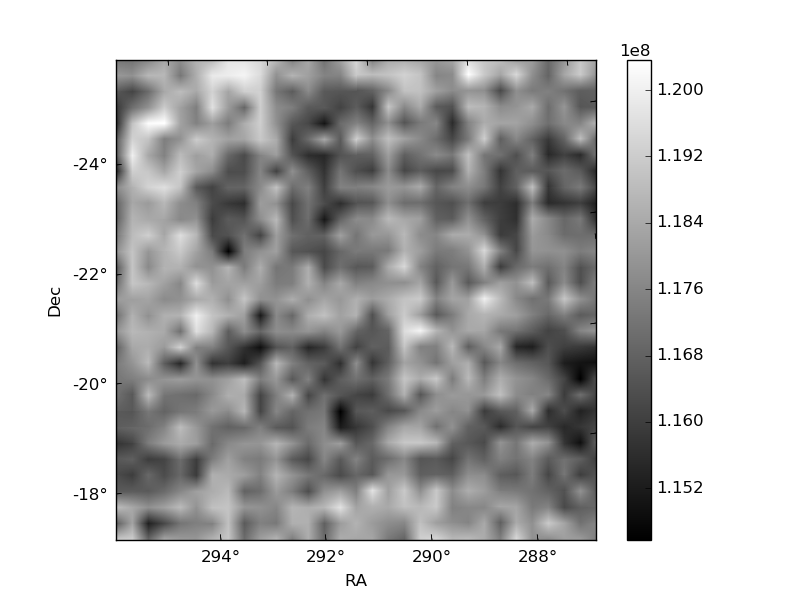
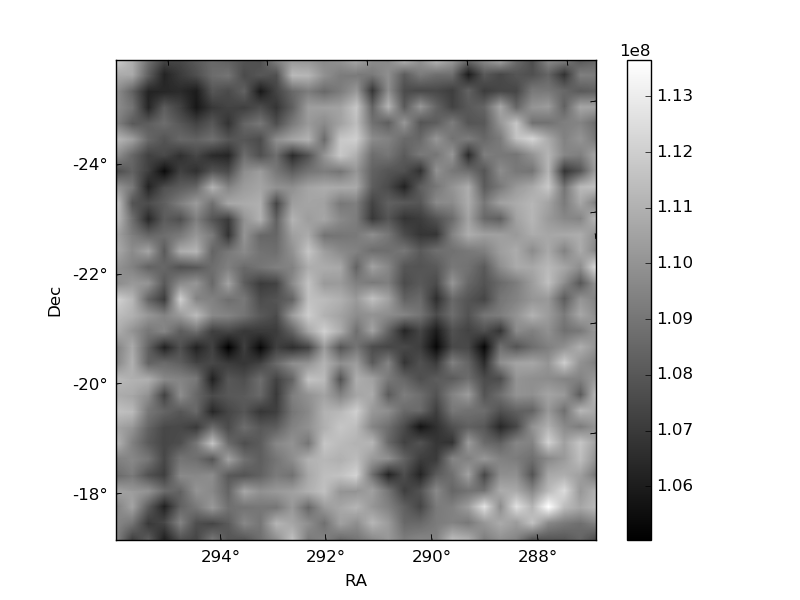
Histogram calculated using DETX and DETY for each event in the final _common_clean file
| Quadrant A | 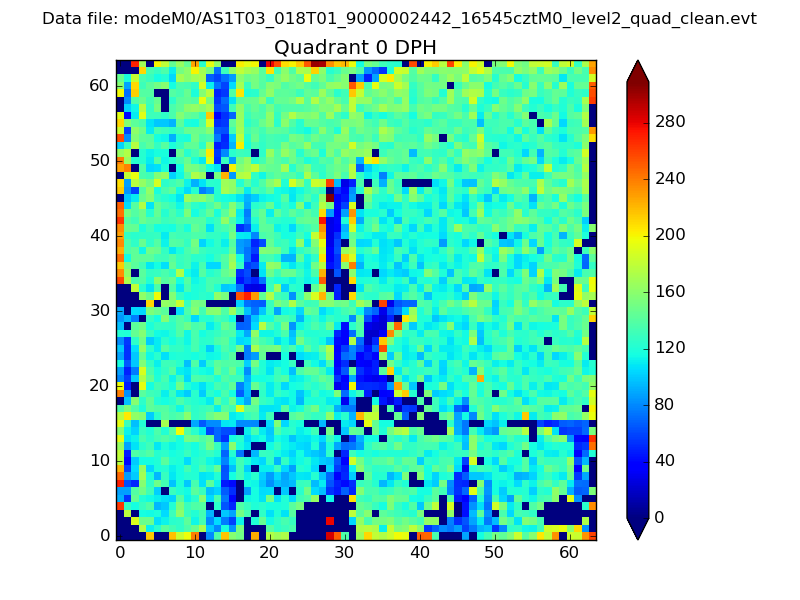 |
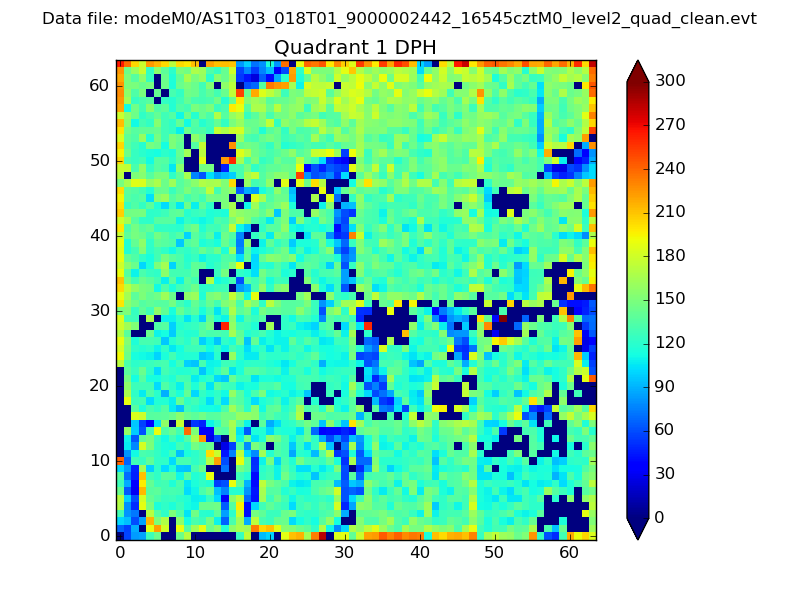 |
Quadrant B |
|---|---|---|---|
| Quadrant D | 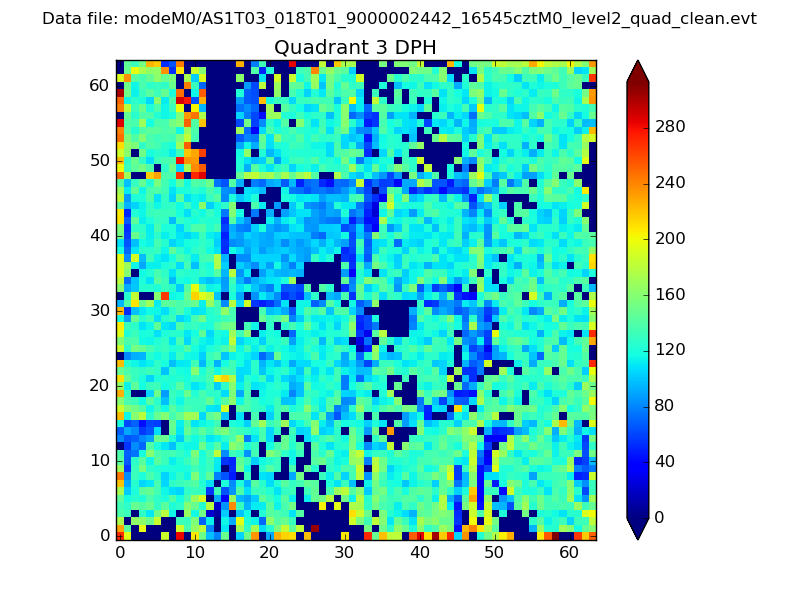 |
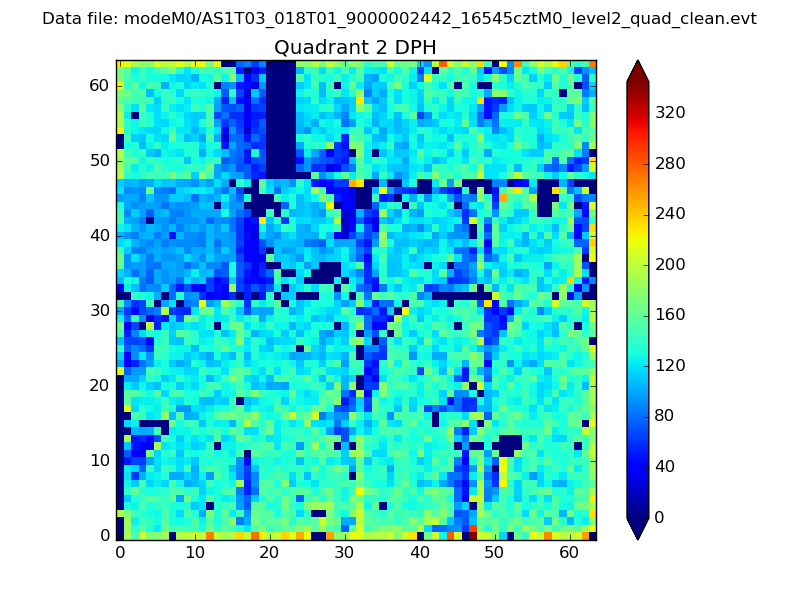 |
Quadrant C |
| Plot type | Count rate plots | Images |
|---|---|---|
| Comparison with Poisson distribution Blue bars denote a histogram of data divided into 1 sec bins. Red curve is a Poisson curve with rate = median count rate of data. |
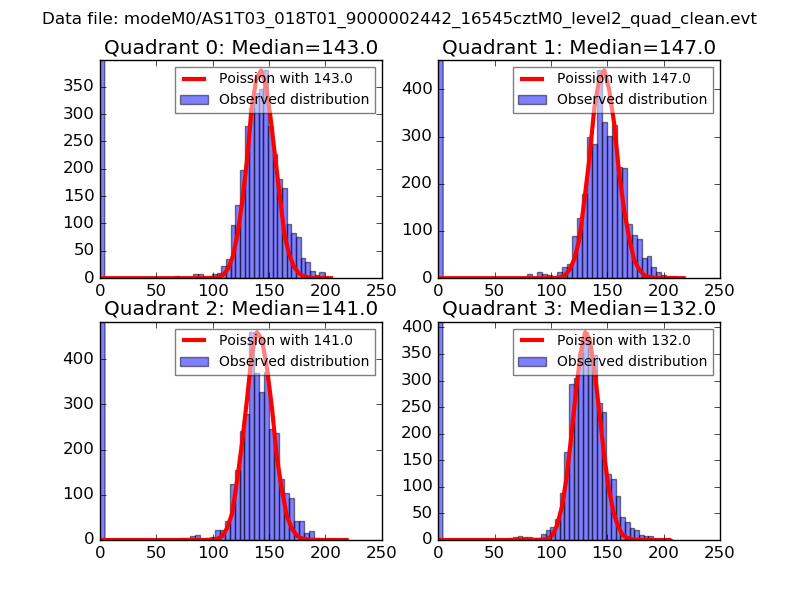 |
 |
| Quadrant-wise count rates Data is divided into 100 sec bins |
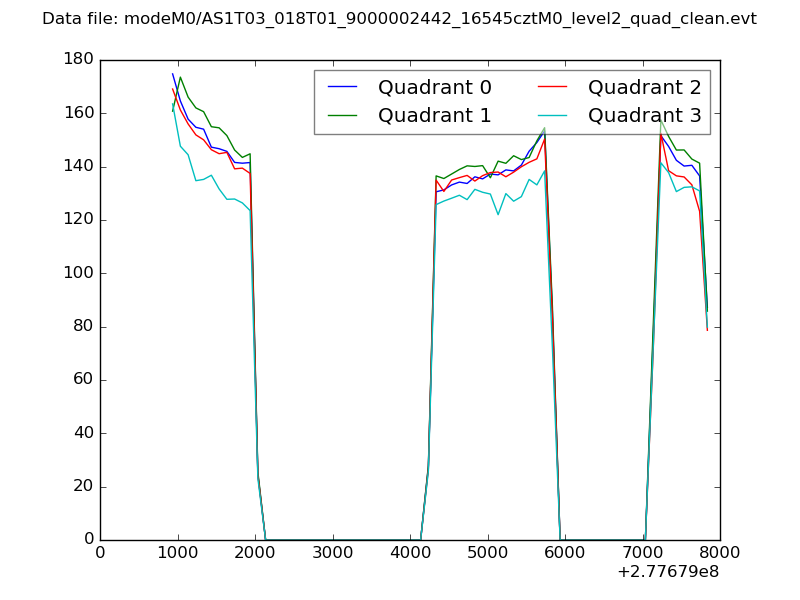 |
|
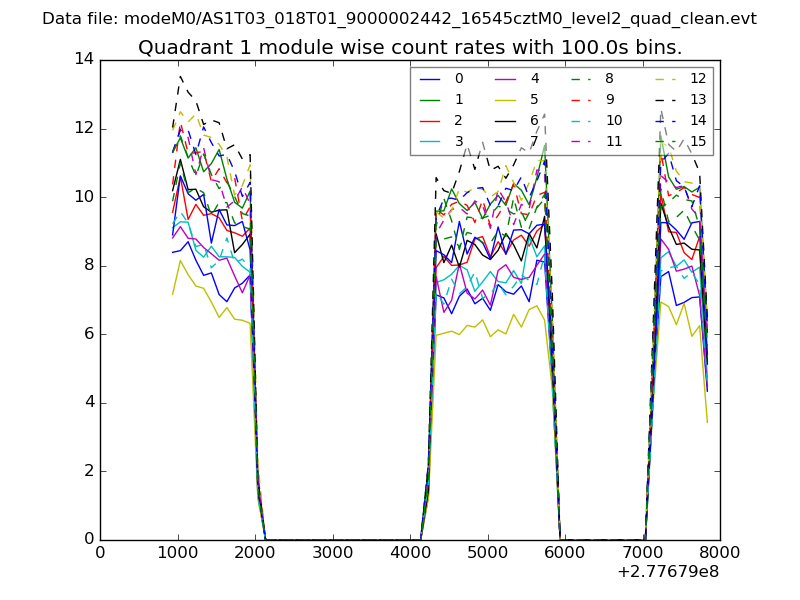
| Module-wise count rates for Quadrant A Data is divided into 100 sec bins |
 |
 |
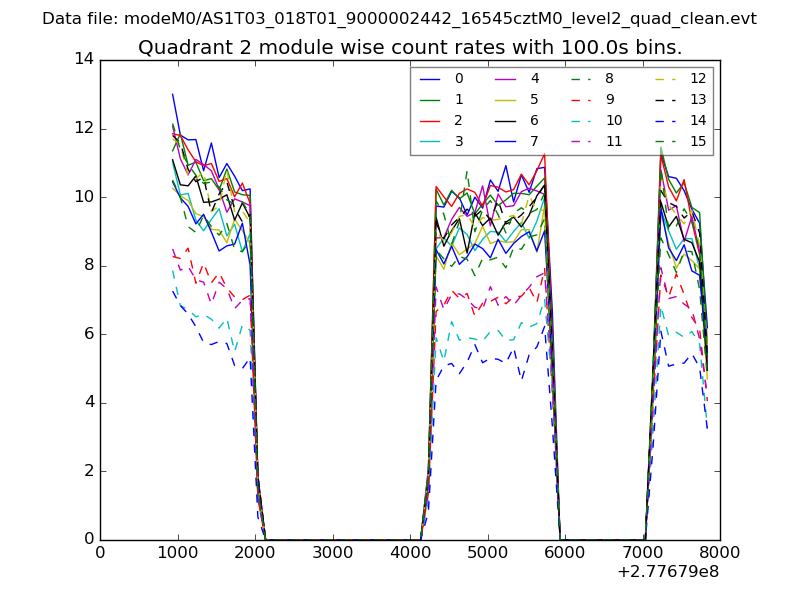
| Module-wise count rates for Quadrant B Data is divided into 100 sec bins |
 |
 |
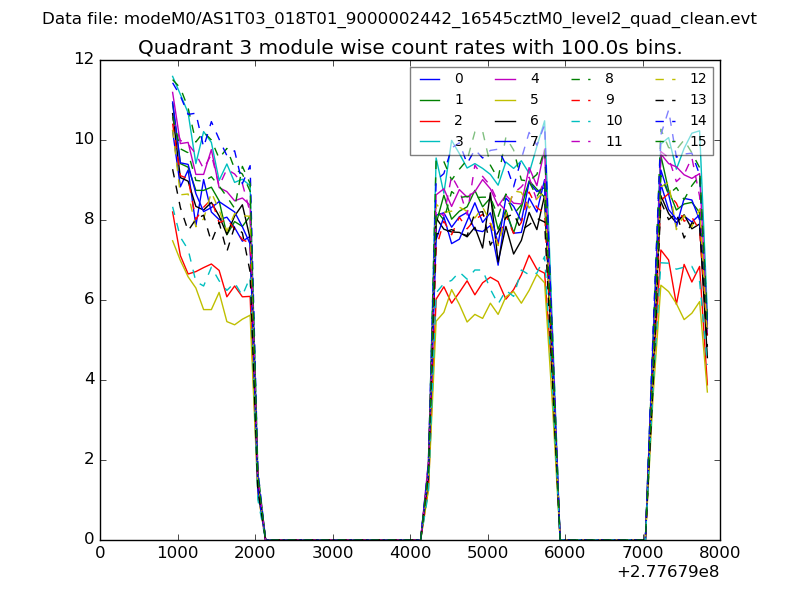
| Module-wise count rates for Quadrant C Data is divided into 100 sec bins |
 |
 |
| Module-wise count rates for Quadrant D Data is divided into 100 sec bins |
 |
 |
| Parameter | Plot |
|---|---|
| CZT HV Monitor | 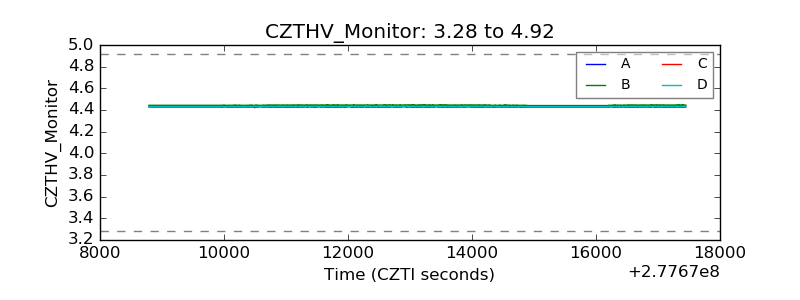 |
| D_VDD | 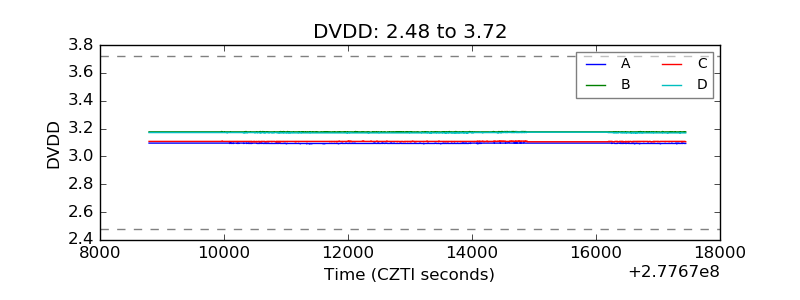 |
| Temperature 1 | 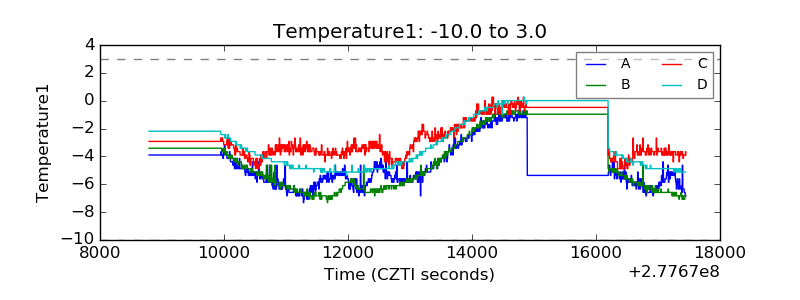 |
| Veto HV Monitor | 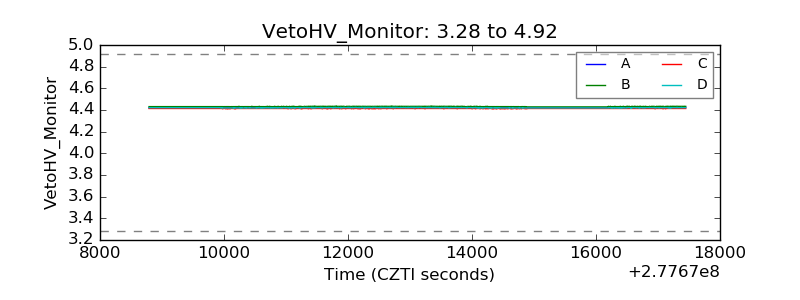 |
| Veto LLD | 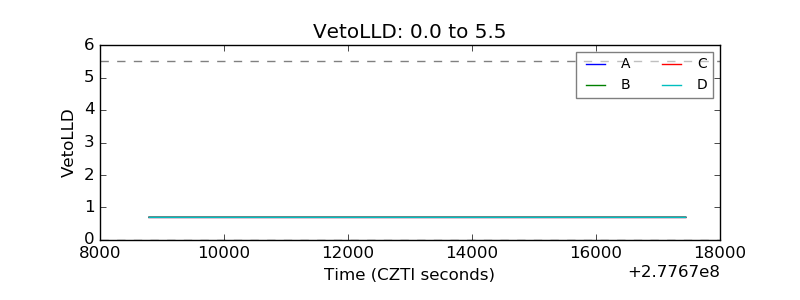 |
| Alpha Counter | 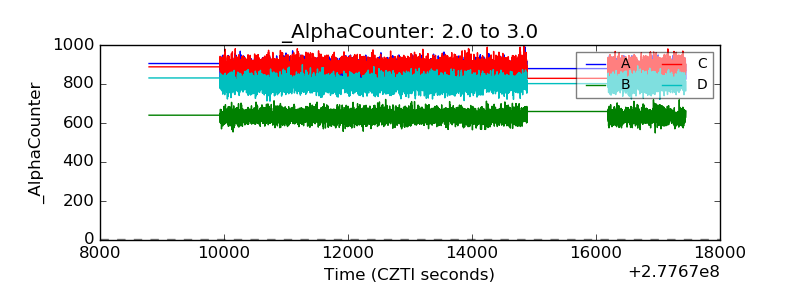 |
| _CPM_Rate | 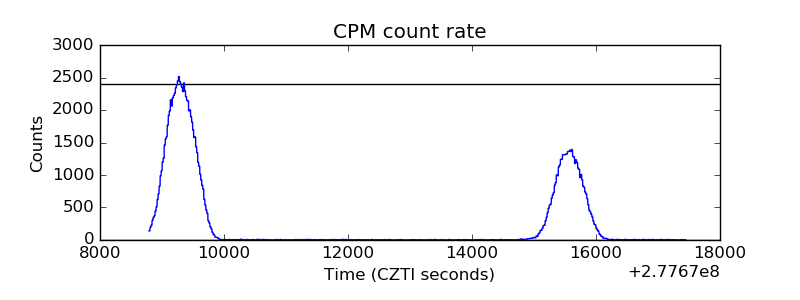 |
| CZT Counter | 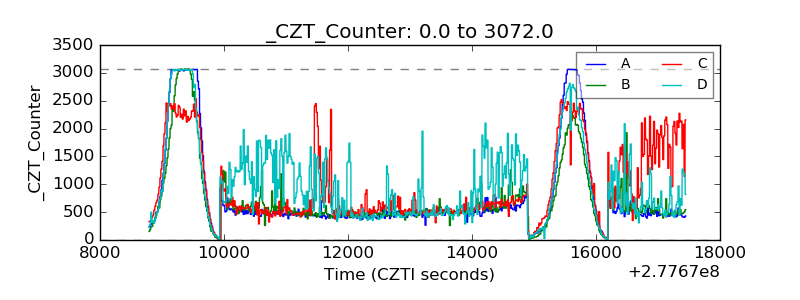 |
| +2.5 Volts monitor | 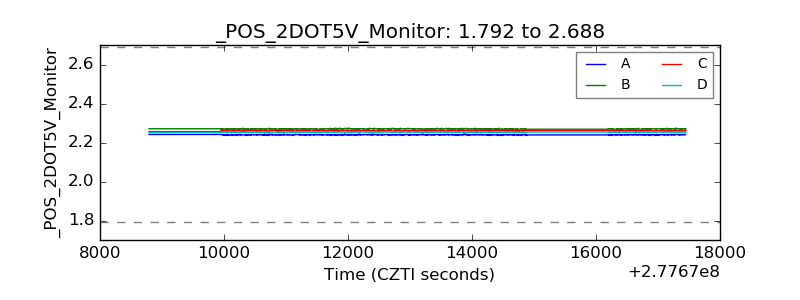 |
| +5 Volts monitor |  |
| _ROLL_ROT | 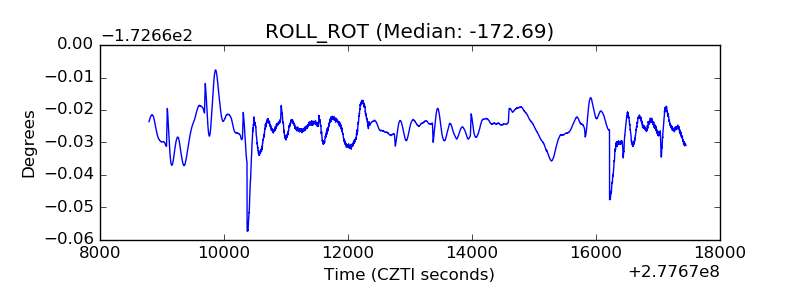 |
| _Roll_DEC | 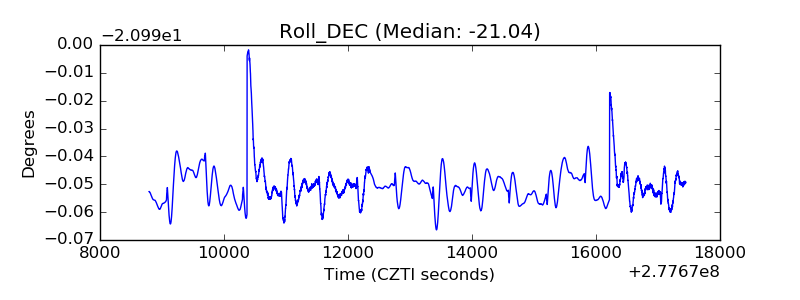 |
| _Roll_RA | 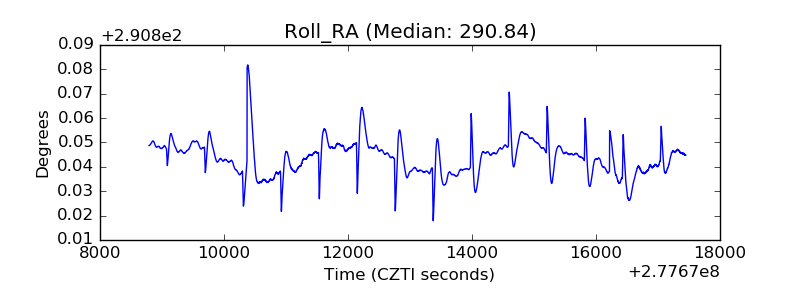 |
| Veto Counter | 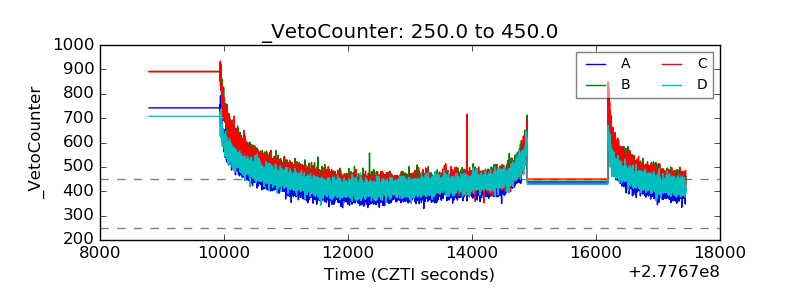 |