| Param | Original file | Final file |
|---|---|---|
| Filename | modeM0/AS1T03_018T01_9000002442_16547cztM0_level2.evt | modeM0/AS1T03_018T01_9000002442_16547cztM0_level2_quad_clean.evt |
| Size (bytes) | 744,500,160 | 66,911,040 |
| Size | 710.0 MB | 63.8 MB |
| Events in quadrant A | 3,512,357 | 419,968 |
| Events in quadrant B | 3,805,021 | 426,957 |
| Events in quadrant C | 11,172,561 | 273,736 |
| Events in quadrant D | 3,574,764 | 407,446 |
| Mode M0 | |||
|---|---|---|---|
| Quadrant | BADHDUFLAG | Total packets | Discarded packets |
| A | 0 | 15108 | 3 |
| B | 0 | 15821 | 2 |
| C | 0 | 38175 | 2 |
| D | 0 | 15626 | 2 |
| Mode M9 | |||
|---|---|---|---|
| Quadrant | BADHDUFLAG | Total packets | Discarded packets |
| A | 0 | 16 | 0 |
| B | 0 | 16 | 0 |
| C | 0 | 16 | 0 |
| D | 0 | 17 | 0 |
| Mode SS | |||
|---|---|---|---|
| Quadrant | BADHDUFLAG | Total packets | Discarded packets |
| A | 0 | 144 | 0 |
| B | 0 | 144 | 0 |
| C | 0 | 144 | 0 |
| D | 0 | 144 | 0 |
| Quadrant | Total seconds | Saturated seconds | Saturation percentage |
|---|---|---|---|
| A | 7133 | 95 | 1.331838% |
| B | 7133 | 126 | 1.766438% |
| C | 7133 | 3166 | 44.385252% |
| D | 7133 | 75 | 1.051451% |
Noise dominated data is calculated using 1-second bins in cleaned event files. If a bin has >2000 counts, and if more than 50% of those come from <1% of pixels, then it is considered to be noise-dominated and hence unusable.
| Quadrant | # 1 sec bins | Bins with >0 counts | Bins with >2000 counts | High rate bins dominated by noise | Noise dominated (total time) | Noise dominated (detector-on time) | Marked lightcurve |
|---|---|---|---|---|---|---|---|
| A | 7813 | 7133 | 10 | 10 | 0.13% | 0.14% | 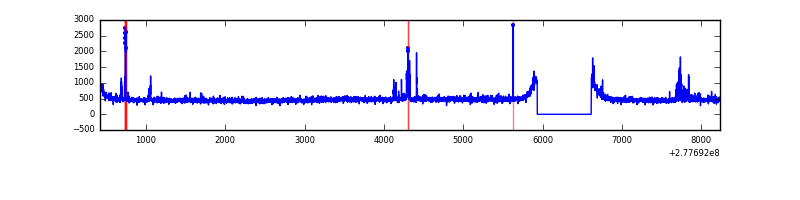 |
| B | 7813 | 7133 | 7 | 7 | 0.09% | 0.10% | 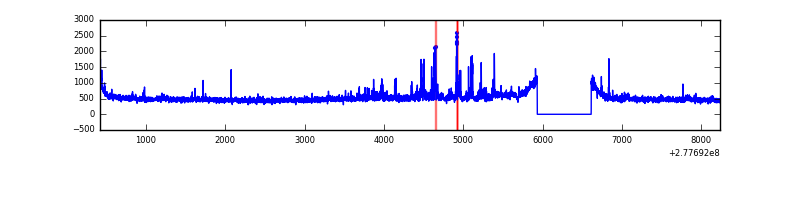 |
| C | 7813 | 7133 | 2572 | 2572 | 32.92% | 36.06% | 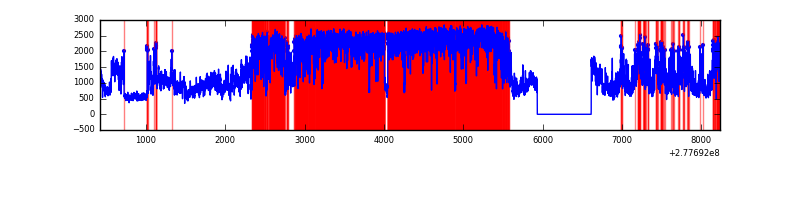 |
| D | 7813 | 7133 | 28 | 28 | 0.36% | 0.39% | 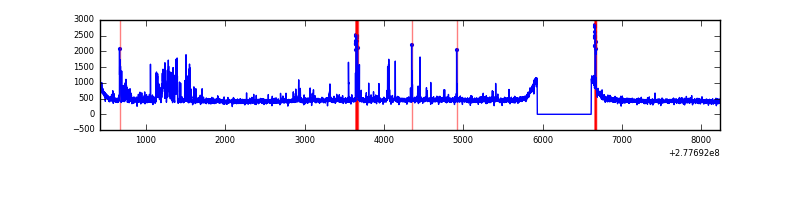 |
Top three noisy pixels from each quadrant. If the there are fewer than three noisy pixels in the level2.evt file, extra rows are filled as -1
| Pixel properties | Quadrant properties | ||||||
|---|---|---|---|---|---|---|---|
| Quadrant | DetID | PixID | Counts | Sigma | Mean | Median | Sigma |
| A | 15 | 174 | 151301 | 854.4 | 869 | 849 | 176.1 |
| A | 15 | 223 | 9465 | 48.93 | 869 | 849 | 176.1 |
| A | 0 | 226 | 7707 | 38.95 | 869 | 849 | 176.1 |
| B | 15 | 35 | 139920 | 824.36 | 876 | 852 | 168.7 |
| B | 3 | 209 | 73016 | 427.77 | 876 | 852 | 168.7 |
| B | 0 | 229 | 60131 | 351.39 | 876 | 852 | 168.7 |
| C | 3 | 233 | 8302465 | 49553.02 | 707 | 712 | 167.5 |
| C | 14 | 238 | 107551 | 637.72 | 707 | 712 | 167.5 |
| C | 13 | 61 | 5060 | 25.95 | 707 | 712 | 167.5 |
| D | 1 | 52 | 269213 | 1294.04 | 845 | 820 | 207.4 |
| D | 10 | 70 | 92569 | 442.36 | 845 | 820 | 207.4 |
| D | 2 | 234 | 30038 | 140.87 | 845 | 820 | 207.4 |
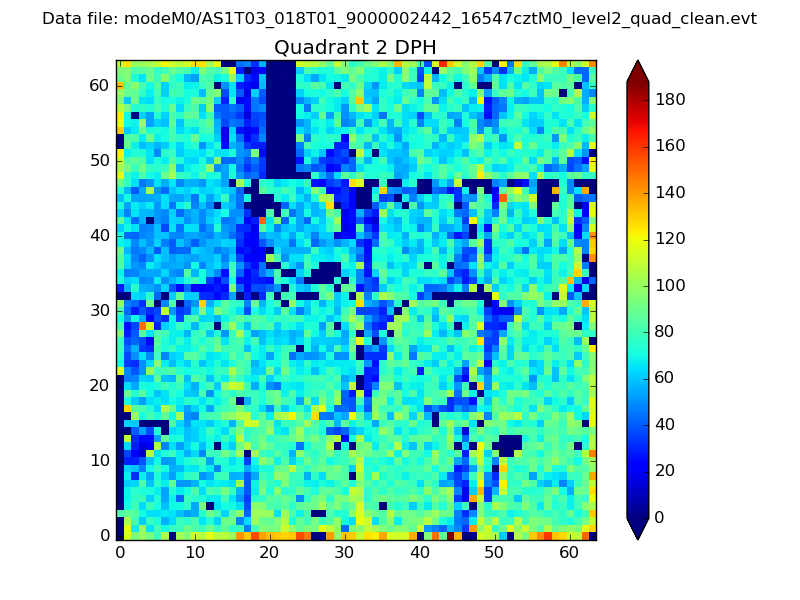
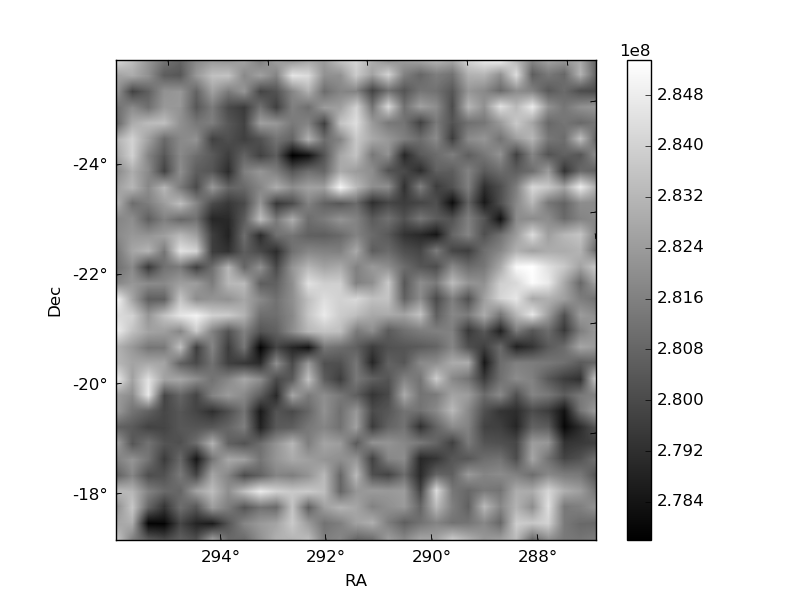
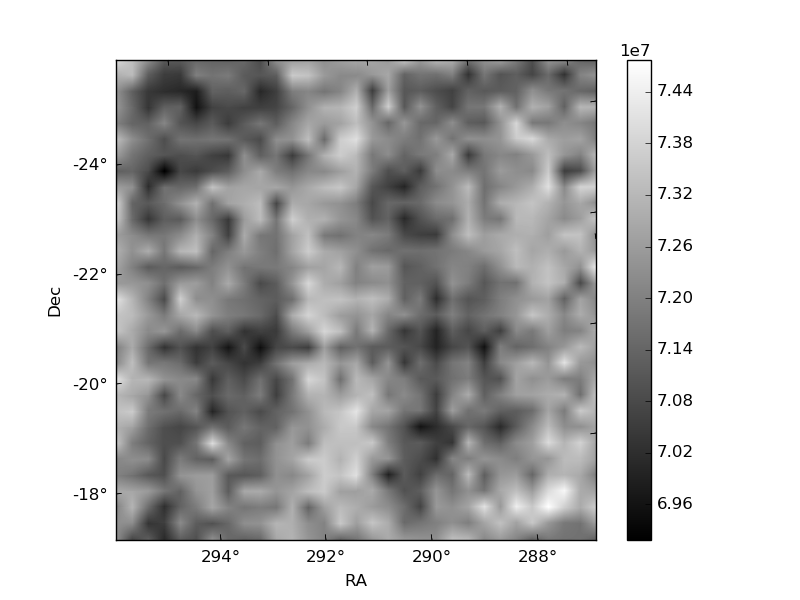
Histogram calculated using DETX and DETY for each event in the final _common_clean file
| Quadrant A | 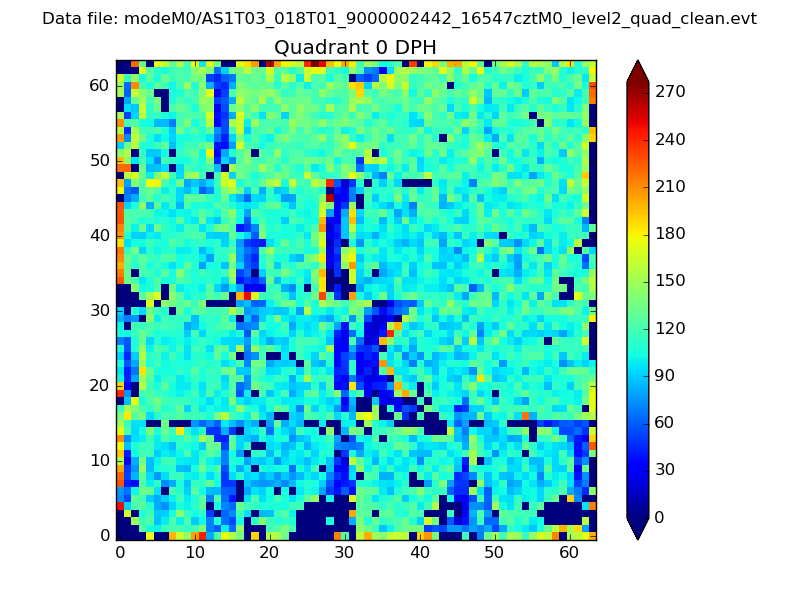 |
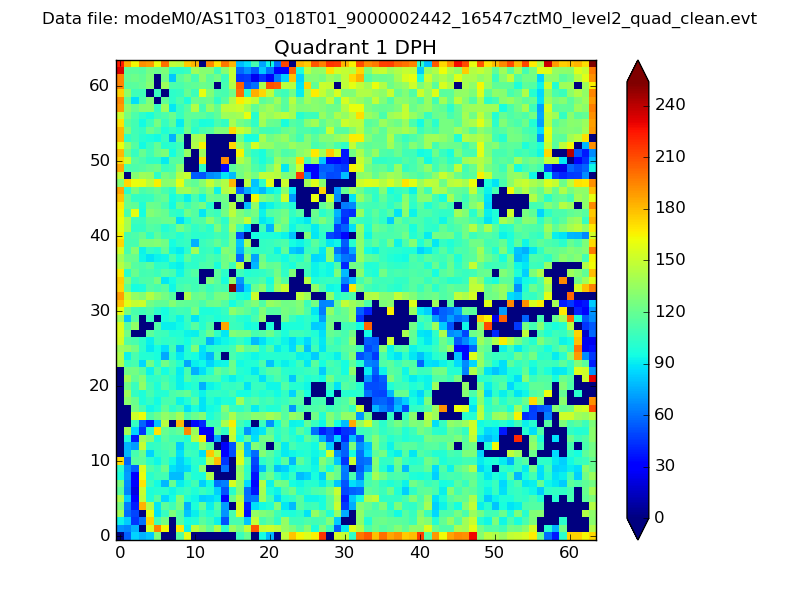 |
Quadrant B |
|---|---|---|---|
| Quadrant D | 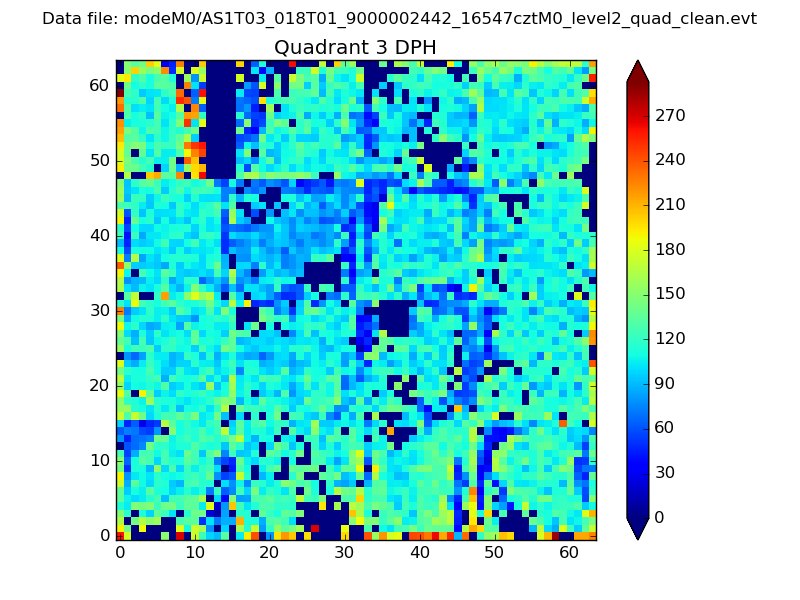 |
 |
Quadrant C |
| Plot type | Count rate plots | Images |
|---|---|---|
| Comparison with Poisson distribution Blue bars denote a histogram of data divided into 1 sec bins. Red curve is a Poisson curve with rate = median count rate of data. |
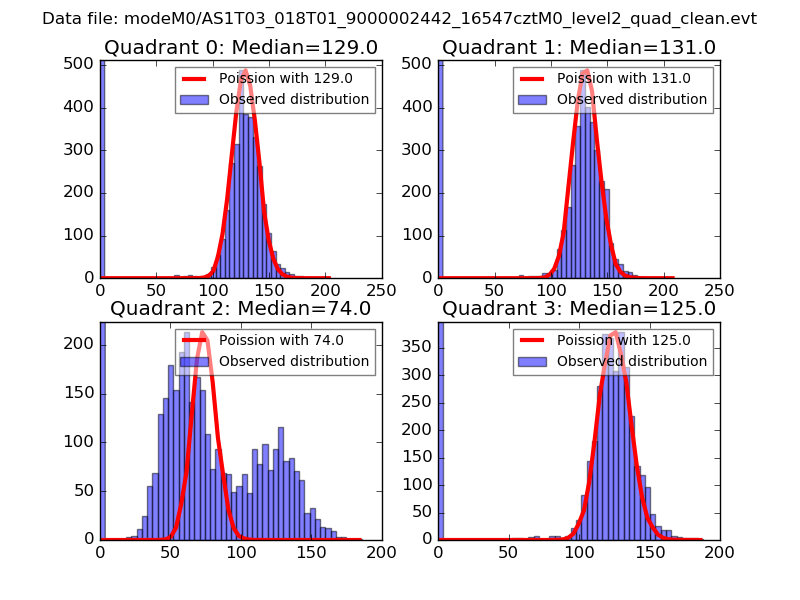 |
 |
| Quadrant-wise count rates Data is divided into 100 sec bins |
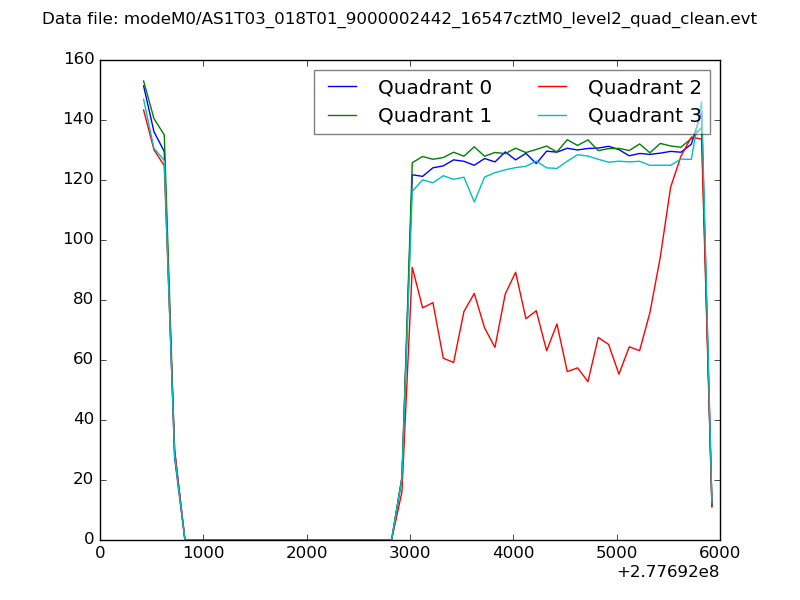 |
|
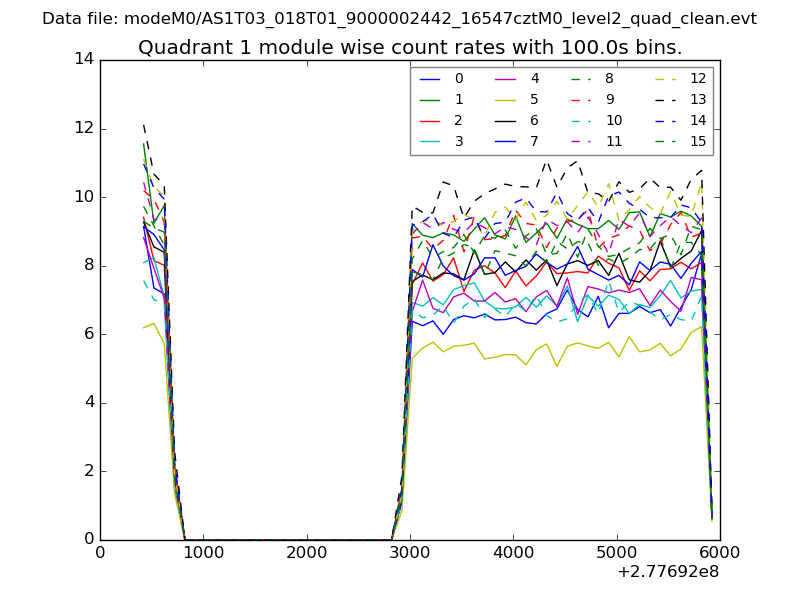
| Module-wise count rates for Quadrant A Data is divided into 100 sec bins |
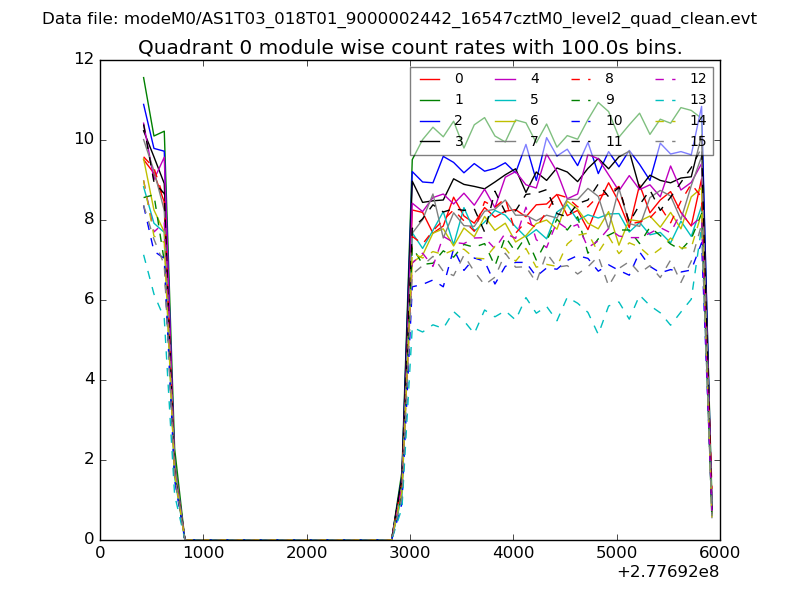 |
 |
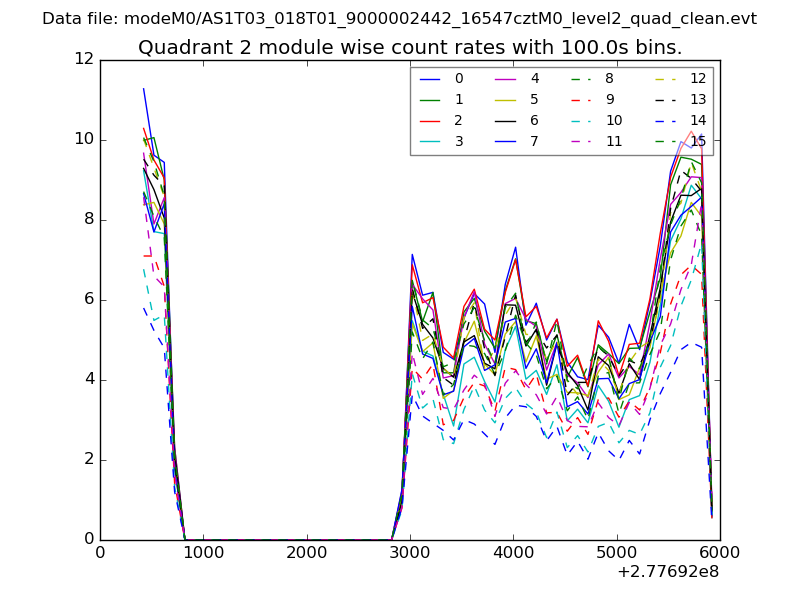
| Module-wise count rates for Quadrant B Data is divided into 100 sec bins |
 |
 |
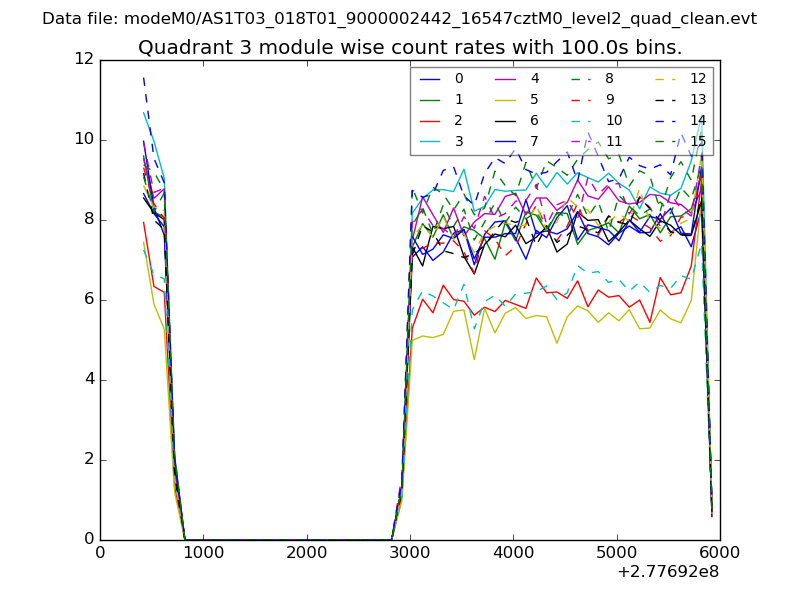
| Module-wise count rates for Quadrant C Data is divided into 100 sec bins |
 |
 |
| Module-wise count rates for Quadrant D Data is divided into 100 sec bins |
 |
 |
| Parameter | Plot |
|---|---|
| CZT HV Monitor | 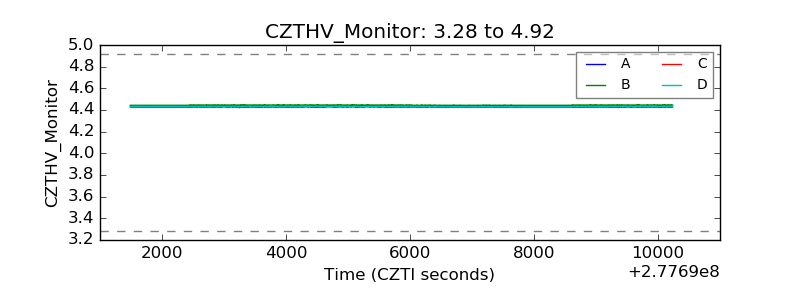 |
| D_VDD | 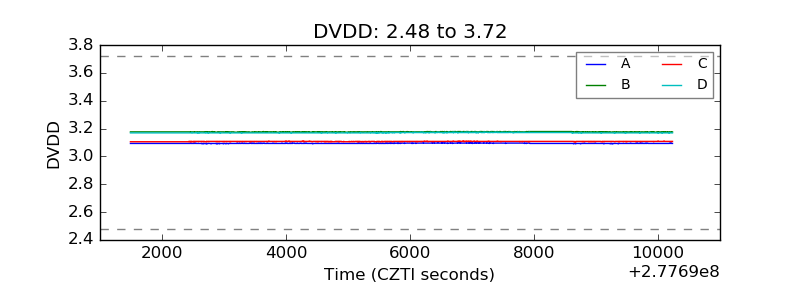 |
| Temperature 1 | 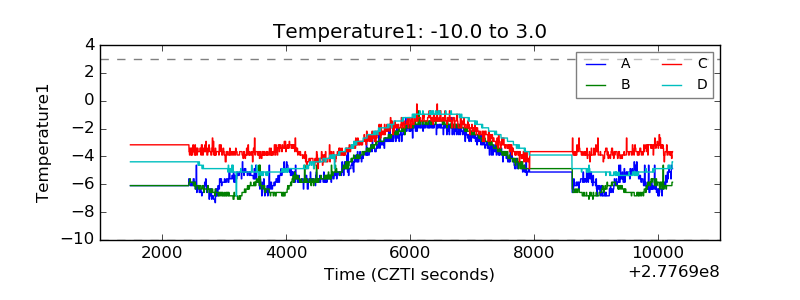 |
| Veto HV Monitor | 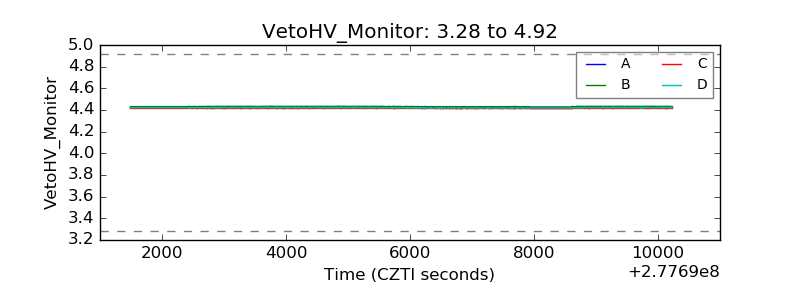 |
| Veto LLD | 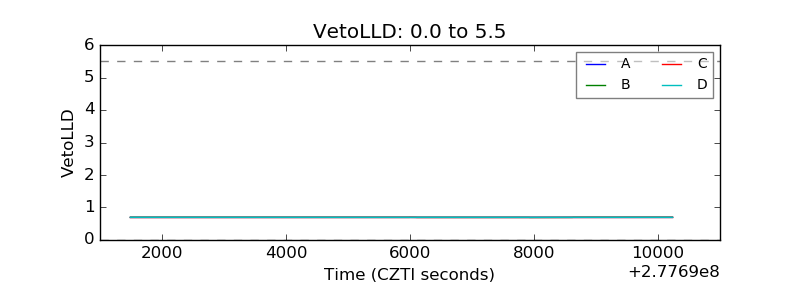 |
| Alpha Counter | 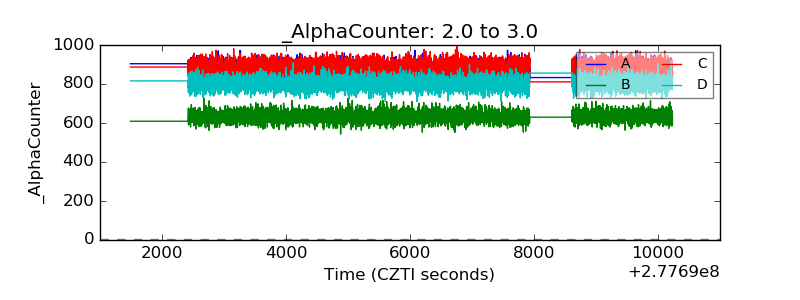 |
| _CPM_Rate | 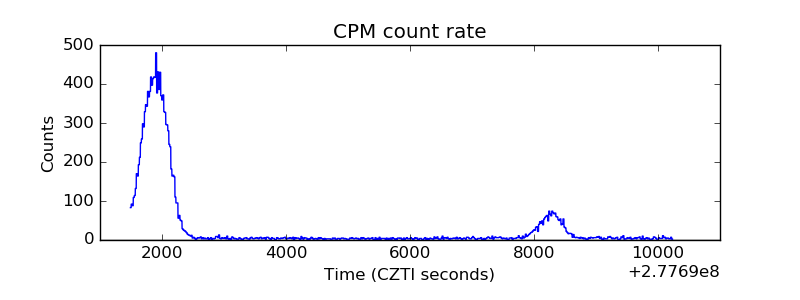 |
| CZT Counter | 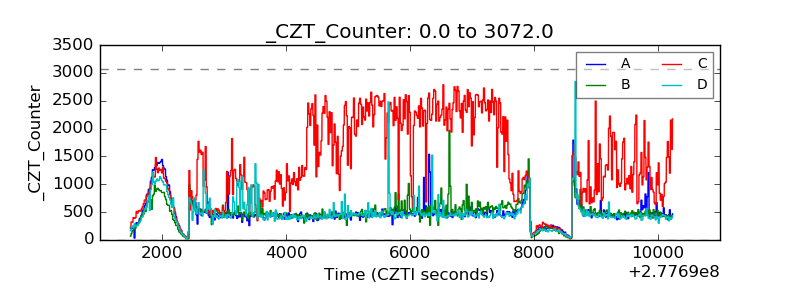 |
| +2.5 Volts monitor |  |
| +5 Volts monitor |  |
| _ROLL_ROT | 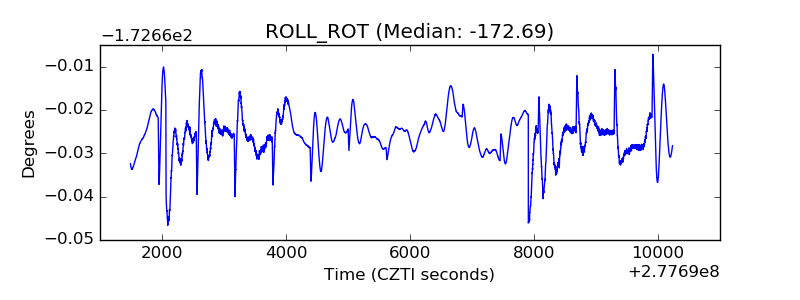 |
| _Roll_DEC | 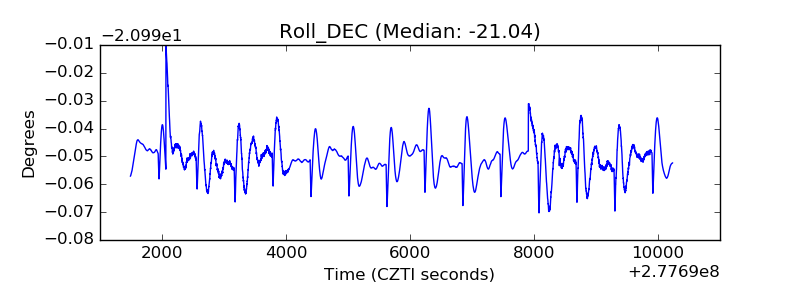 |
| _Roll_RA | 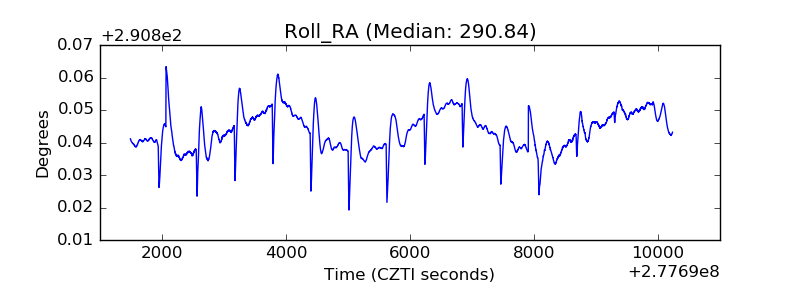 |
| Veto Counter | 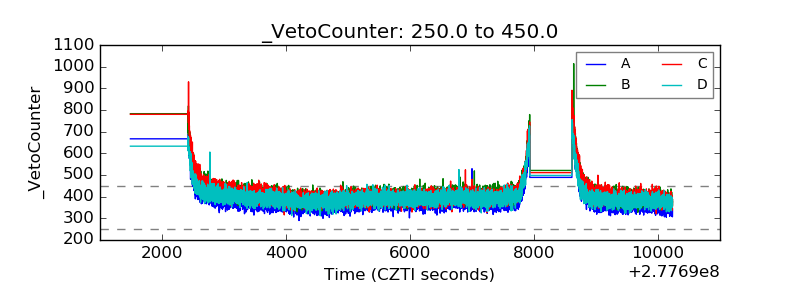 |