| Param | Original file | Final file |
|---|---|---|
| Filename | modeM0/AS1T03_018T01_9000002442_16550cztM0_level2.evt | modeM0/AS1T03_018T01_9000002442_16550cztM0_level2_quad_clean.evt |
| Size (bytes) | 629,789,760 | 85,924,800 |
| Size | 600.6 MB | 81.9 MB |
| Events in quadrant A | 3,920,201 | 515,864 |
| Events in quadrant B | 4,302,387 | 527,325 |
| Events in quadrant C | 6,430,876 | 504,082 |
| Events in quadrant D | 3,881,790 | 502,807 |
| Mode M0 | |||
|---|---|---|---|
| Quadrant | BADHDUFLAG | Total packets | Discarded packets |
| A | 0 | 16721 | 3 |
| B | 0 | 17562 | 2 |
| C | 0 | 24607 | 2 |
| D | 0 | 17021 | 2 |
| Mode M9 | |||
|---|---|---|---|
| Quadrant | BADHDUFLAG | Total packets | Discarded packets |
| A | 0 | 7 | 0 |
| B | 0 | 7 | 0 |
| C | 0 | 7 | 0 |
| D | 0 | 7 | 0 |
| Mode SS | |||
|---|---|---|---|
| Quadrant | BADHDUFLAG | Total packets | Discarded packets |
| A | 0 | 164 | 0 |
| B | 0 | 164 | 0 |
| C | 0 | 164 | 0 |
| D | 0 | 164 | 0 |
| Quadrant | Total seconds | Saturated seconds | Saturation percentage |
|---|---|---|---|
| A | 7940 | 254 | 3.198992% |
| B | 7940 | 300 | 3.778338% |
| C | 7940 | 656 | 8.261965% |
| D | 7940 | 257 | 3.236776% |
Noise dominated data is calculated using 1-second bins in cleaned event files. If a bin has >2000 counts, and if more than 50% of those come from <1% of pixels, then it is considered to be noise-dominated and hence unusable.
| Quadrant | # 1 sec bins | Bins with >0 counts | Bins with >2000 counts | High rate bins dominated by noise | Noise dominated (total time) | Noise dominated (detector-on time) | Marked lightcurve |
|---|---|---|---|---|---|---|---|
| A | 8571 | 7942 | 2 | 2 | 0.02% | 0.03% | 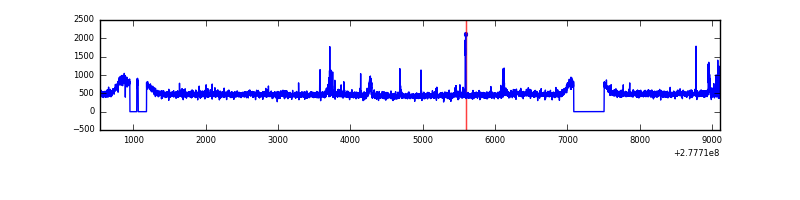 |
| B | 8571 | 7942 | 21 | 21 | 0.25% | 0.26% | 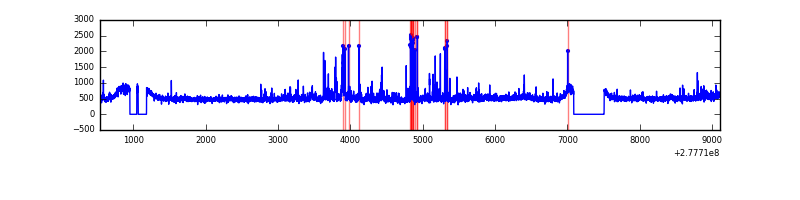 |
| C | 8571 | 7942 | 108 | 108 | 1.26% | 1.36% | 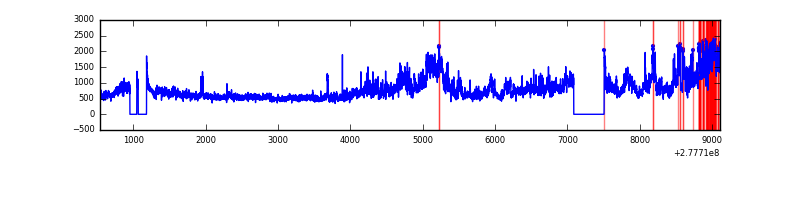 |
| D | 8570 | 7941 | 51 | 51 | 0.60% | 0.64% | 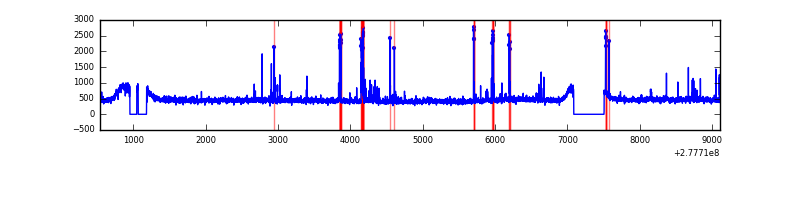 |
Top three noisy pixels from each quadrant. If the there are fewer than three noisy pixels in the level2.evt file, extra rows are filled as -1
| Pixel properties | Quadrant properties | ||||||
|---|---|---|---|---|---|---|---|
| Quadrant | DetID | PixID | Counts | Sigma | Mean | Median | Sigma |
| A | 15 | 174 | 120242 | 602.98 | 974 | 949 | 197.8 |
| A | 15 | 223 | 29975 | 146.72 | 974 | 949 | 197.8 |
| A | 15 | 239 | 15466 | 73.38 | 974 | 949 | 197.8 |
| B | 15 | 35 | 156492 | 816.23 | 978 | 949 | 190.6 |
| B | 3 | 209 | 101363 | 526.93 | 978 | 949 | 190.6 |
| B | 7 | 220 | 73597 | 381.23 | 978 | 949 | 190.6 |
| C | 3 | 233 | 2639488 | 12104.28 | 926 | 931 | 218.0 |
| C | 14 | 238 | 141518 | 644.94 | 926 | 931 | 218.0 |
| C | 7 | 247 | 15097 | 64.99 | 926 | 931 | 218.0 |
| D | 10 | 70 | 102542 | 431.92 | 953 | 922 | 235.3 |
| D | 2 | 33 | 74371 | 312.18 | 953 | 922 | 235.3 |
| D | 2 | 234 | 34166 | 141.3 | 953 | 922 | 235.3 |
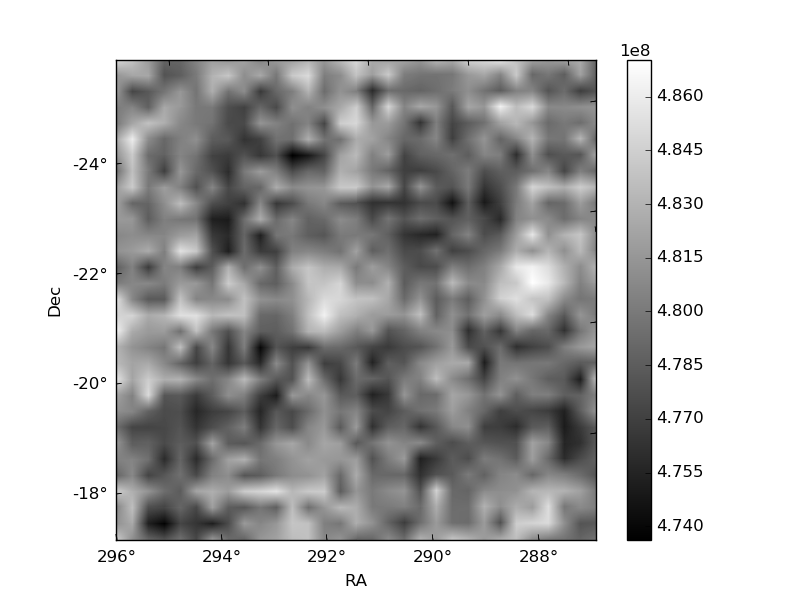
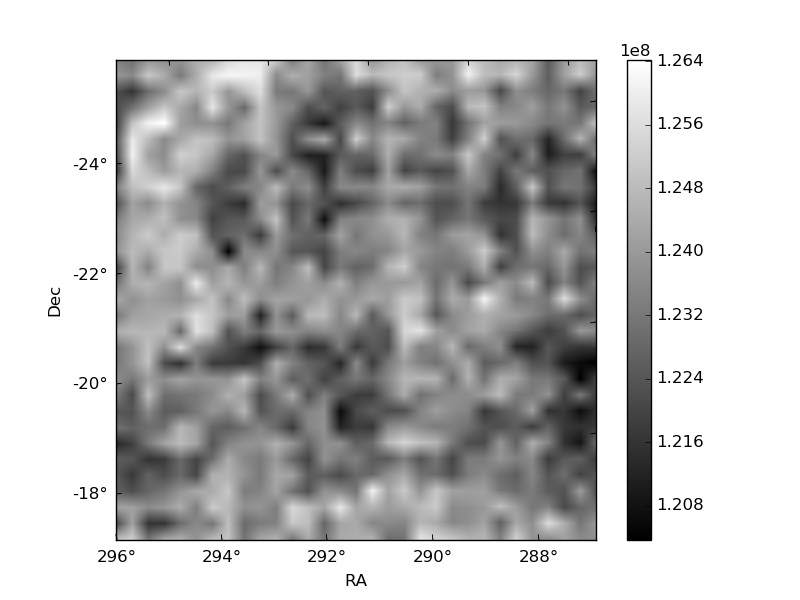
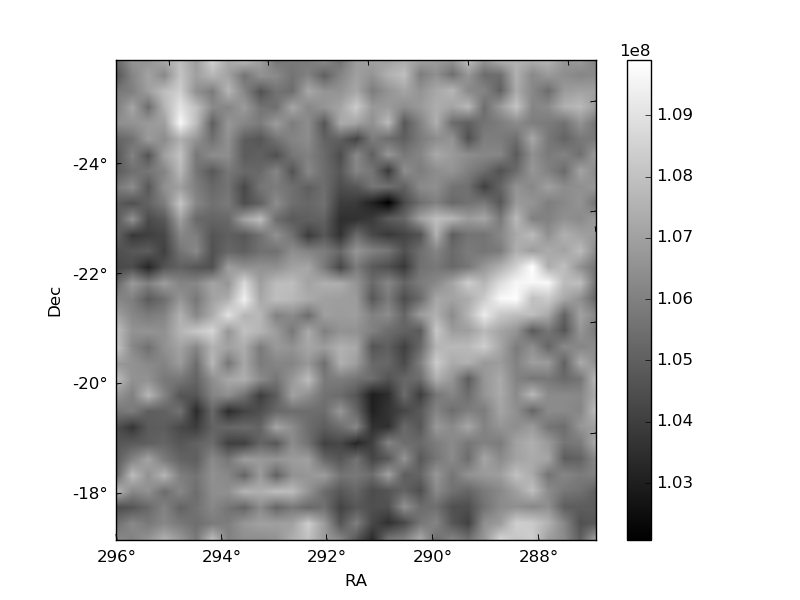
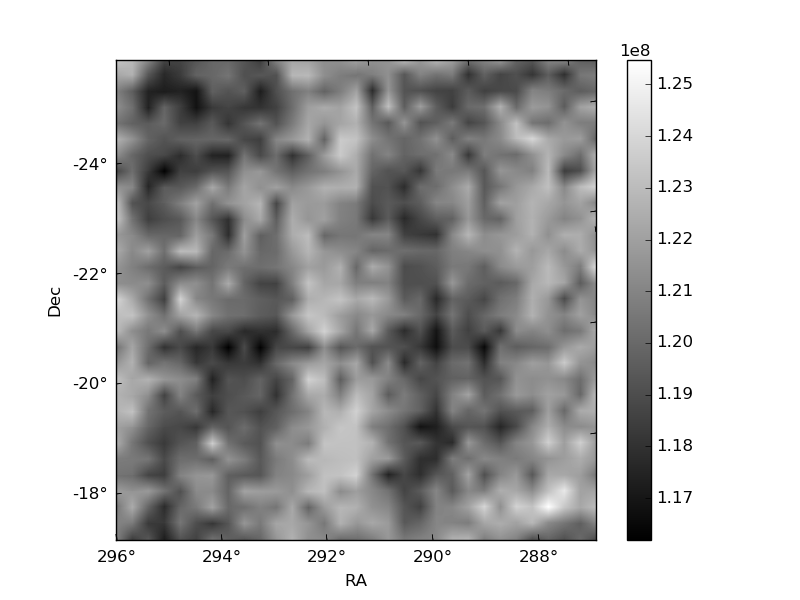
Histogram calculated using DETX and DETY for each event in the final _common_clean file
| Quadrant A | 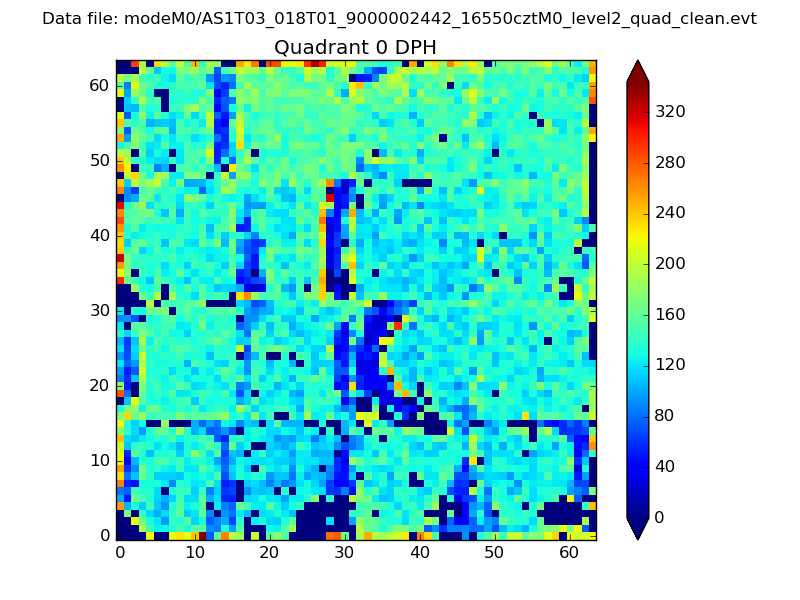 |
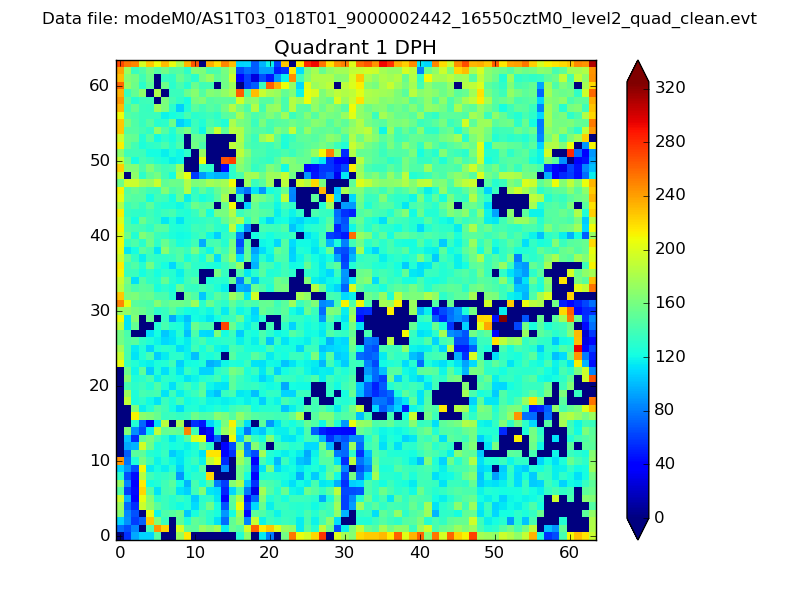 |
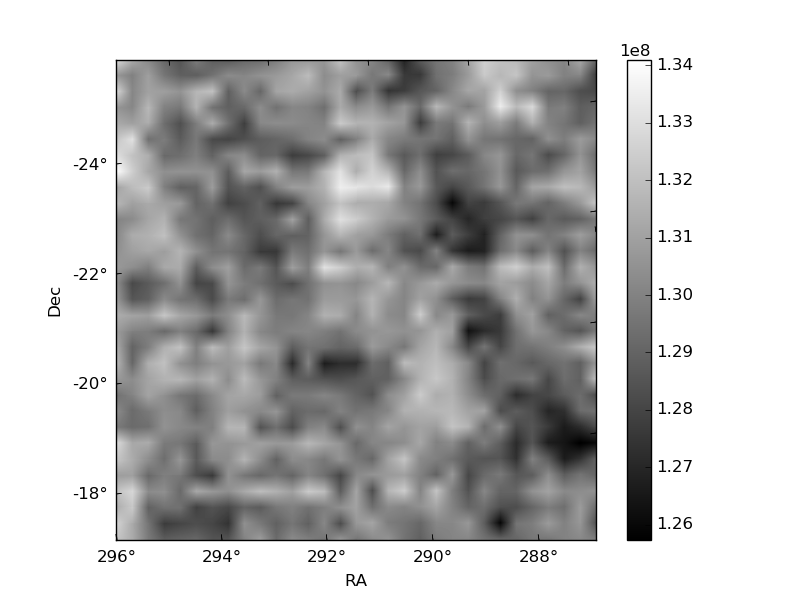
Quadrant B |
|---|---|---|---|
| Quadrant D | 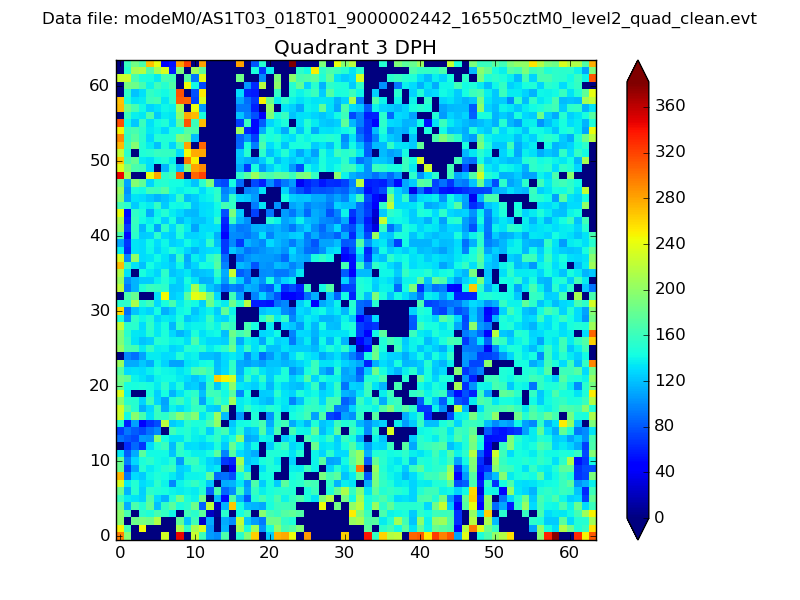 |
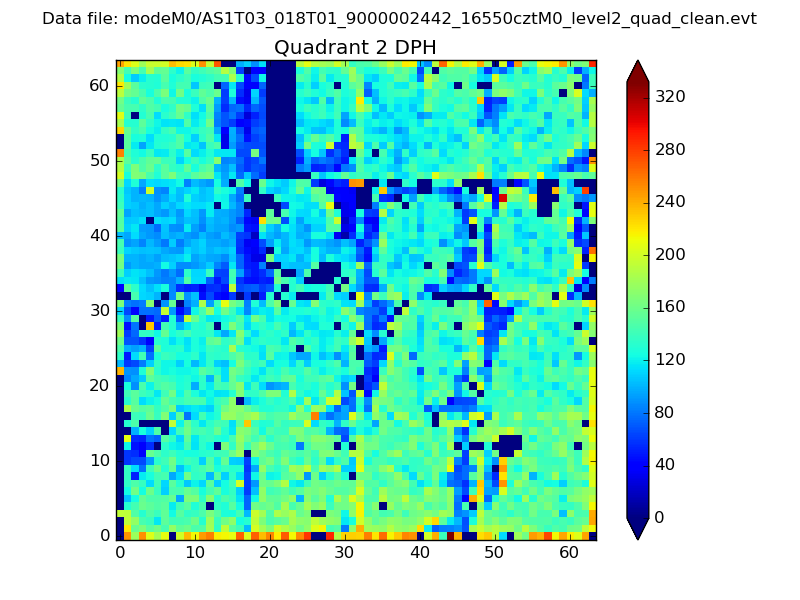 |
Quadrant C |
| Plot type | Count rate plots | Images |
|---|---|---|
| Comparison with Poisson distribution Blue bars denote a histogram of data divided into 1 sec bins. Red curve is a Poisson curve with rate = median count rate of data. |
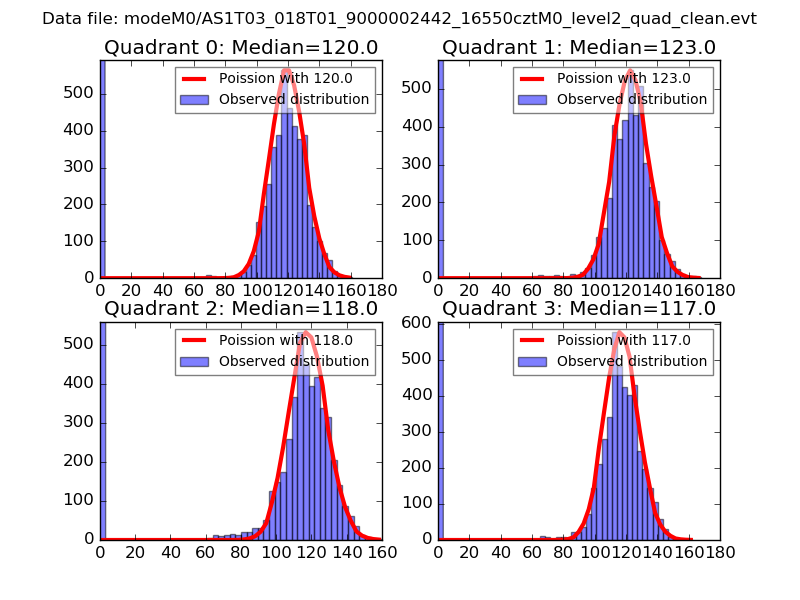 |
 |
| Quadrant-wise count rates Data is divided into 100 sec bins |
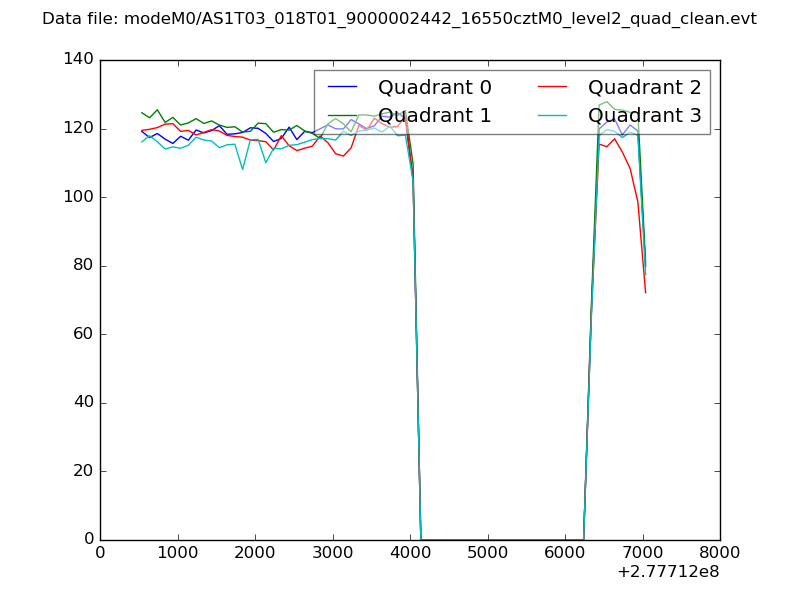 |
|
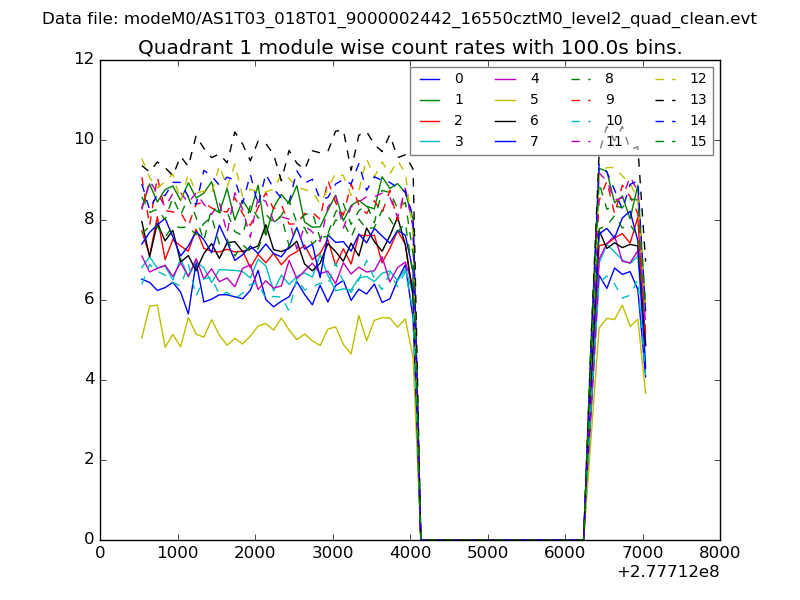
| Module-wise count rates for Quadrant A Data is divided into 100 sec bins |
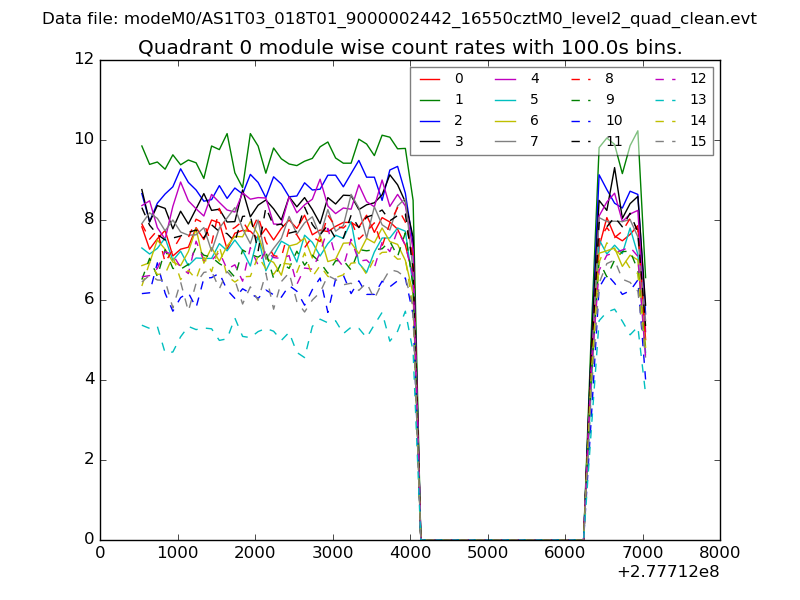 |
 |
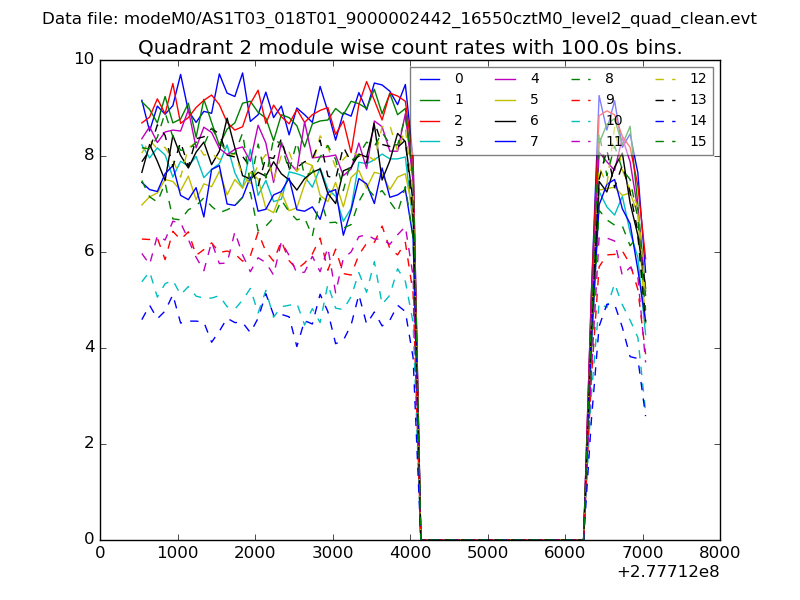
| Module-wise count rates for Quadrant B Data is divided into 100 sec bins |
 |
 |
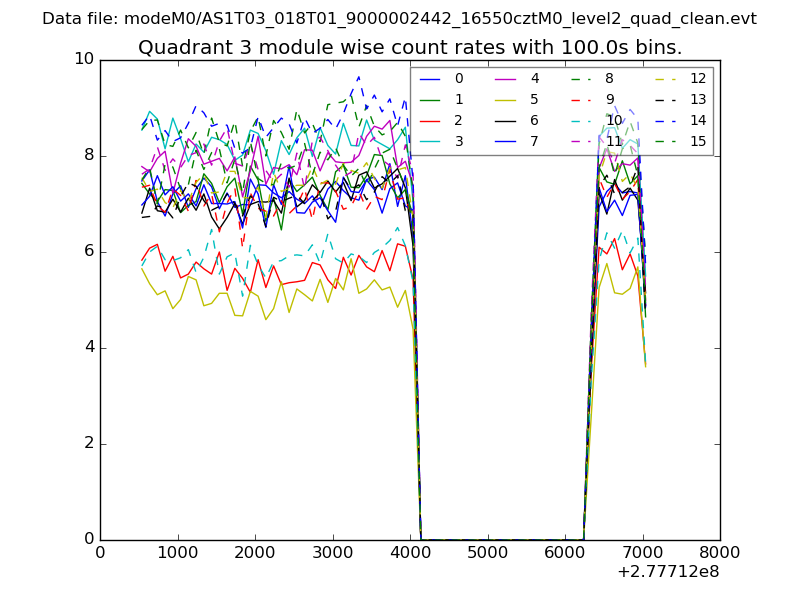
| Module-wise count rates for Quadrant C Data is divided into 100 sec bins |
 |
 |
| Module-wise count rates for Quadrant D Data is divided into 100 sec bins |
 |
 |
| Parameter | Plot |
|---|---|
| CZT HV Monitor | 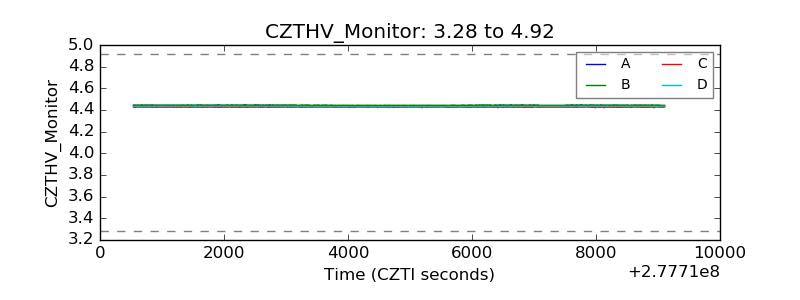 |
| D_VDD | 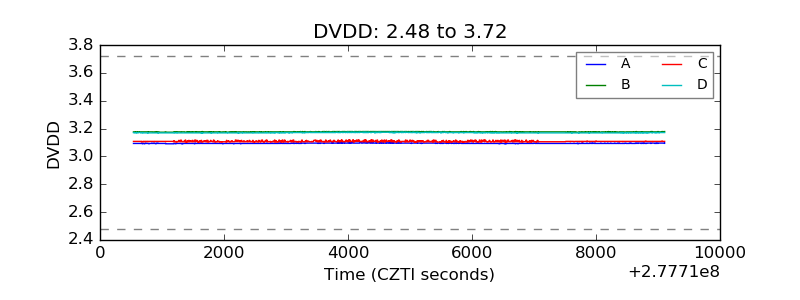 |
| Temperature 1 | 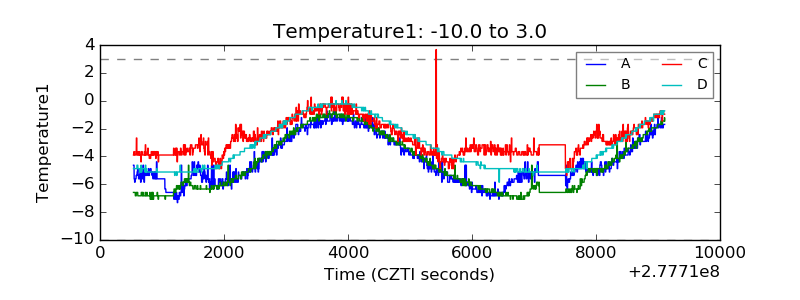 |
| Veto HV Monitor | 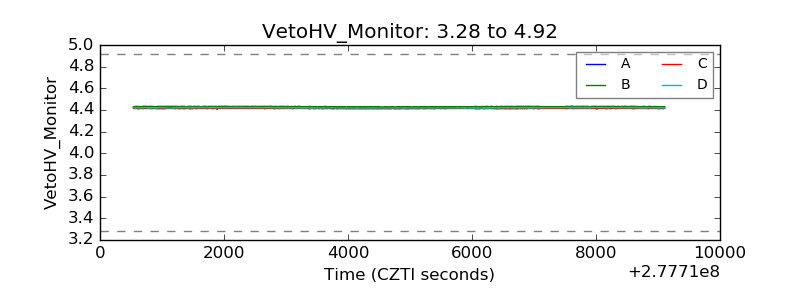 |
| Veto LLD | 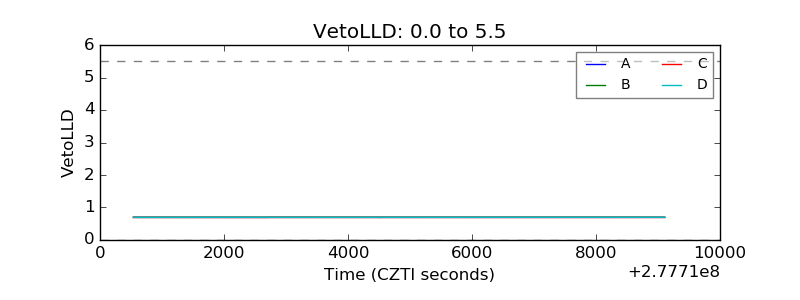 |
| Alpha Counter | 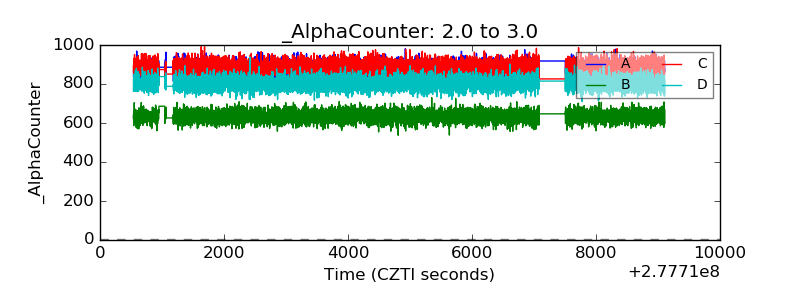 |
| _CPM_Rate | 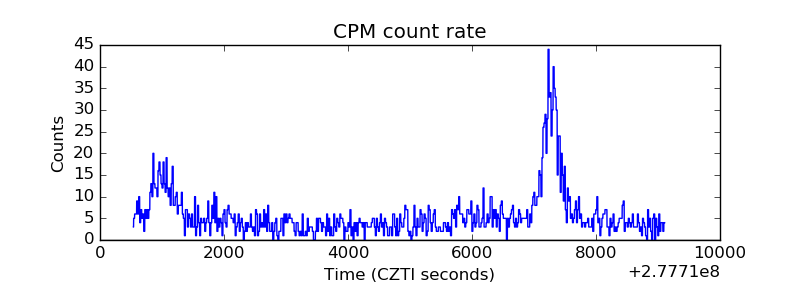 |
| CZT Counter | 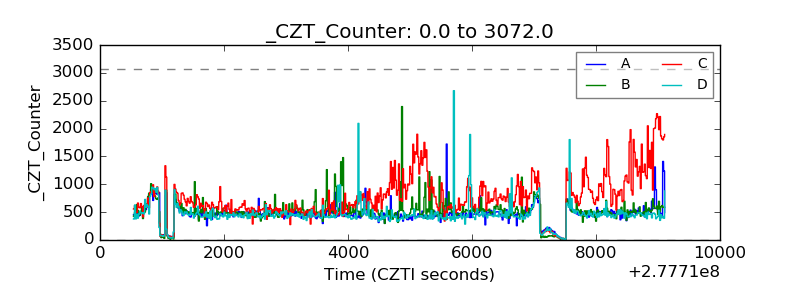 |
| +2.5 Volts monitor | 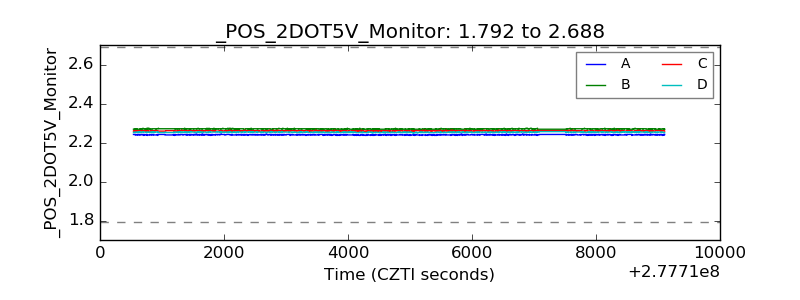 |
| +5 Volts monitor |  |
| _ROLL_ROT | 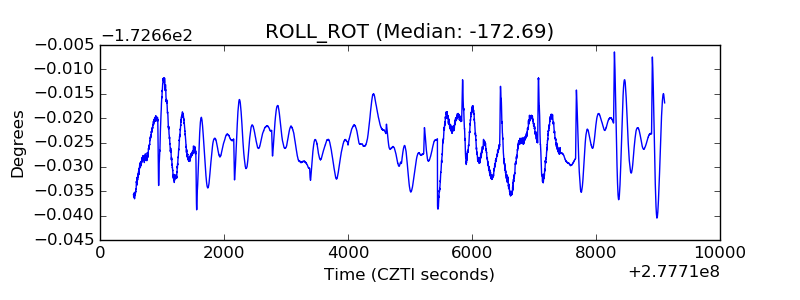 |
| _Roll_DEC | 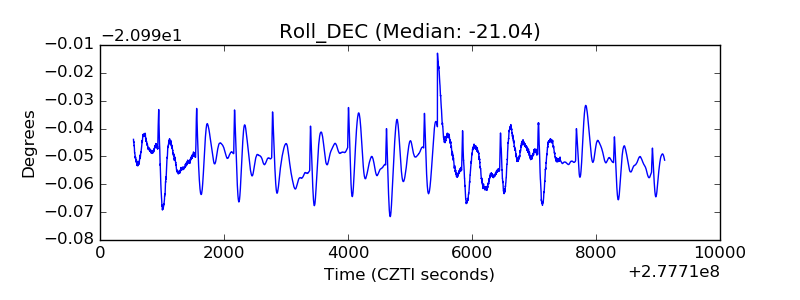 |
| _Roll_RA | 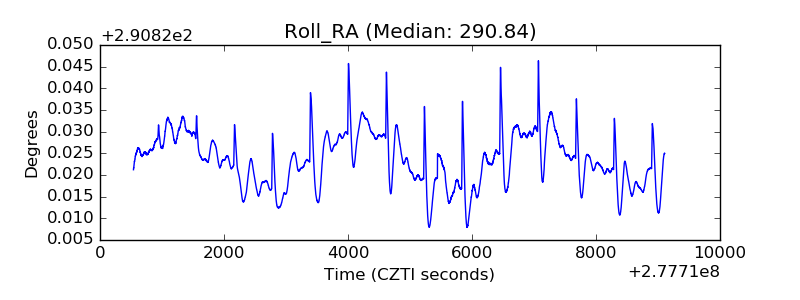 |
| Veto Counter | 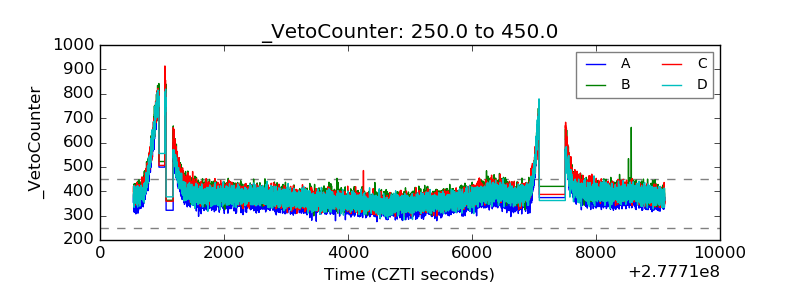 |