| Param | Original file | Final file |
|---|---|---|
| Filename | modeM0/AS1T03_018T01_9000002442_16552cztM0_level2.evt | modeM0/AS1T03_018T01_9000002442_16552cztM0_level2_quad_clean.evt |
| Size (bytes) | 1,001,292,480 | 165,795,840 |
| Size | 954.9 MB | 158.1 MB |
| Events in quadrant A | 6,496,525 | 1,049,216 |
| Events in quadrant B | 6,996,769 | 1,065,829 |
| Events in quadrant C | 8,732,479 | 1,033,935 |
| Events in quadrant D | 7,240,717 | 994,967 |
| Mode M0 | |||
|---|---|---|---|
| Quadrant | BADHDUFLAG | Total packets | Discarded packets |
| A | 0 | 27589 | 3 |
| B | 0 | 28629 | 2 |
| C | 0 | 34175 | 2 |
| D | 0 | 30050 | 2 |
| Mode M9 | |||
|---|---|---|---|
| Quadrant | BADHDUFLAG | Total packets | Discarded packets |
| A | 0 | 14 | 0 |
| B | 0 | 14 | 0 |
| C | 0 | 14 | 0 |
| D | 0 | 14 | 0 |
| Mode SS | |||
|---|---|---|---|
| Quadrant | BADHDUFLAG | Total packets | Discarded packets |
| A | 0 | 256 | 0 |
| B | 0 | 256 | 0 |
| C | 0 | 256 | 0 |
| D | 0 | 256 | 0 |
| Quadrant | Total seconds | Saturated seconds | Saturation percentage |
|---|---|---|---|
| A | 12698 | 223 | 1.756182% |
| B | 12698 | 171 | 1.346669% |
| C | 12698 | 514 | 4.047882% |
| D | 12698 | 497 | 3.914002% |
Noise dominated data is calculated using 1-second bins in cleaned event files. If a bin has >2000 counts, and if more than 50% of those come from <1% of pixels, then it is considered to be noise-dominated and hence unusable.
| Quadrant | # 1 sec bins | Bins with >0 counts | Bins with >2000 counts | High rate bins dominated by noise | Noise dominated (total time) | Noise dominated (detector-on time) | Marked lightcurve |
|---|---|---|---|---|---|---|---|
| A | 14049 | 12701 | 82 | 82 | 0.58% | 0.65% | 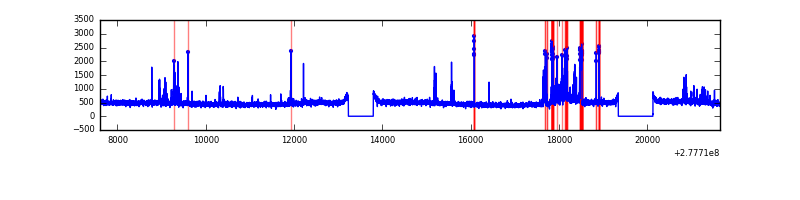 |
| B | 14049 | 12700 | 48 | 48 | 0.34% | 0.38% | 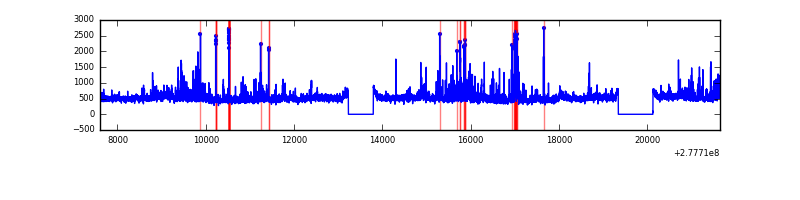 |
| C | 14049 | 12701 | 135 | 135 | 0.96% | 1.06% | 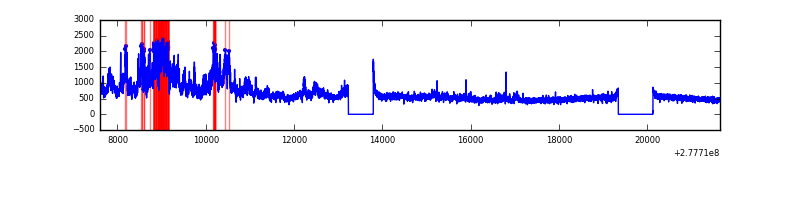 |
| D | 14049 | 12701 | 292 | 292 | 2.08% | 2.30% | 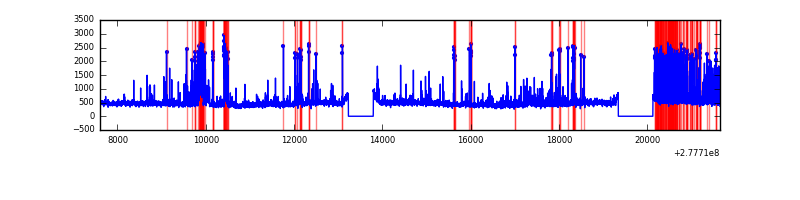 |
Top three noisy pixels from each quadrant. If the there are fewer than three noisy pixels in the level2.evt file, extra rows are filled as -1
| Pixel properties | Quadrant properties | ||||||
|---|---|---|---|---|---|---|---|
| Quadrant | DetID | PixID | Counts | Sigma | Mean | Median | Sigma |
| A | 15 | 174 | 607324 | 1968.42 | 1517 | 1485 | 307.8 |
| A | 15 | 223 | 34529 | 107.36 | 1517 | 1485 | 307.8 |
| A | 13 | 248 | 13513 | 39.08 | 1517 | 1485 | 307.8 |
| B | 7 | 220 | 295318 | 1006.0 | 1524 | 1484 | 292.1 |
| B | 15 | 35 | 213843 | 727.05 | 1524 | 1484 | 292.1 |
| B | 3 | 209 | 130356 | 441.22 | 1524 | 1484 | 292.1 |
| C | 3 | 233 | 2809027 | 8258.43 | 1452 | 1461 | 340.0 |
| C | 14 | 238 | 221128 | 646.15 | 1452 | 1461 | 340.0 |
| C | 7 | 247 | 43221 | 122.84 | 1452 | 1461 | 340.0 |
| D | 5 | 222 | 737153 | 2078.08 | 1457 | 1417 | 354.0 |
| D | 1 | 52 | 607893 | 1712.99 | 1457 | 1417 | 354.0 |
| D | 10 | 70 | 197765 | 554.58 | 1457 | 1417 | 354.0 |
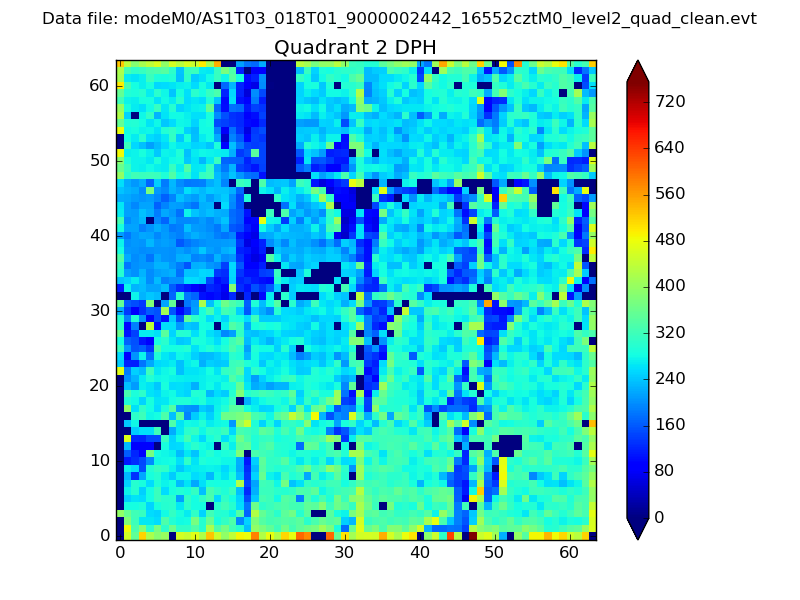
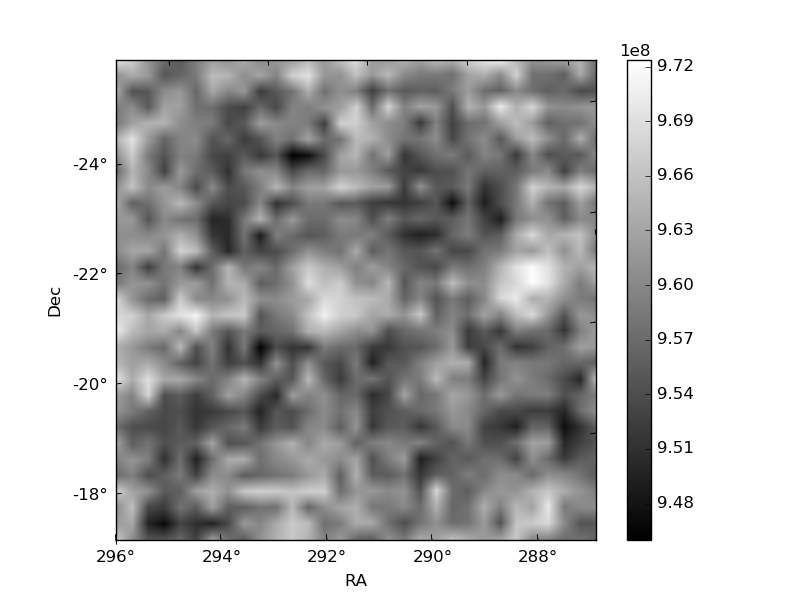
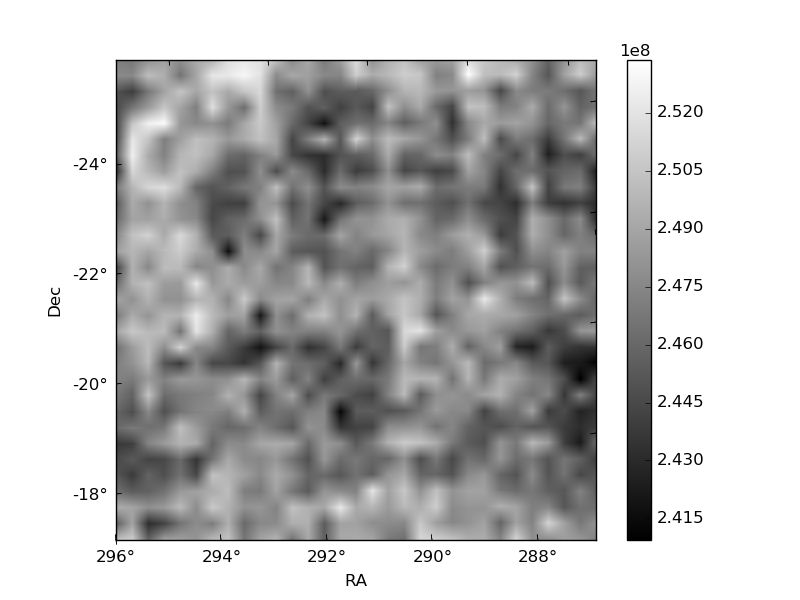
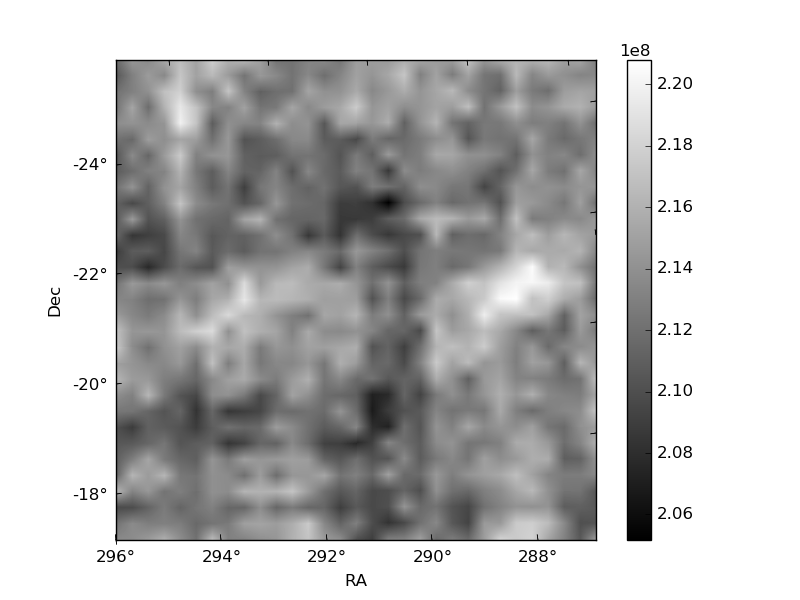
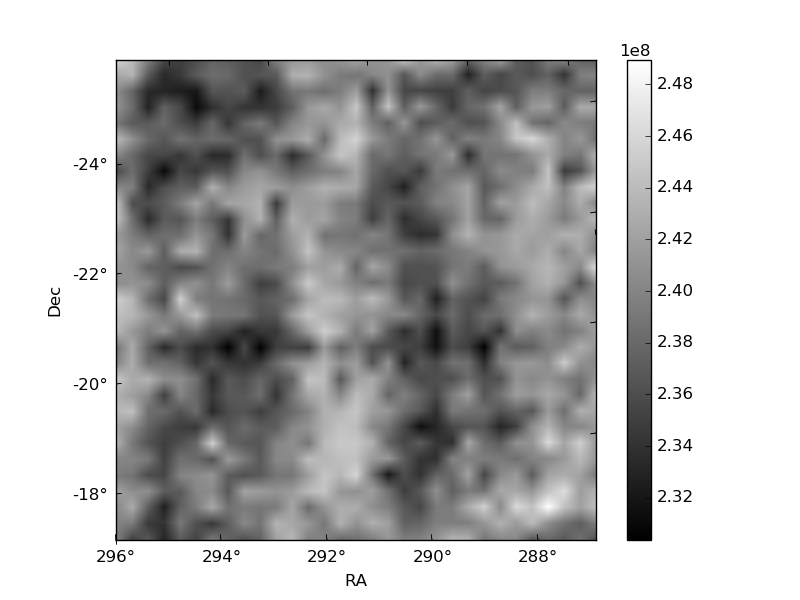
Histogram calculated using DETX and DETY for each event in the final _common_clean file
| Quadrant A | 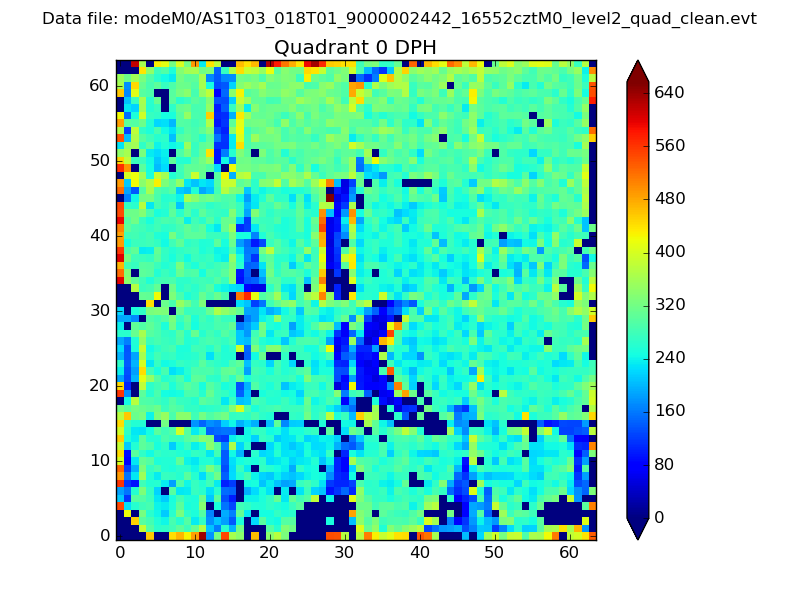 |
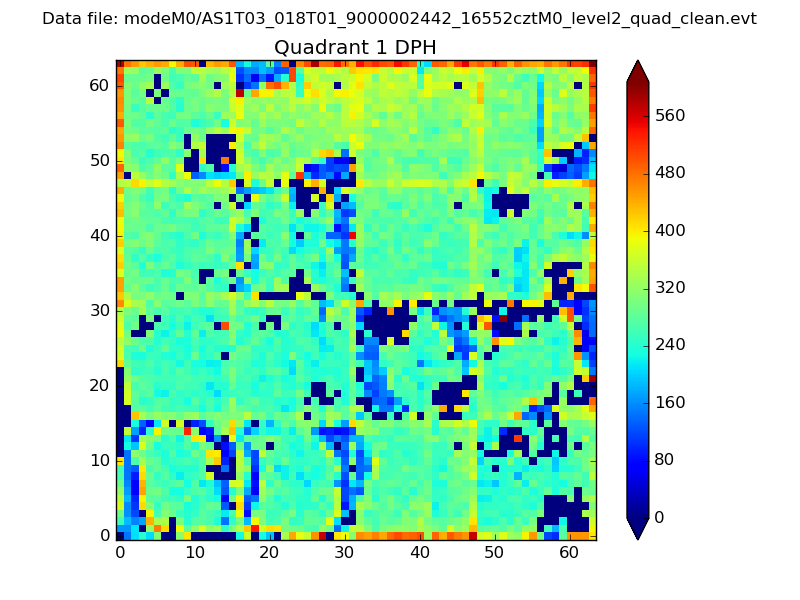 |
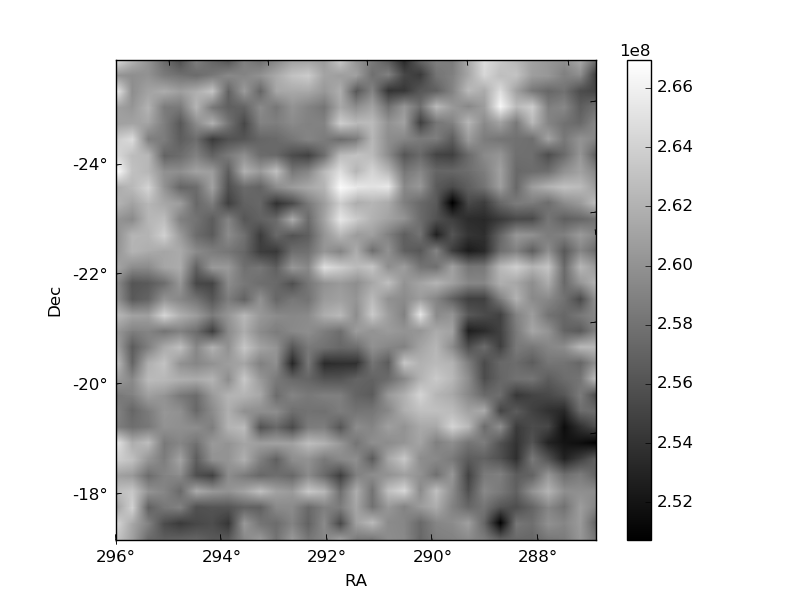
Quadrant B |
|---|---|---|---|
| Quadrant D | 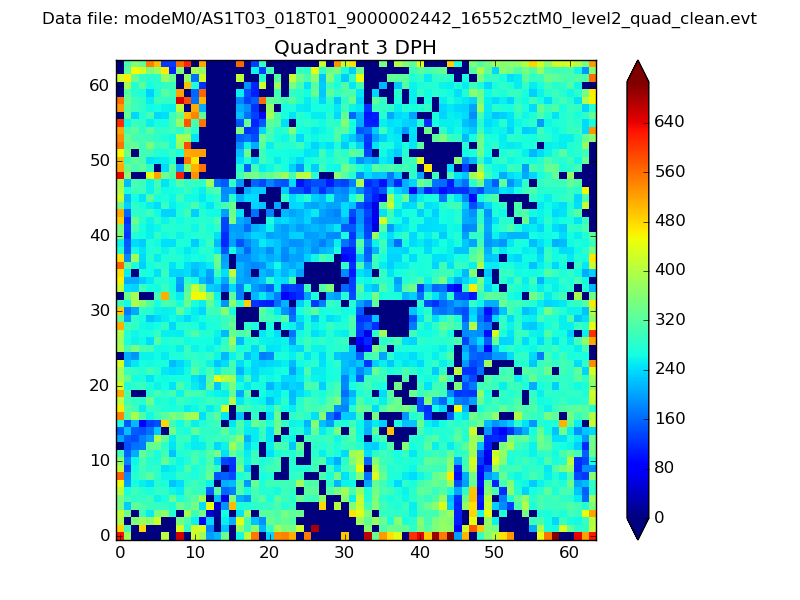 |
 |
Quadrant C |
| Plot type | Count rate plots | Images |
|---|---|---|
| Comparison with Poisson distribution Blue bars denote a histogram of data divided into 1 sec bins. Red curve is a Poisson curve with rate = median count rate of data. |
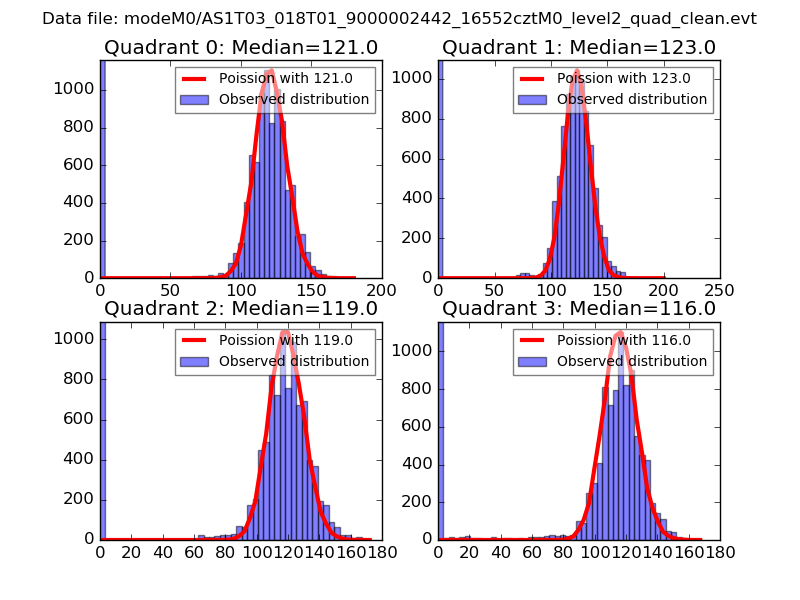 |
 |
| Quadrant-wise count rates Data is divided into 100 sec bins |
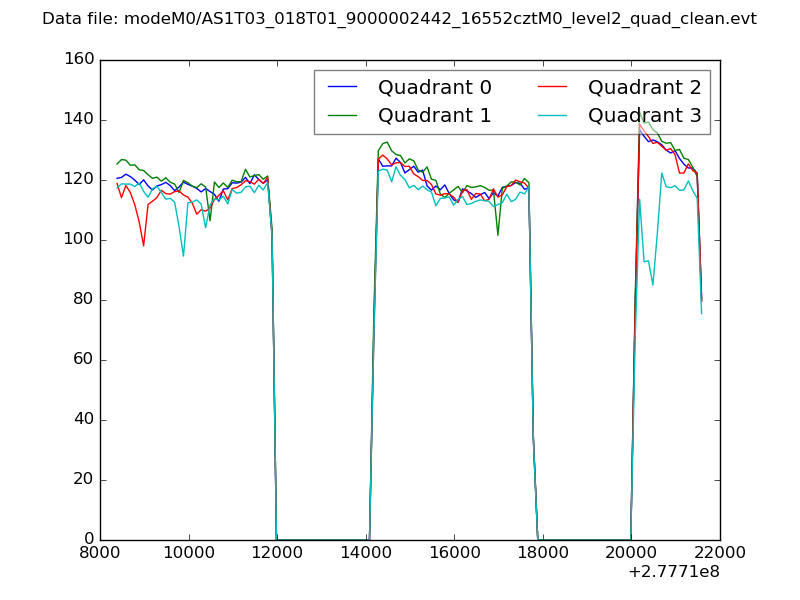 |
|
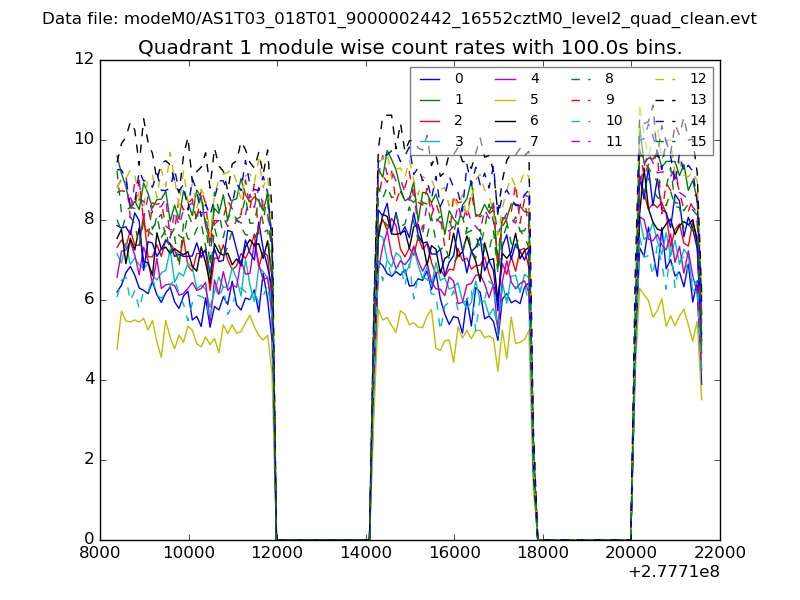
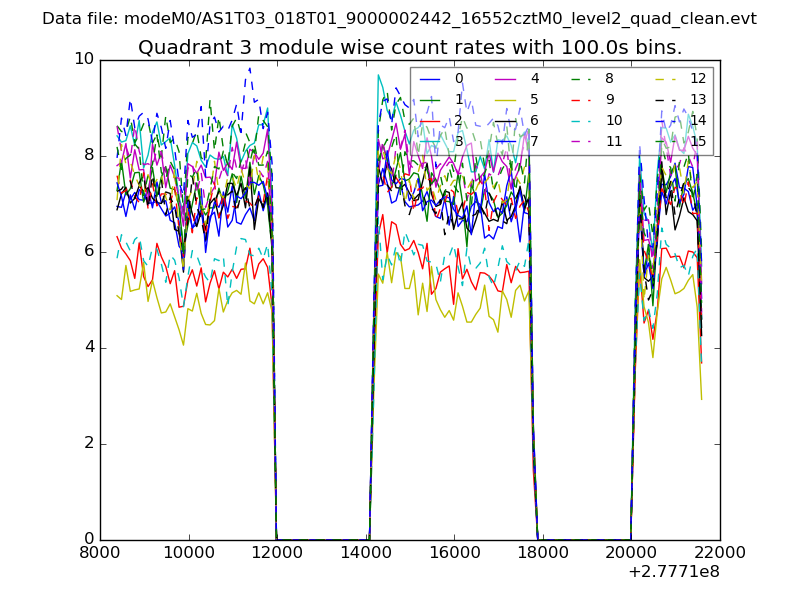
| Module-wise count rates for Quadrant A Data is divided into 100 sec bins |
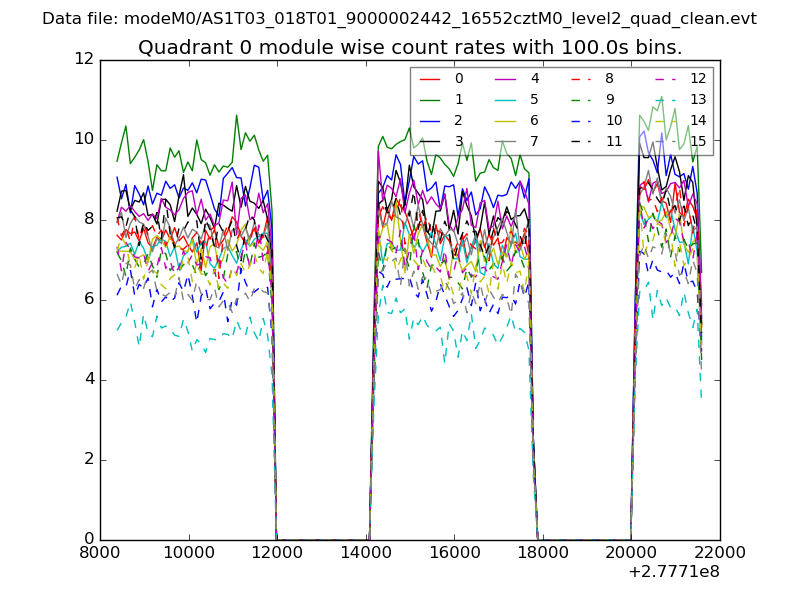 |
 |
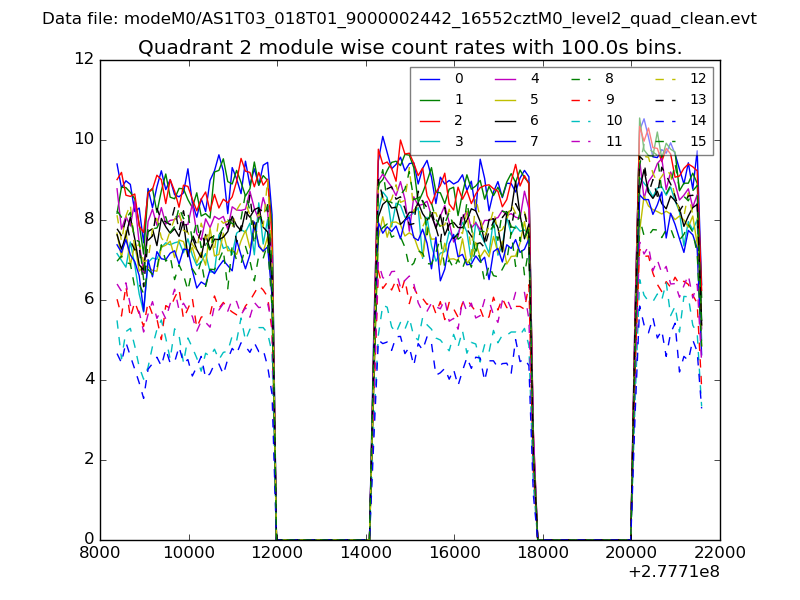
| Module-wise count rates for Quadrant B Data is divided into 100 sec bins |
 |
 |
| Module-wise count rates for Quadrant C Data is divided into 100 sec bins |
 |
 |
| Module-wise count rates for Quadrant D Data is divided into 100 sec bins |
 |
 |
| Parameter | Plot |
|---|---|
| CZT HV Monitor | 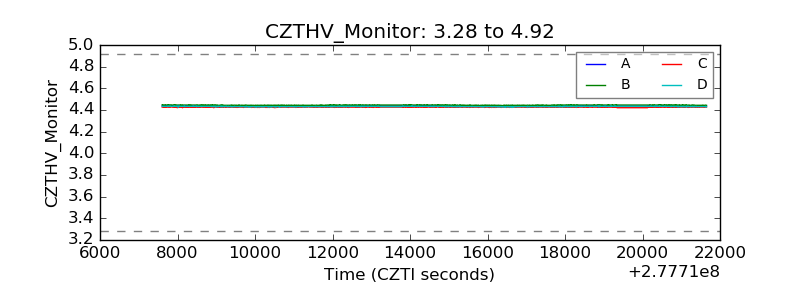 |
| D_VDD | 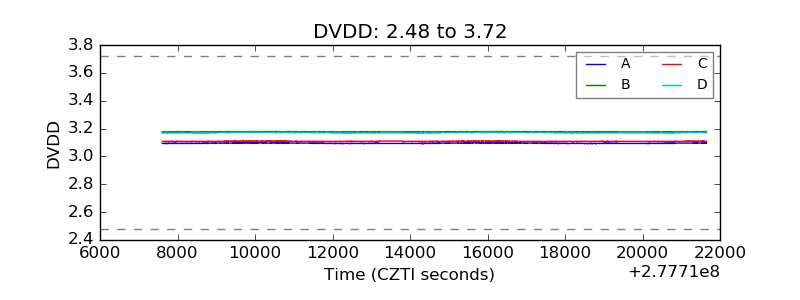 |
| Temperature 1 | 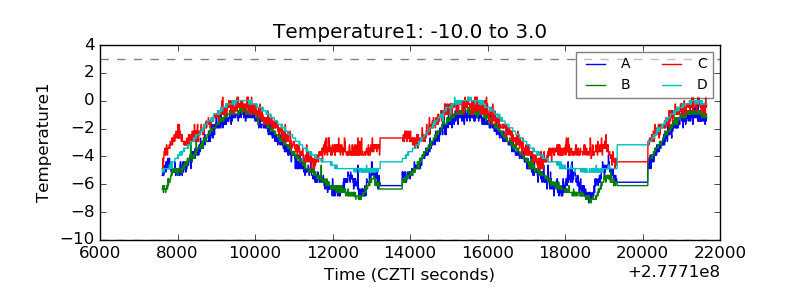 |
| Veto HV Monitor | 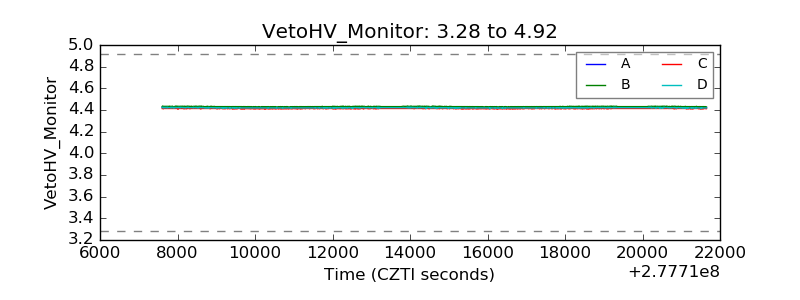 |
| Veto LLD | 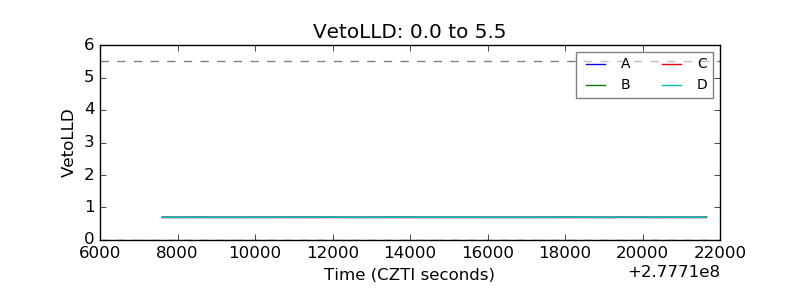 |
| Alpha Counter | 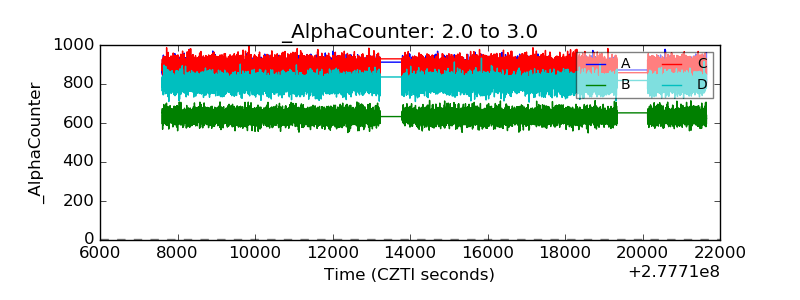 |
| _CPM_Rate | 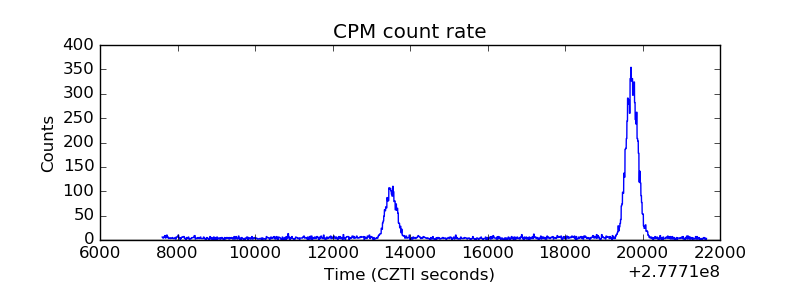 |
| CZT Counter | 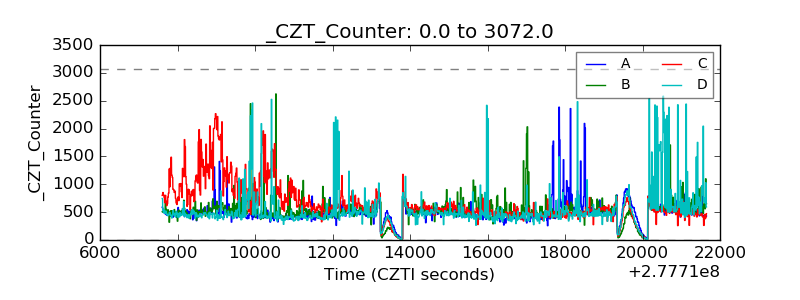 |
| +2.5 Volts monitor | 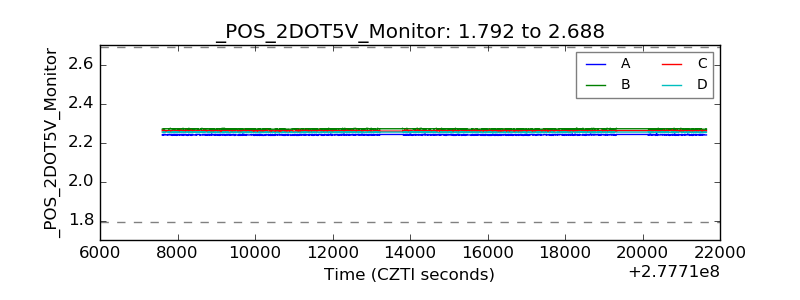 |
| +5 Volts monitor |  |
| _ROLL_ROT | 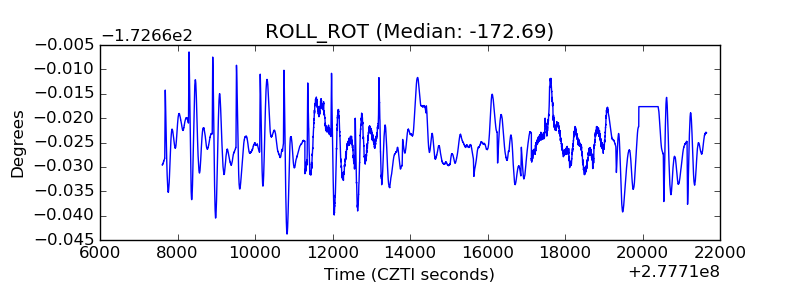 |
| _Roll_DEC | 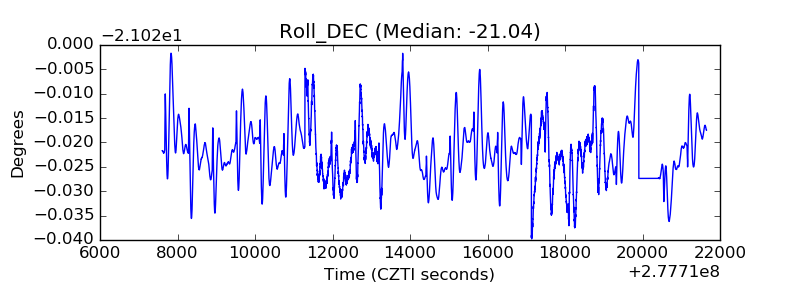 |
| _Roll_RA | 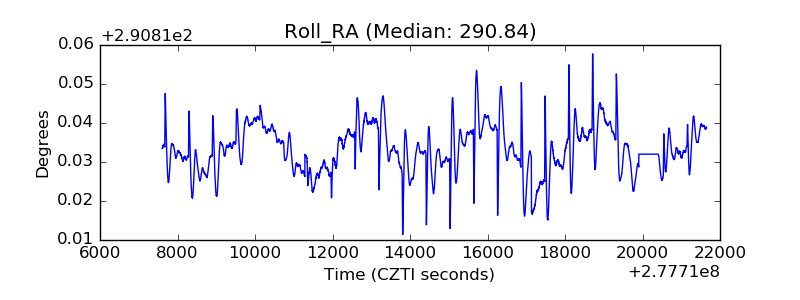 |
| Veto Counter | 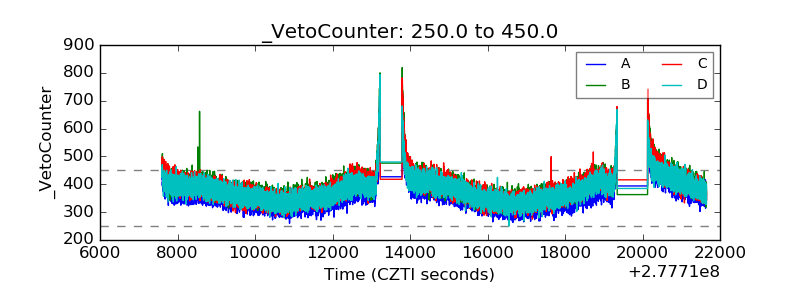 |