| Param | Original file | Final file |
|---|---|---|
| Filename | modeM0/AS1T03_018T01_9000002442_16553cztM0_level2.evt | modeM0/AS1T03_018T01_9000002442_16553cztM0_level2_quad_clean.evt |
| Size (bytes) | 477,685,440 | 89,965,440 |
| Size | 455.6 MB | 85.8 MB |
| Events in quadrant A | 3,117,205 | 575,900 |
| Events in quadrant B | 3,503,917 | 583,376 |
| Events in quadrant C | 3,213,754 | 570,074 |
| Events in quadrant D | 4,193,373 | 544,503 |
| Mode M0 | |||
|---|---|---|---|
| Quadrant | BADHDUFLAG | Total packets | Discarded packets |
| A | 0 | 13541 | 2 |
| B | 0 | 14557 | 1 |
| C | 0 | 13701 | 1 |
| D | 0 | 16862 | 1 |
| Mode M9 | |||
|---|---|---|---|
| Quadrant | BADHDUFLAG | Total packets | Discarded packets |
| A | 0 | 9 | 0 |
| B | 0 | 9 | 0 |
| C | 0 | 9 | 0 |
| D | 0 | 9 | 0 |
| Mode SS | |||
|---|---|---|---|
| Quadrant | BADHDUFLAG | Total packets | Discarded packets |
| A | 0 | 132 | 0 |
| B | 0 | 132 | 0 |
| C | 0 | 132 | 0 |
| D | 0 | 132 | 0 |
| Quadrant | Total seconds | Saturated seconds | Saturation percentage |
|---|---|---|---|
| A | 6455 | 54 | 0.836561% |
| B | 6455 | 66 | 1.022463% |
| C | 6455 | 69 | 1.068939% |
| D | 6455 | 187 | 2.896979% |
Noise dominated data is calculated using 1-second bins in cleaned event files. If a bin has >2000 counts, and if more than 50% of those come from <1% of pixels, then it is considered to be noise-dominated and hence unusable.
| Quadrant | # 1 sec bins | Bins with >0 counts | Bins with >2000 counts | High rate bins dominated by noise | Noise dominated (total time) | Noise dominated (detector-on time) | Marked lightcurve |
|---|---|---|---|---|---|---|---|
| A | 7376 | 6457 | 0 | 0 | 0.00% | 0.00% | 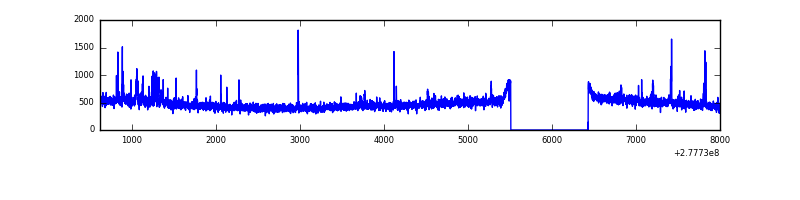 |
| B | 7376 | 6457 | 4 | 4 | 0.05% | 0.06% | 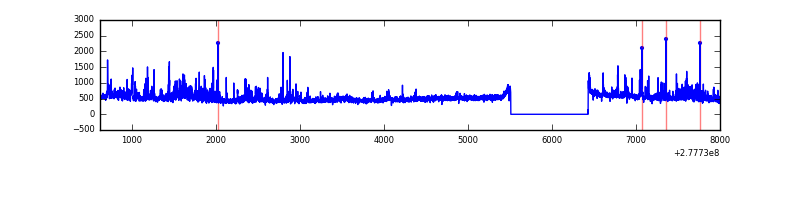 |
| C | 7376 | 6457 | 0 | 0 | 0.00% | 0.00% | 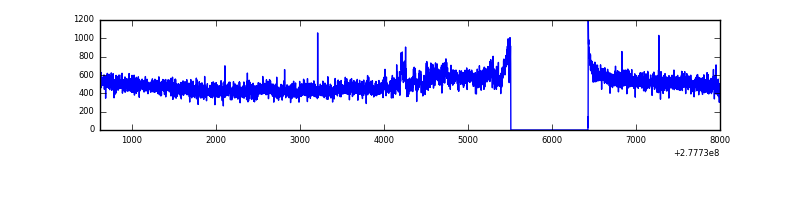 |
| D | 7376 | 6457 | 144 | 144 | 1.95% | 2.23% | 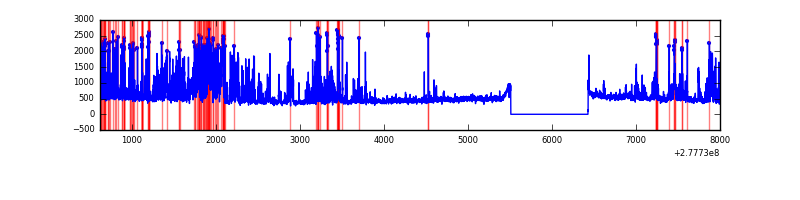 |
Top three noisy pixels from each quadrant. If the there are fewer than three noisy pixels in the level2.evt file, extra rows are filled as -1
| Pixel properties | Quadrant properties | ||||||
|---|---|---|---|---|---|---|---|
| Quadrant | DetID | PixID | Counts | Sigma | Mean | Median | Sigma |
| A | 15 | 174 | 103393 | 648.5 | 777 | 761 | 158.3 |
| A | 15 | 223 | 19825 | 120.46 | 777 | 761 | 158.3 |
| A | 0 | 226 | 6856 | 38.51 | 777 | 761 | 158.3 |
| B | 7 | 220 | 152148 | 1008.5 | 775 | 758 | 150.1 |
| B | 15 | 35 | 119445 | 790.64 | 775 | 758 | 150.1 |
| B | 0 | 198 | 51579 | 338.55 | 775 | 758 | 150.1 |
| C | 3 | 233 | 210641 | 1211.01 | 741 | 746 | 173.3 |
| C | 14 | 238 | 112534 | 644.97 | 741 | 746 | 173.3 |
| C | 13 | 61 | 5297 | 26.26 | 741 | 746 | 173.3 |
| D | 5 | 222 | 964032 | 5240.23 | 746 | 723 | 183.8 |
| D | 1 | 52 | 168696 | 913.74 | 746 | 723 | 183.8 |
| D | 2 | 33 | 110569 | 597.54 | 746 | 723 | 183.8 |
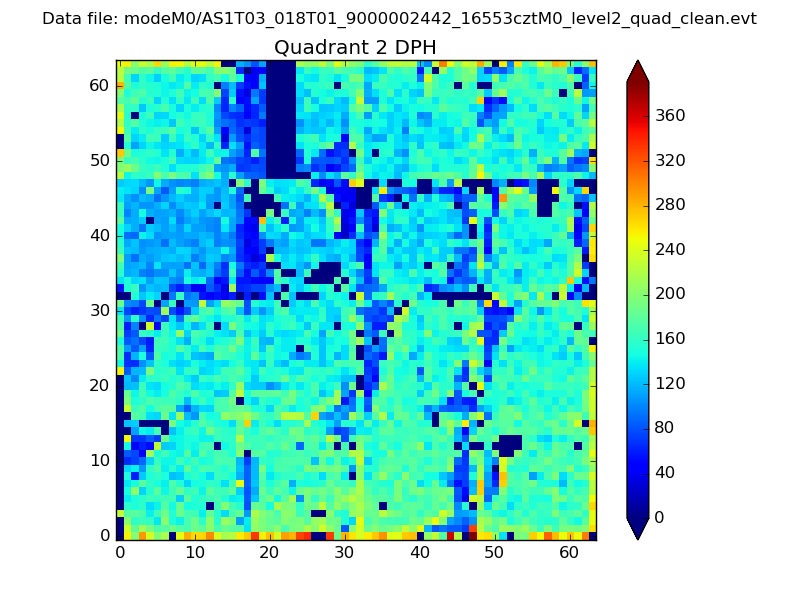
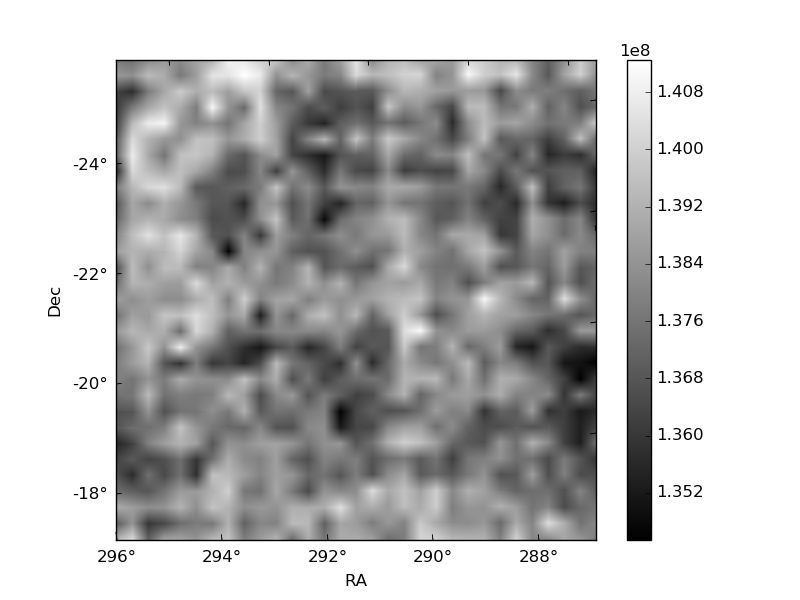
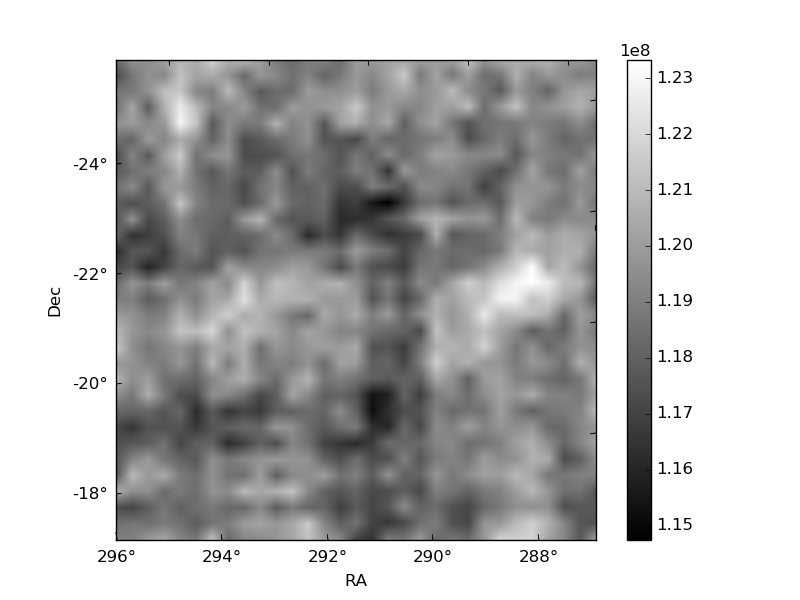
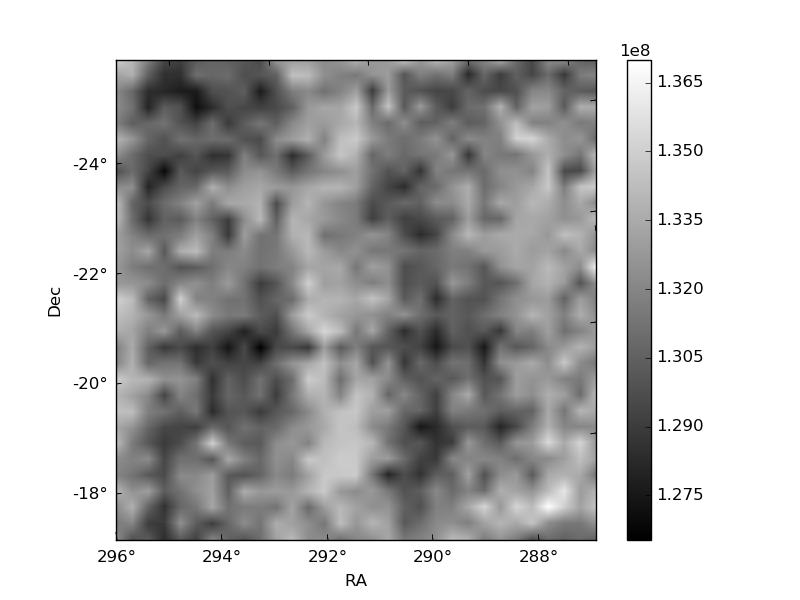
Histogram calculated using DETX and DETY for each event in the final _common_clean file
| Quadrant A |  |
 |
Quadrant B |
|---|---|---|---|
| Quadrant D | 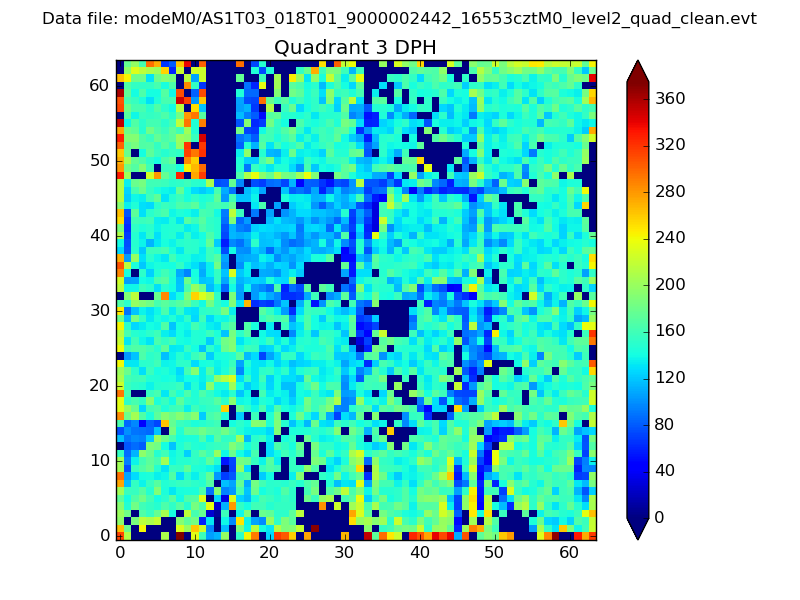 |
 |
Quadrant C |
| Plot type | Count rate plots | Images |
|---|---|---|
| Comparison with Poisson distribution Blue bars denote a histogram of data divided into 1 sec bins. Red curve is a Poisson curve with rate = median count rate of data. |
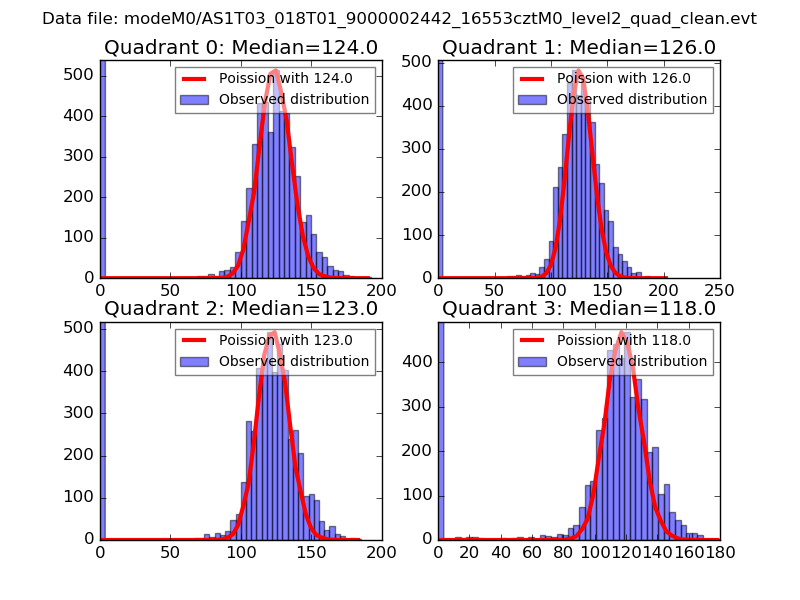 |
 |
| Quadrant-wise count rates Data is divided into 100 sec bins |
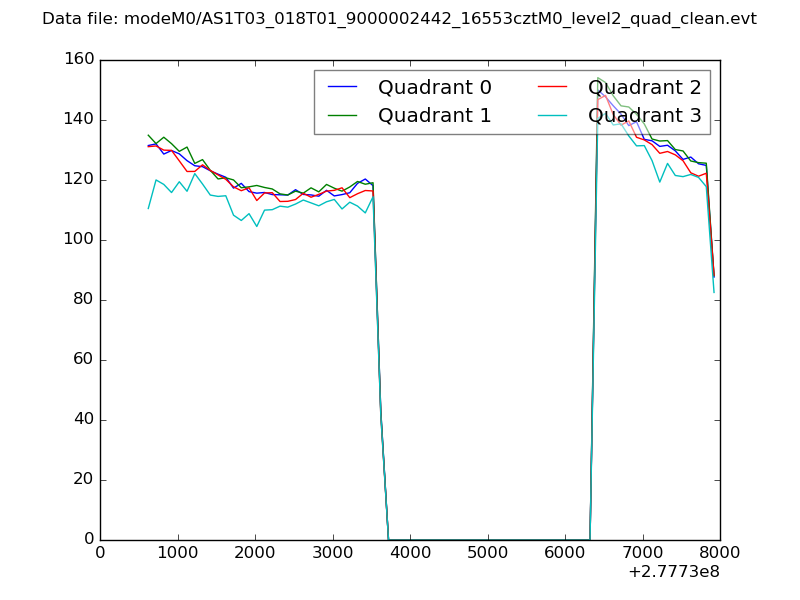 |
|
| Module-wise count rates for Quadrant A Data is divided into 100 sec bins |
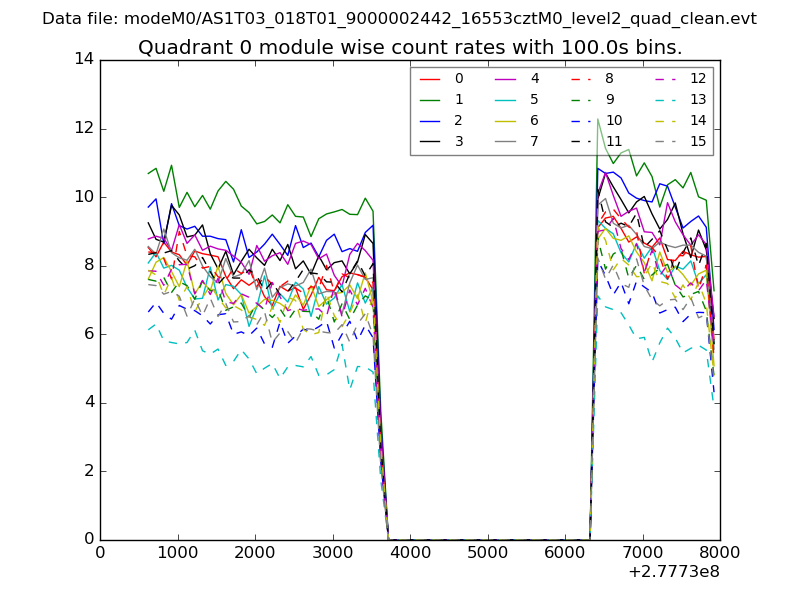 |
 |
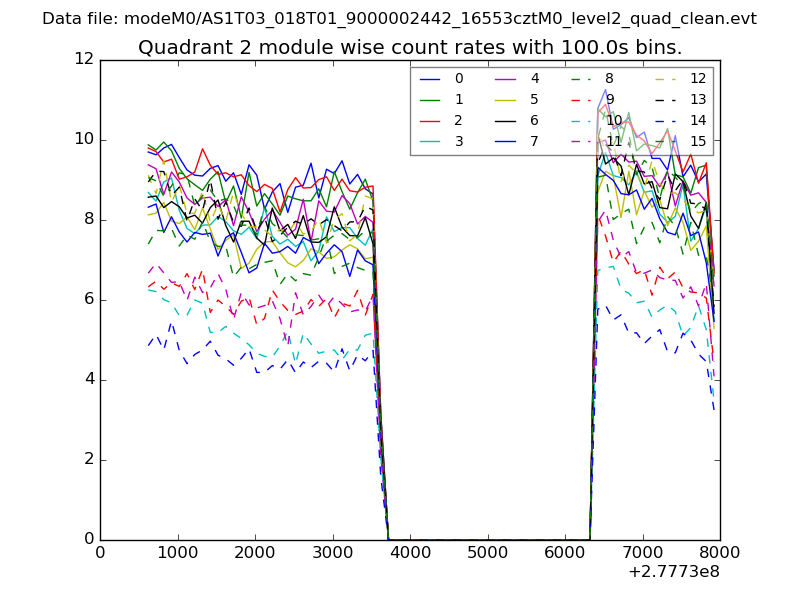
| Module-wise count rates for Quadrant B Data is divided into 100 sec bins |
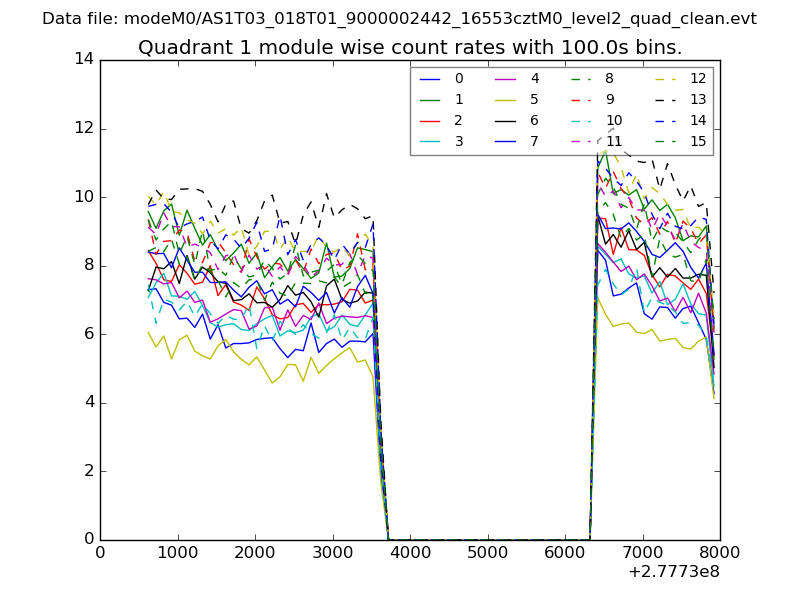 |
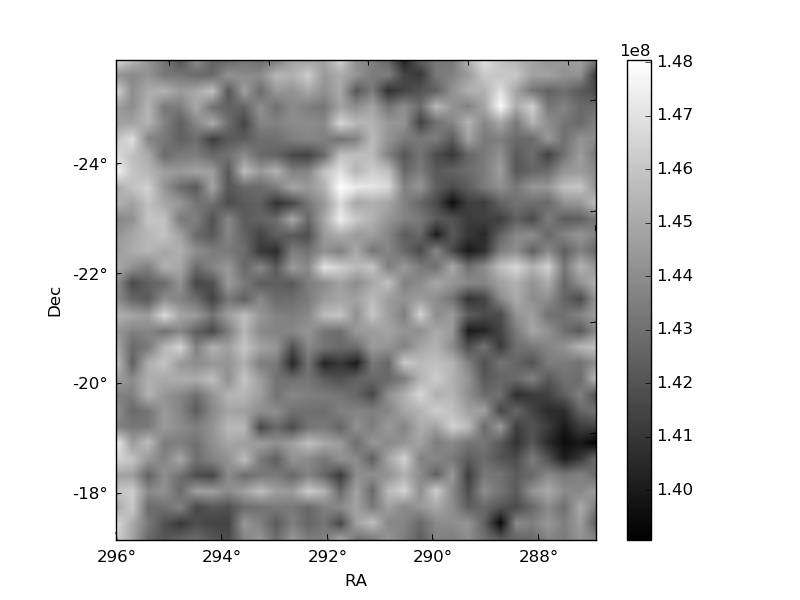 |
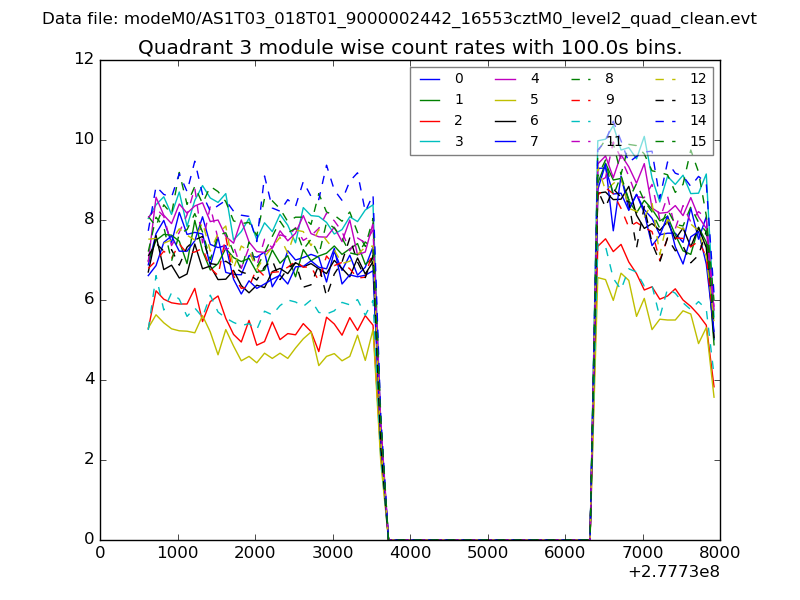
| Module-wise count rates for Quadrant C Data is divided into 100 sec bins |
 |
 |
| Module-wise count rates for Quadrant D Data is divided into 100 sec bins |
 |
 |
| Parameter | Plot |
|---|---|
| CZT HV Monitor | 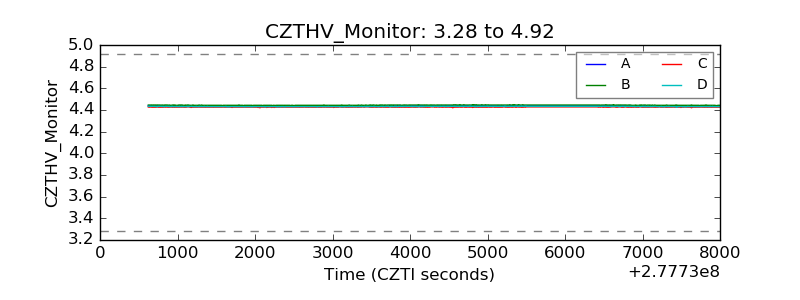 |
| D_VDD | 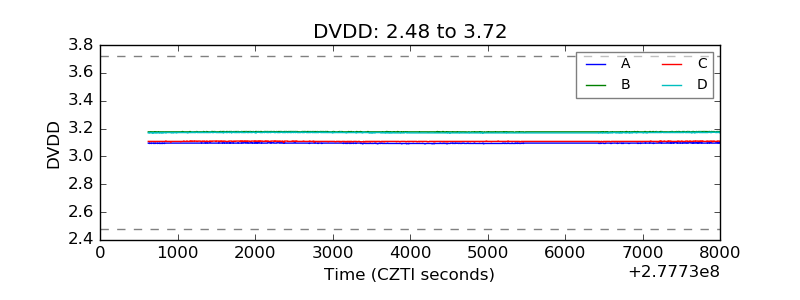 |
| Temperature 1 |  |
| Veto HV Monitor | 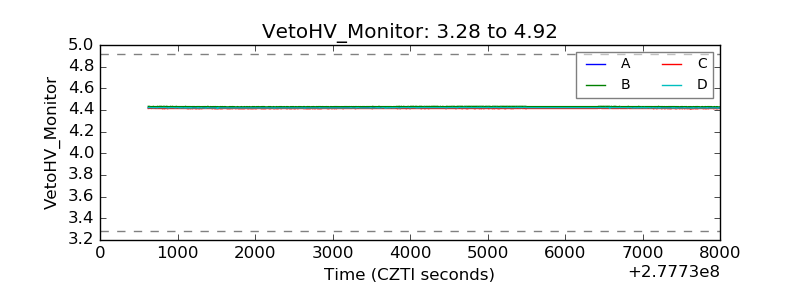 |
| Veto LLD |  |
| Alpha Counter | 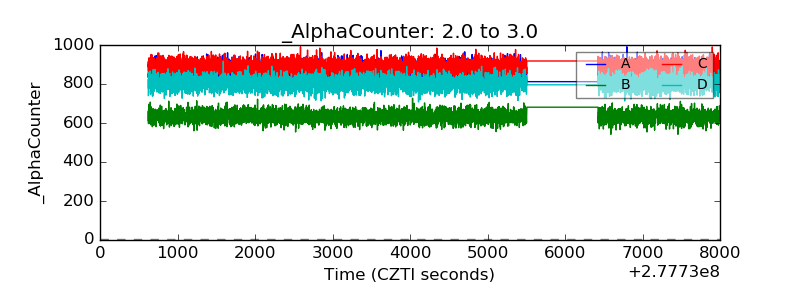 |
| _CPM_Rate | 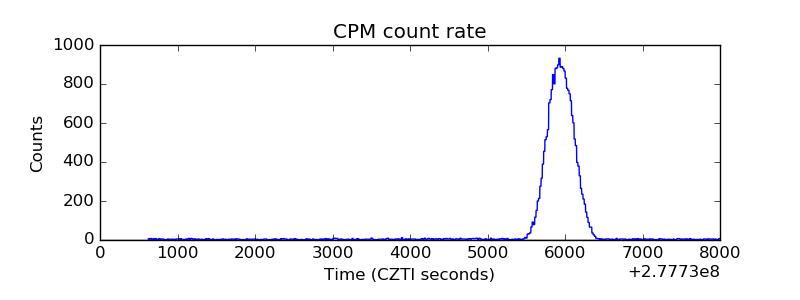 |
| CZT Counter | 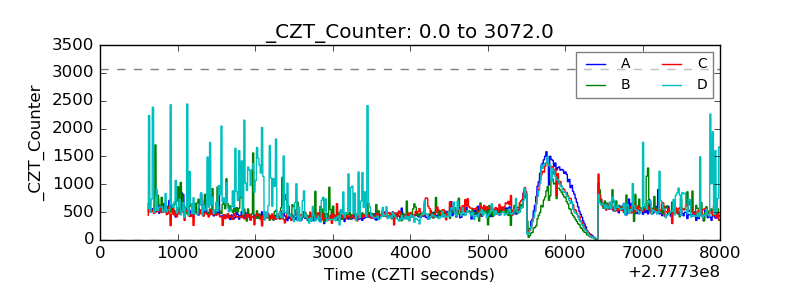 |
| +2.5 Volts monitor |  |
| +5 Volts monitor | 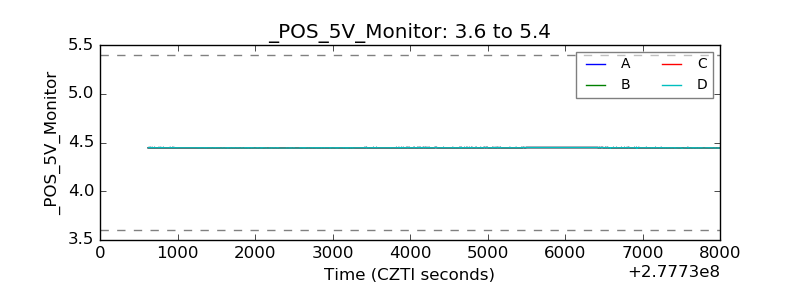 |
| _ROLL_ROT | 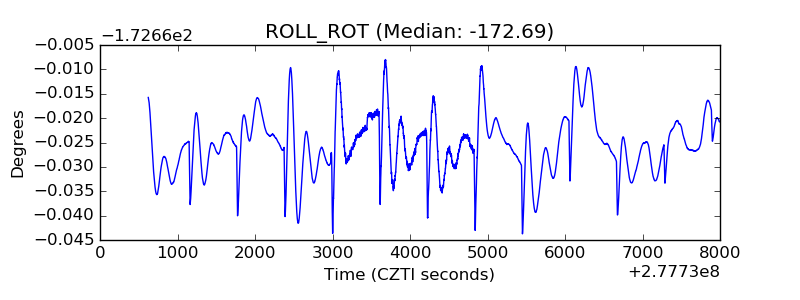 |
| _Roll_DEC | 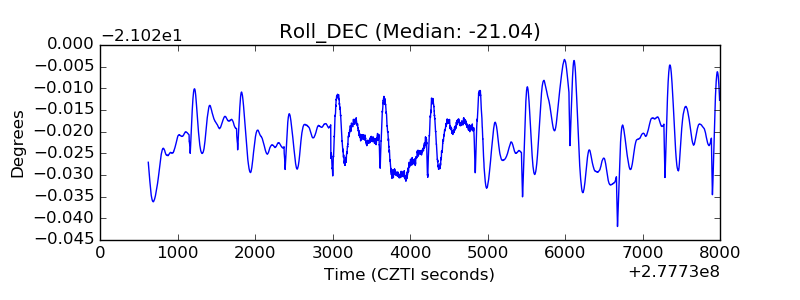 |
| _Roll_RA | 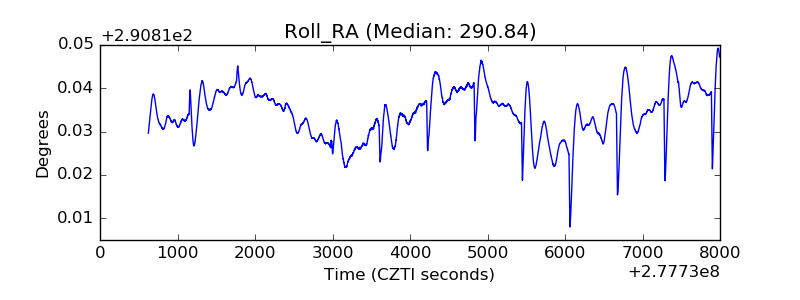 |
| Veto Counter | 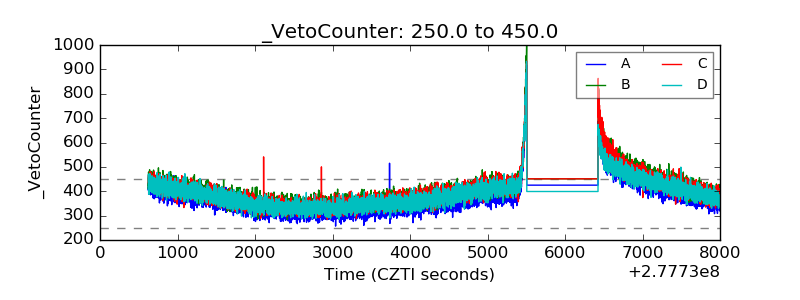 |