| Param | Original file | Final file |
|---|---|---|
| Filename | modeM0/AS1T03_018T01_9000002442_16554cztM0_level2.evt | modeM0/AS1T03_018T01_9000002442_16554cztM0_level2_quad_clean.evt |
| Size (bytes) | 521,729,280 | 81,987,840 |
| Size | 497.6 MB | 78.2 MB |
| Events in quadrant A | 3,286,131 | 538,941 |
| Events in quadrant B | 3,596,070 | 546,541 |
| Events in quadrant C | 3,307,306 | 528,131 |
| Events in quadrant D | 5,185,125 | 431,372 |
| Mode M0 | |||
|---|---|---|---|
| Quadrant | BADHDUFLAG | Total packets | Discarded packets |
| A | 0 | 13967 | 2 |
| B | 0 | 14738 | 1 |
| C | 0 | 14005 | 1 |
| D | 0 | 19684 | 1 |
| Mode M9 | |||
|---|---|---|---|
| Quadrant | BADHDUFLAG | Total packets | Discarded packets |
| A | 0 | 11 | 0 |
| B | 0 | 11 | 0 |
| C | 0 | 11 | 0 |
| D | 0 | 11 | 0 |
| Mode SS | |||
|---|---|---|---|
| Quadrant | BADHDUFLAG | Total packets | Discarded packets |
| A | 0 | 126 | 0 |
| B | 0 | 126 | 0 |
| C | 0 | 126 | 0 |
| D | 0 | 126 | 0 |
| Quadrant | Total seconds | Saturated seconds | Saturation percentage |
|---|---|---|---|
| A | 6271 | 113 | 1.801945% |
| B | 6271 | 124 | 1.977356% |
| C | 6271 | 84 | 1.339499% |
| D | 6271 | 1613 | 25.721576% |
Noise dominated data is calculated using 1-second bins in cleaned event files. If a bin has >2000 counts, and if more than 50% of those come from <1% of pixels, then it is considered to be noise-dominated and hence unusable.
| Quadrant | # 1 sec bins | Bins with >0 counts | Bins with >2000 counts | High rate bins dominated by noise | Noise dominated (total time) | Noise dominated (detector-on time) | Marked lightcurve |
|---|---|---|---|---|---|---|---|
| A | 7337 | 6273 | 30 | 30 | 0.41% | 0.48% | 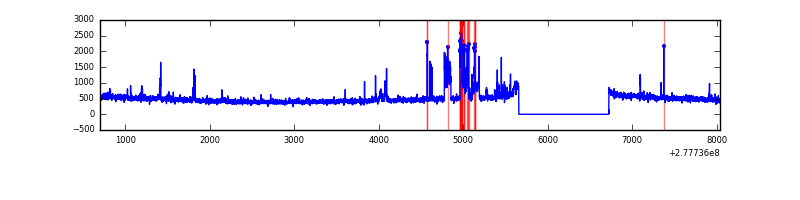 |
| B | 7337 | 6273 | 40 | 40 | 0.55% | 0.64% | 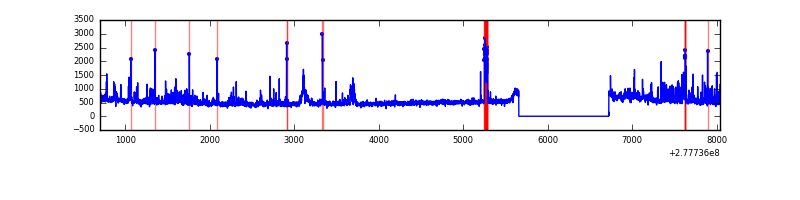 |
| C | 7337 | 6273 | 0 | 0 | 0.00% | 0.00% |  |
| D | 7337 | 6273 | 310 | 310 | 4.23% | 4.94% | 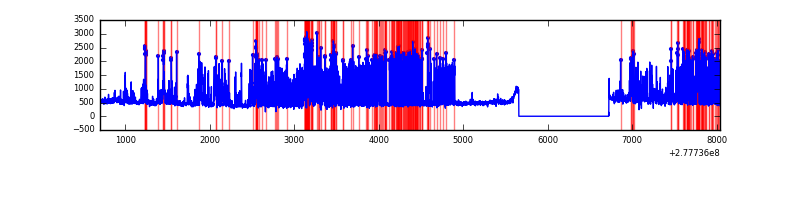 |
Top three noisy pixels from each quadrant. If the there are fewer than three noisy pixels in the level2.evt file, extra rows are filled as -1
| Pixel properties | Quadrant properties | ||||||
|---|---|---|---|---|---|---|---|
| Quadrant | DetID | PixID | Counts | Sigma | Mean | Median | Sigma |
| A | 15 | 174 | 330733 | 2130.25 | 762 | 747 | 154.9 |
| A | 15 | 223 | 14180 | 86.72 | 762 | 747 | 154.9 |
| A | 0 | 226 | 6891 | 39.66 | 762 | 747 | 154.9 |
| B | 7 | 220 | 168295 | 1137.03 | 764 | 746 | 147.4 |
| B | 15 | 35 | 142640 | 962.93 | 764 | 746 | 147.4 |
| B | 10 | 16 | 74256 | 498.86 | 764 | 746 | 147.4 |
| C | 3 | 233 | 335347 | 1950.98 | 730 | 735 | 171.5 |
| C | 14 | 238 | 113234 | 655.94 | 730 | 735 | 171.5 |
| C | 7 | 247 | 12353 | 67.74 | 730 | 735 | 171.5 |
| D | 1 | 52 | 2058990 | 13431.46 | 626 | 609 | 153.3 |
| D | 5 | 222 | 414169 | 2698.58 | 626 | 609 | 153.3 |
| D | 2 | 33 | 176205 | 1145.81 | 626 | 609 | 153.3 |
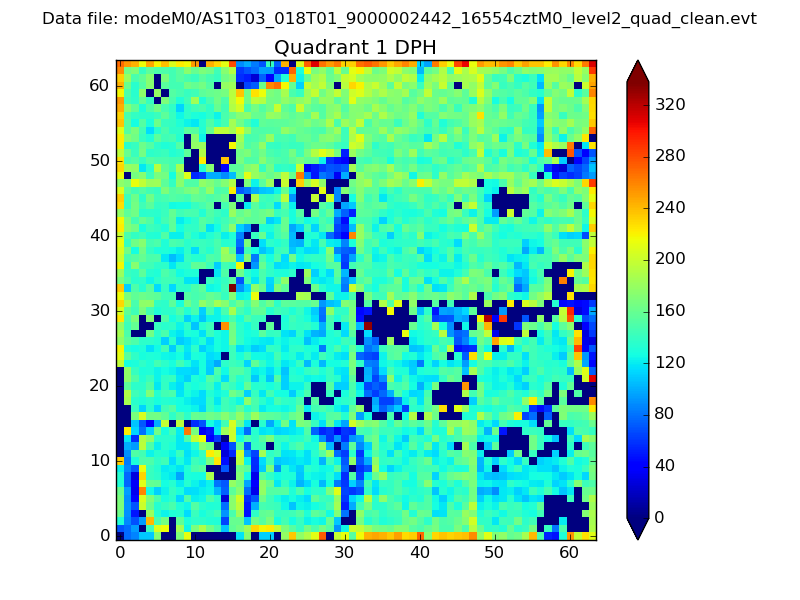
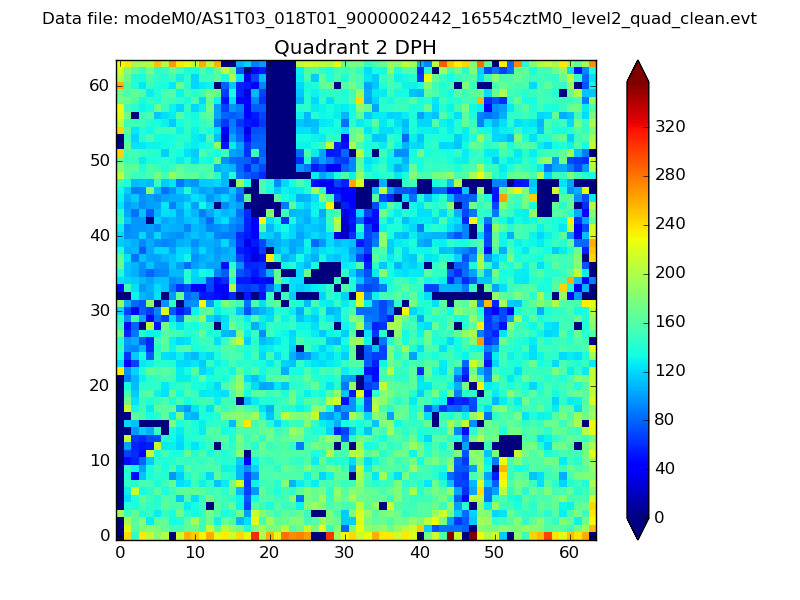
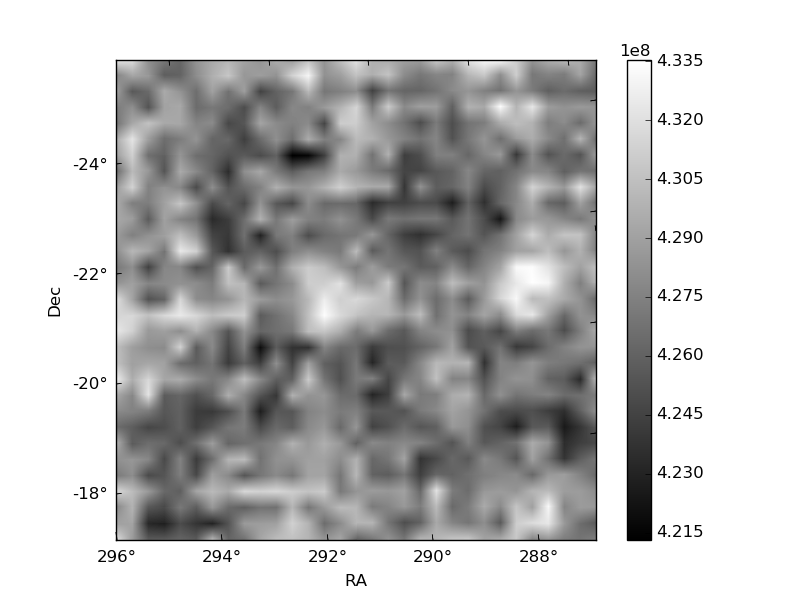
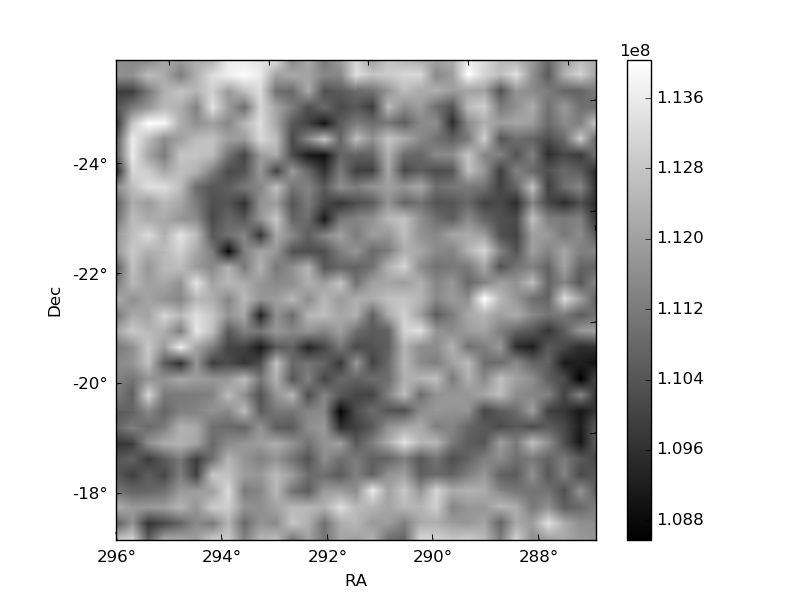
Histogram calculated using DETX and DETY for each event in the final _common_clean file
| Quadrant A | 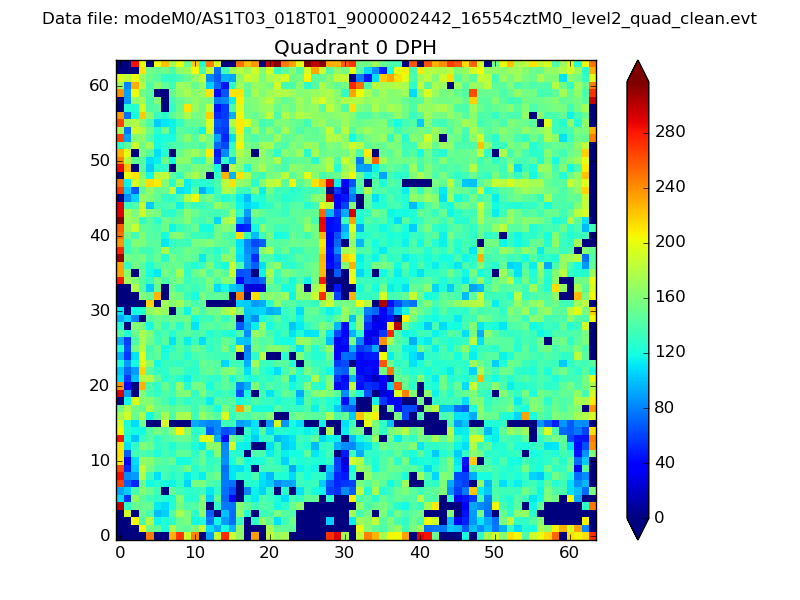 |
 |
Quadrant B |
|---|---|---|---|
| Quadrant D | 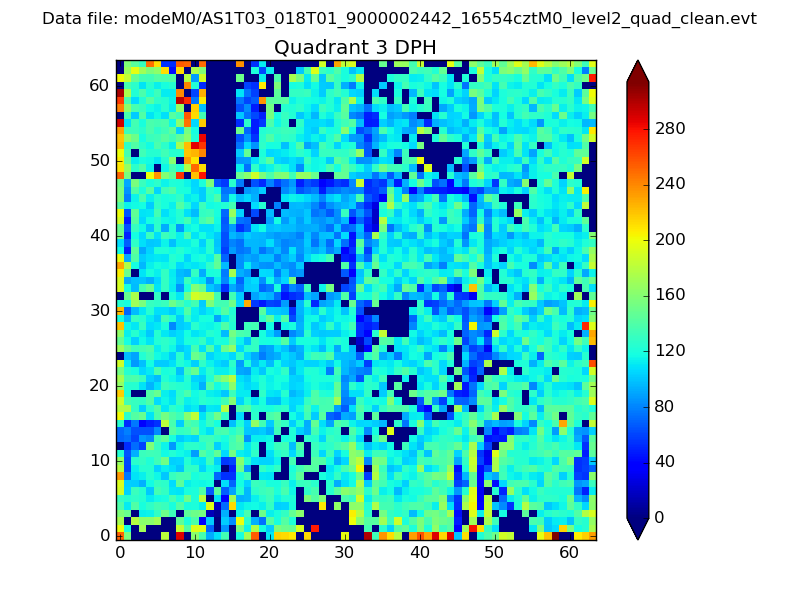 |
 |
Quadrant C |
| Plot type | Count rate plots | Images |
|---|---|---|
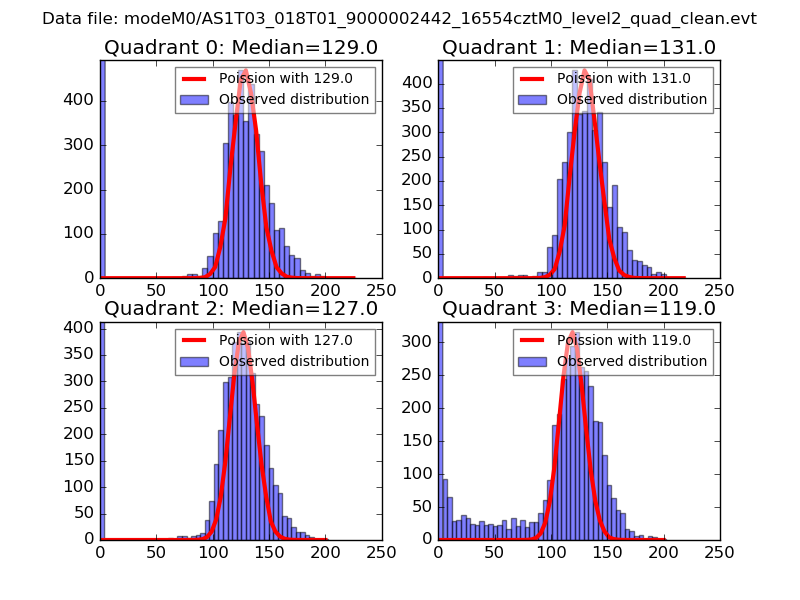
| Comparison with Poisson distribution Blue bars denote a histogram of data divided into 1 sec bins. Red curve is a Poisson curve with rate = median count rate of data. |
 |
 |
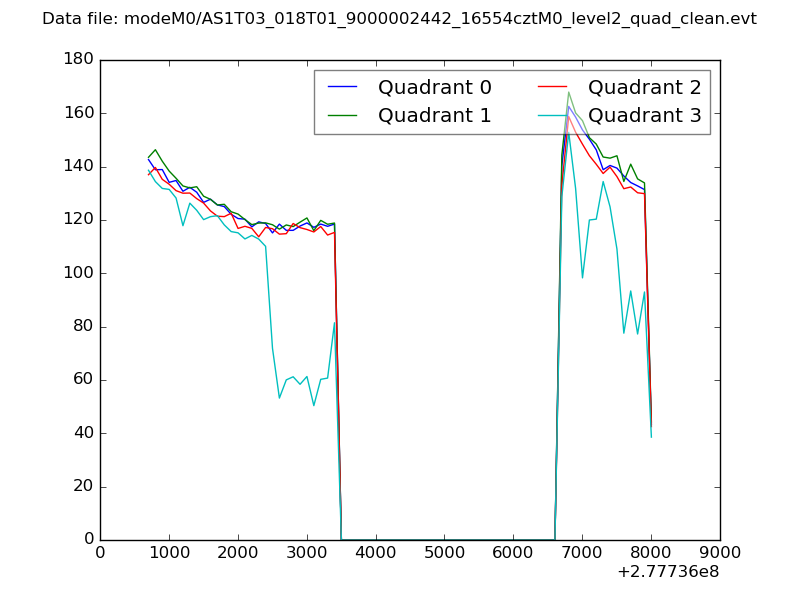
| Quadrant-wise count rates Data is divided into 100 sec bins |
 |
|
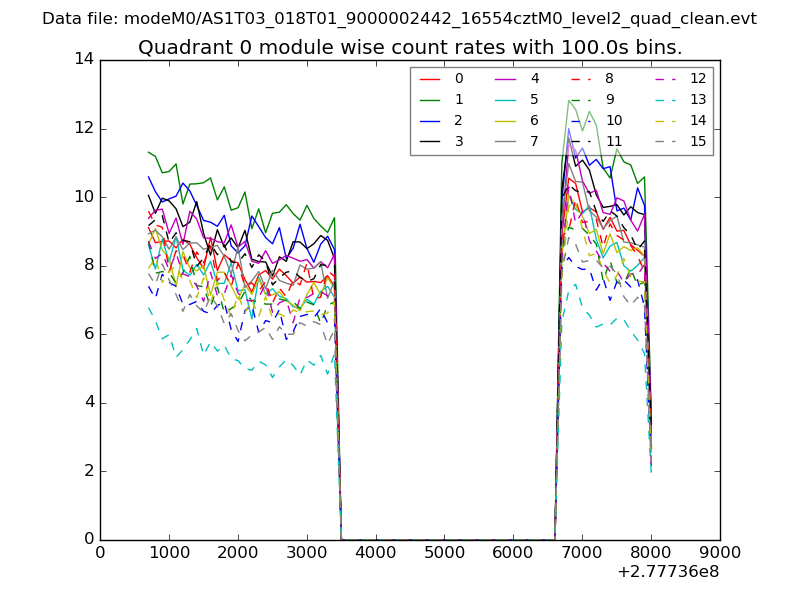
| Module-wise count rates for Quadrant A Data is divided into 100 sec bins |
 |
 |
| Module-wise count rates for Quadrant B Data is divided into 100 sec bins |
 |
 |
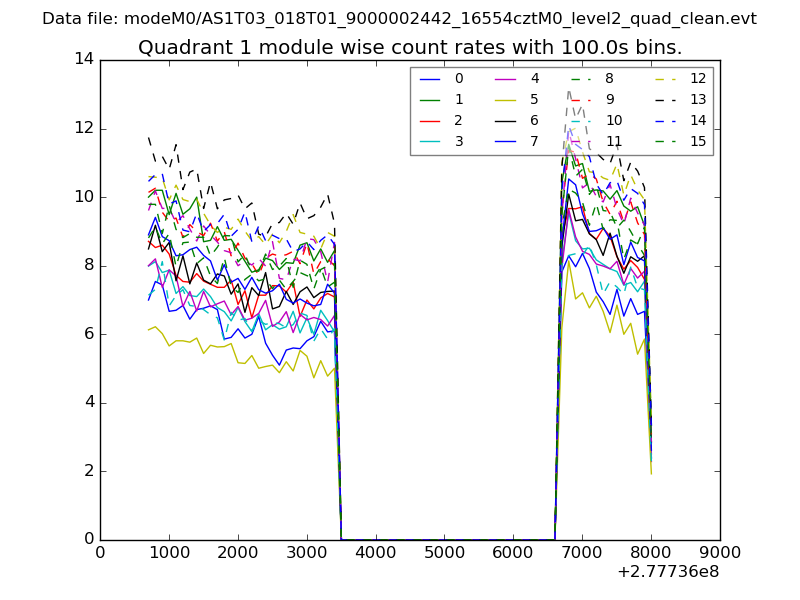
| Module-wise count rates for Quadrant C Data is divided into 100 sec bins |
 |
 |
| Module-wise count rates for Quadrant D Data is divided into 100 sec bins |
 |
 |
| Parameter | Plot |
|---|---|
| CZT HV Monitor | 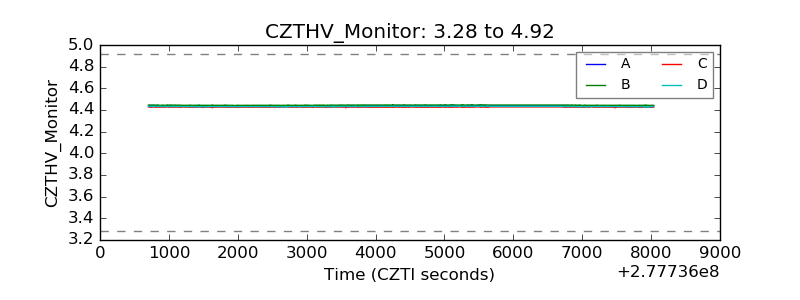 |
| D_VDD | 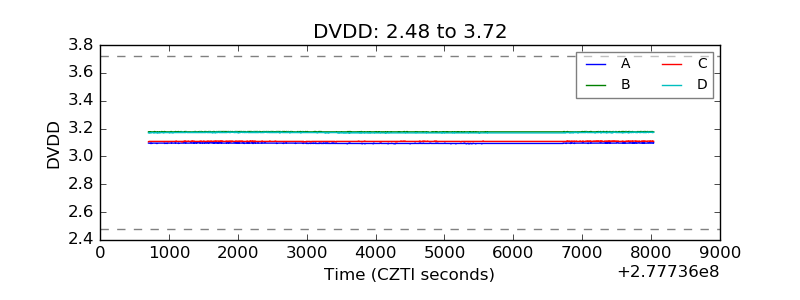 |
| Temperature 1 | 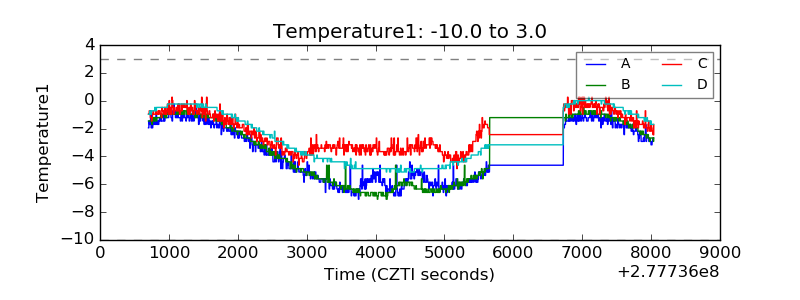 |
| Veto HV Monitor | 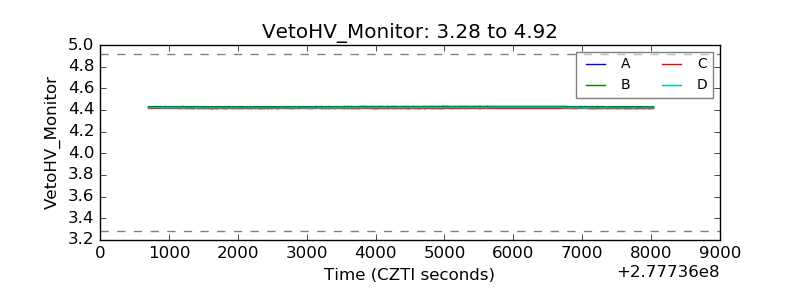 |
| Veto LLD |  |
| Alpha Counter | 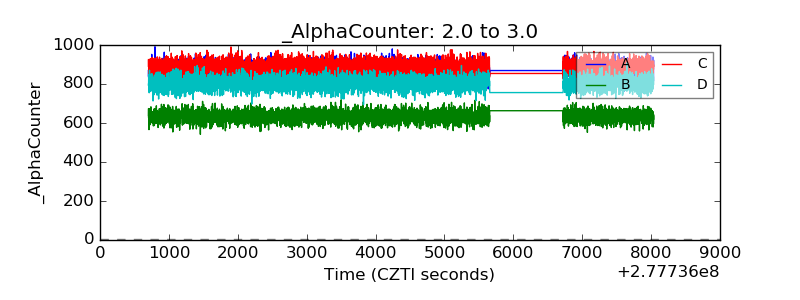 |
| _CPM_Rate | 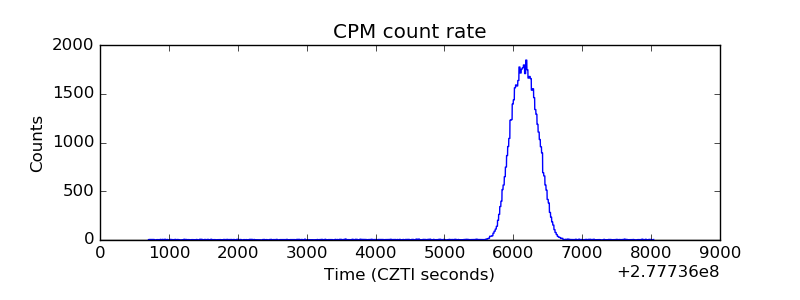 |
| CZT Counter | 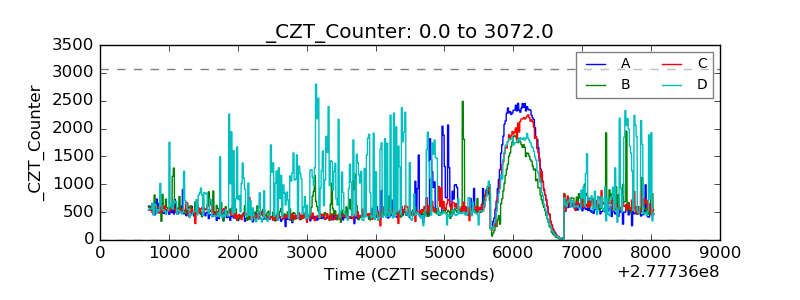 |
| +2.5 Volts monitor |  |
| +5 Volts monitor |  |
| _ROLL_ROT | 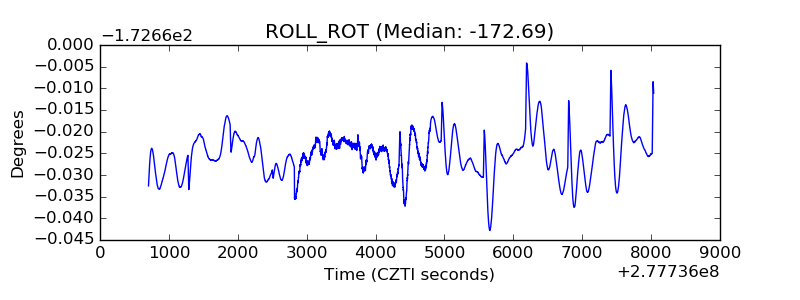 |
| _Roll_DEC | 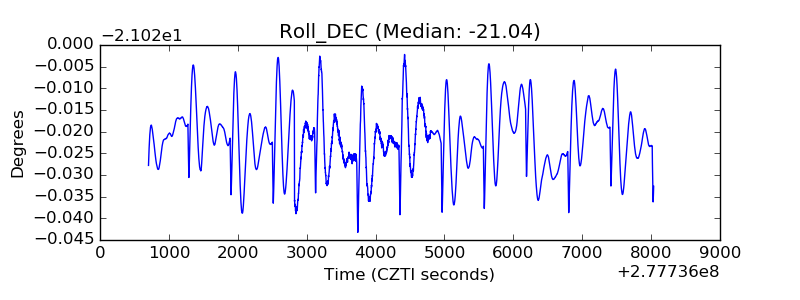 |
| _Roll_RA | 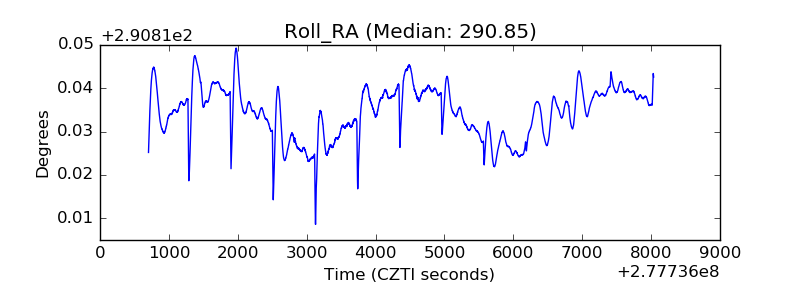 |
| Veto Counter |  |