| Param | Original file | Final file |
|---|---|---|
| Filename | modeM0/AS1T03_018T01_9000002442_16556cztM0_level2.evt | modeM0/AS1T03_018T01_9000002442_16556cztM0_level2_quad_clean.evt |
| Size (bytes) | 544,703,040 | 85,314,240 |
| Size | 519.5 MB | 81.4 MB |
| Events in quadrant A | 4,044,339 | 538,857 |
| Events in quadrant B | 3,751,071 | 568,119 |
| Events in quadrant C | 3,685,397 | 550,922 |
| Events in quadrant D | 4,589,295 | 486,940 |
| Mode M0 | |||
|---|---|---|---|
| Quadrant | BADHDUFLAG | Total packets | Discarded packets |
| A | 0 | 16163 | 3 |
| B | 0 | 15272 | 2 |
| C | 0 | 15180 | 2 |
| D | 0 | 17965 | 2 |
| Mode M9 | |||
|---|---|---|---|
| Quadrant | BADHDUFLAG | Total packets | Discarded packets |
| A | 0 | 11 | 0 |
| B | 0 | 11 | 0 |
| C | 0 | 11 | 0 |
| D | 0 | 11 | 0 |
| Mode SS | |||
|---|---|---|---|
| Quadrant | BADHDUFLAG | Total packets | Discarded packets |
| A | 0 | 128 | 0 |
| B | 0 | 128 | 0 |
| C | 0 | 128 | 0 |
| D | 0 | 128 | 0 |
| Quadrant | Total seconds | Saturated seconds | Saturation percentage |
|---|---|---|---|
| A | 6277 | 409 | 6.515852% |
| B | 6277 | 142 | 2.262227% |
| C | 6277 | 140 | 2.230365% |
| D | 6278 | 857 | 13.650844% |
Noise dominated data is calculated using 1-second bins in cleaned event files. If a bin has >2000 counts, and if more than 50% of those come from <1% of pixels, then it is considered to be noise-dominated and hence unusable.
| Quadrant | # 1 sec bins | Bins with >0 counts | Bins with >2000 counts | High rate bins dominated by noise | Noise dominated (total time) | Noise dominated (detector-on time) | Marked lightcurve |
|---|---|---|---|---|---|---|---|
| A | 7453 | 6279 | 349 | 349 | 4.68% | 5.56% | 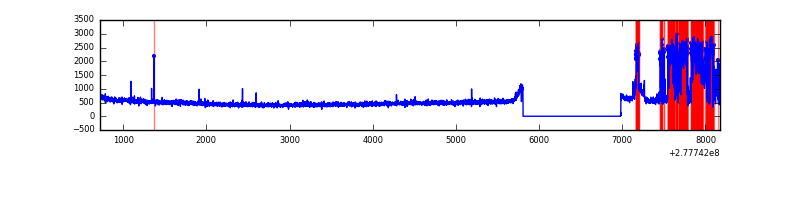 |
| B | 7453 | 6279 | 52 | 52 | 0.70% | 0.83% | 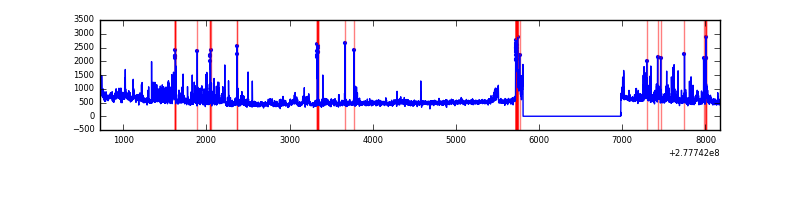 |
| C | 7453 | 6279 | 37 | 37 | 0.50% | 0.59% | 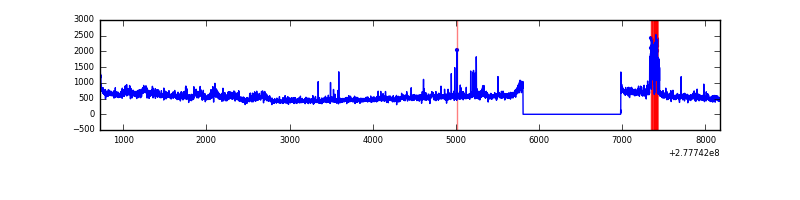 |
| D | 7454 | 6280 | 212 | 212 | 2.84% | 3.38% | 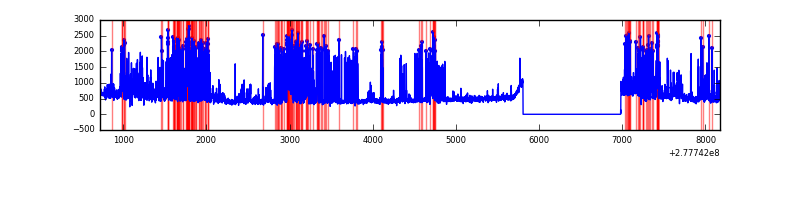 |
Top three noisy pixels from each quadrant. If the there are fewer than three noisy pixels in the level2.evt file, extra rows are filled as -1
| Pixel properties | Quadrant properties | ||||||
|---|---|---|---|---|---|---|---|
| Quadrant | DetID | PixID | Counts | Sigma | Mean | Median | Sigma |
| A | 15 | 174 | 1035220 | 6648.69 | 770 | 756 | 155.6 |
| A | 15 | 223 | 32523 | 204.17 | 770 | 756 | 155.6 |
| A | 15 | 239 | 9585 | 56.75 | 770 | 756 | 155.6 |
| B | 7 | 220 | 228739 | 1513.61 | 785 | 768 | 150.6 |
| B | 10 | 16 | 132579 | 875.16 | 785 | 768 | 150.6 |
| B | 15 | 35 | 104750 | 690.39 | 785 | 768 | 150.6 |
| C | 3 | 233 | 626115 | 3576.37 | 749 | 755 | 174.9 |
| C | 14 | 238 | 115340 | 655.3 | 749 | 755 | 174.9 |
| C | 7 | 247 | 16077 | 87.62 | 749 | 755 | 174.9 |
| D | 1 | 52 | 1254312 | 7209.0 | 705 | 684 | 173.9 |
| D | 5 | 222 | 305876 | 1755.01 | 705 | 684 | 173.9 |
| D | 7 | 38 | 249250 | 1429.38 | 705 | 684 | 173.9 |
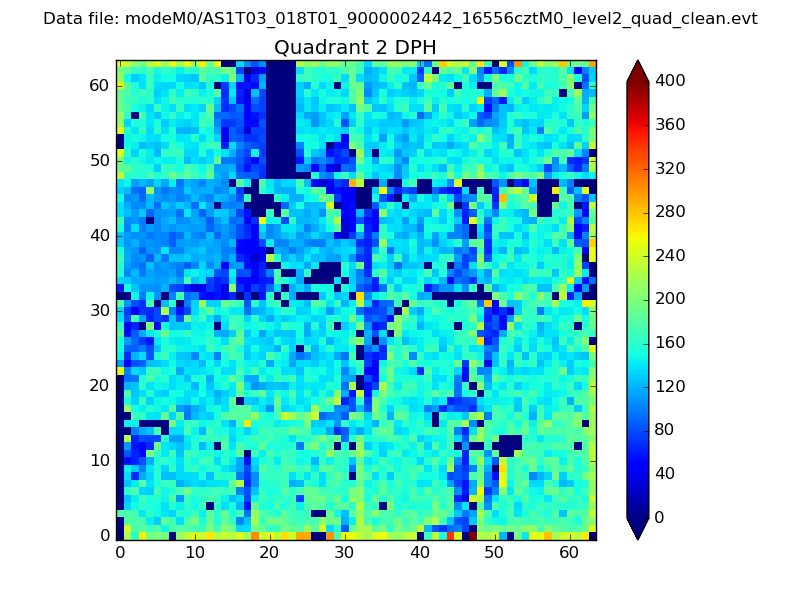
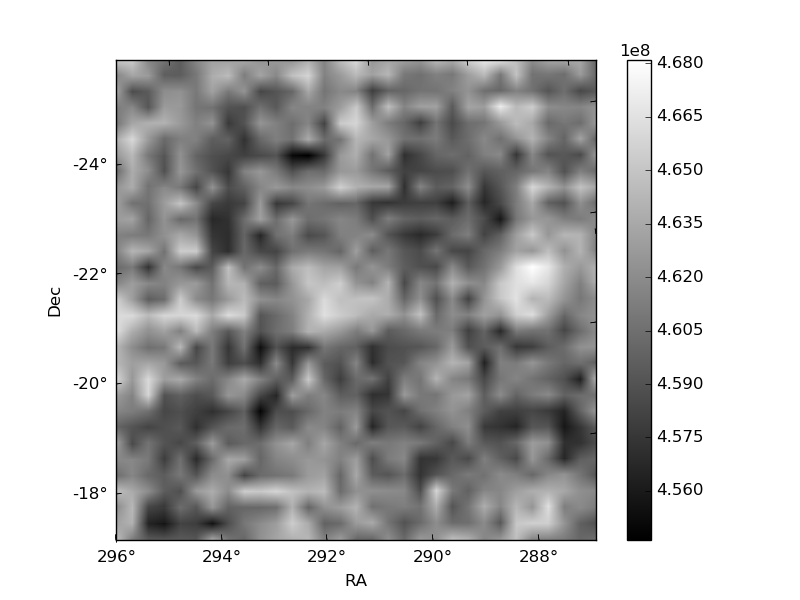
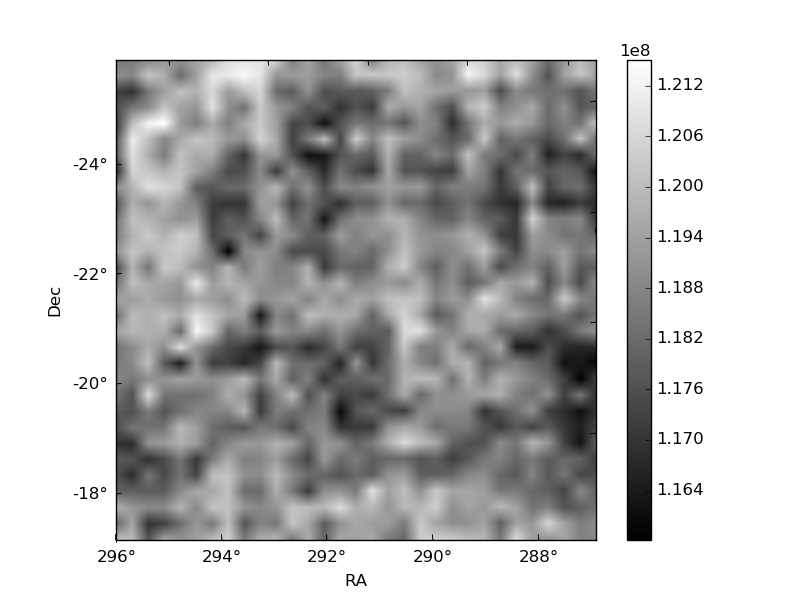
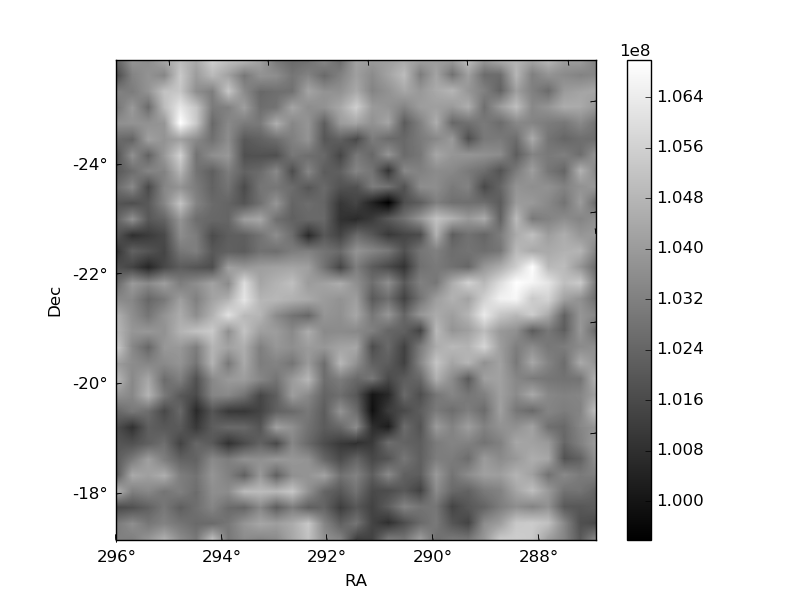
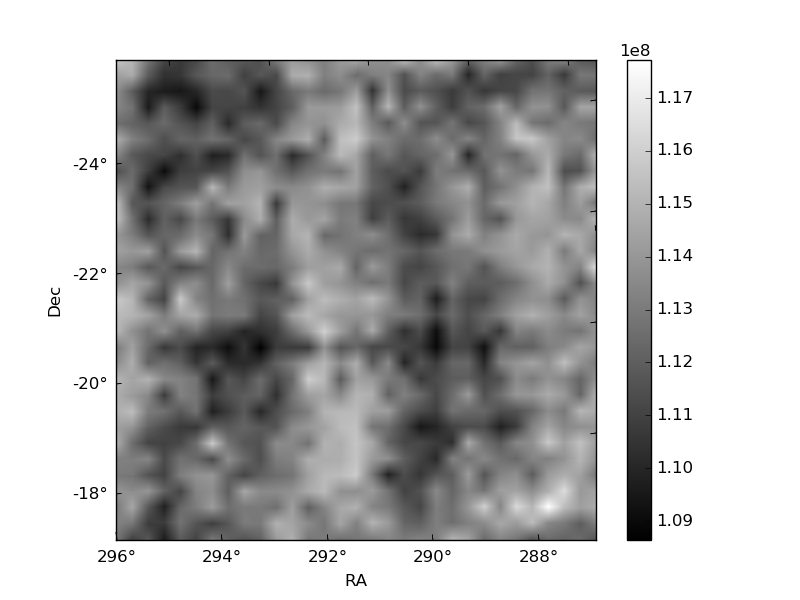
Histogram calculated using DETX and DETY for each event in the final _common_clean file
| Quadrant A | 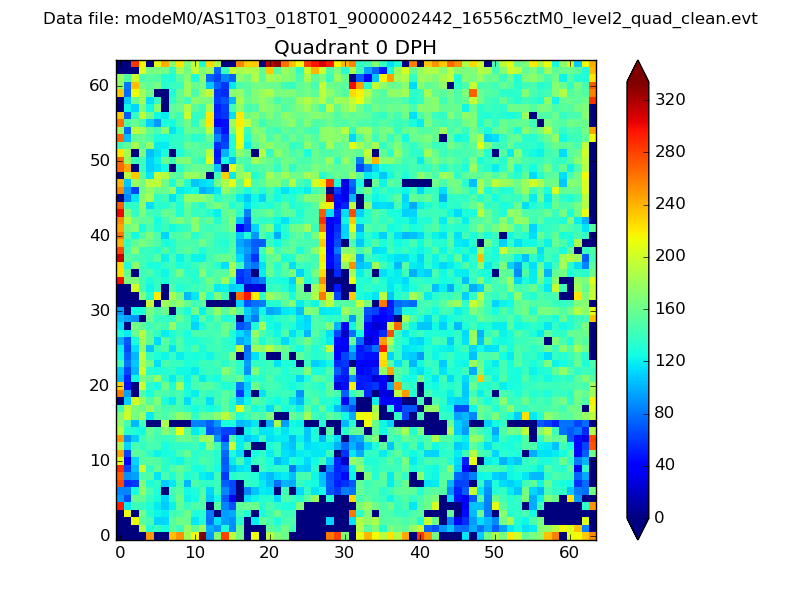 |
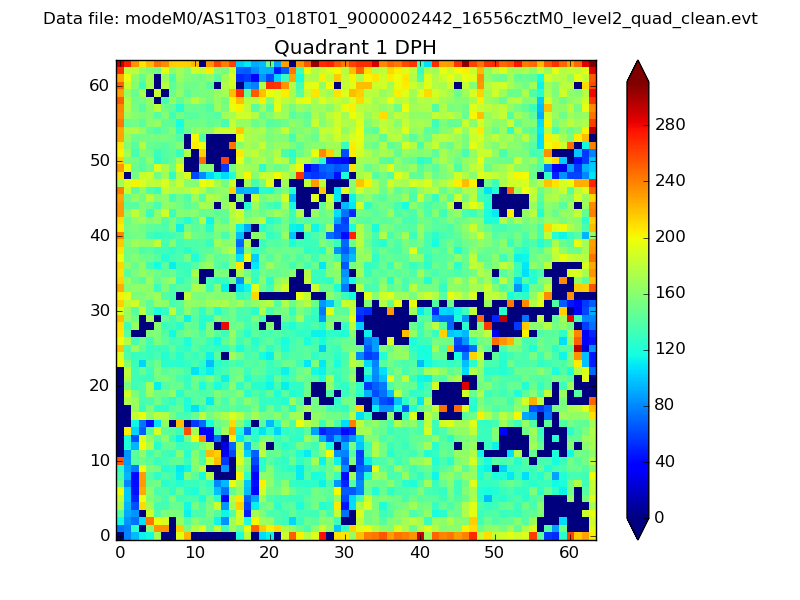 |
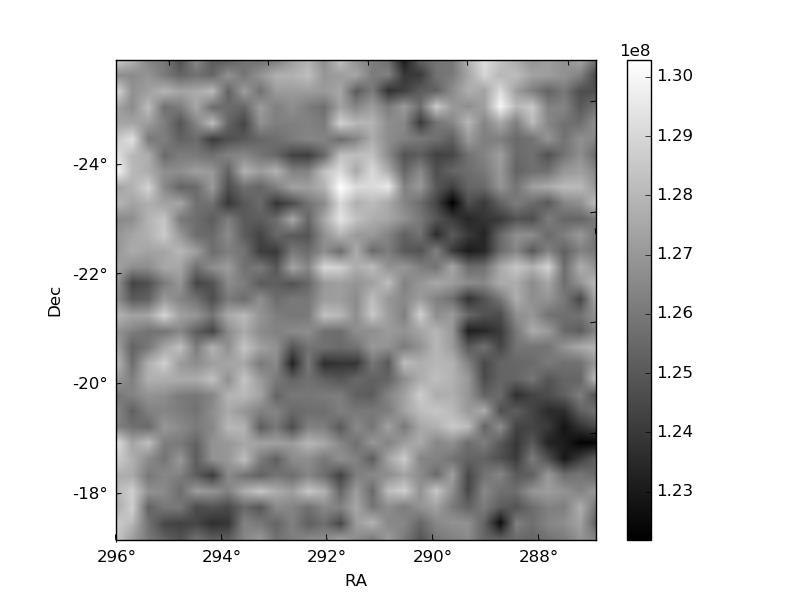
Quadrant B |
|---|---|---|---|
| Quadrant D | 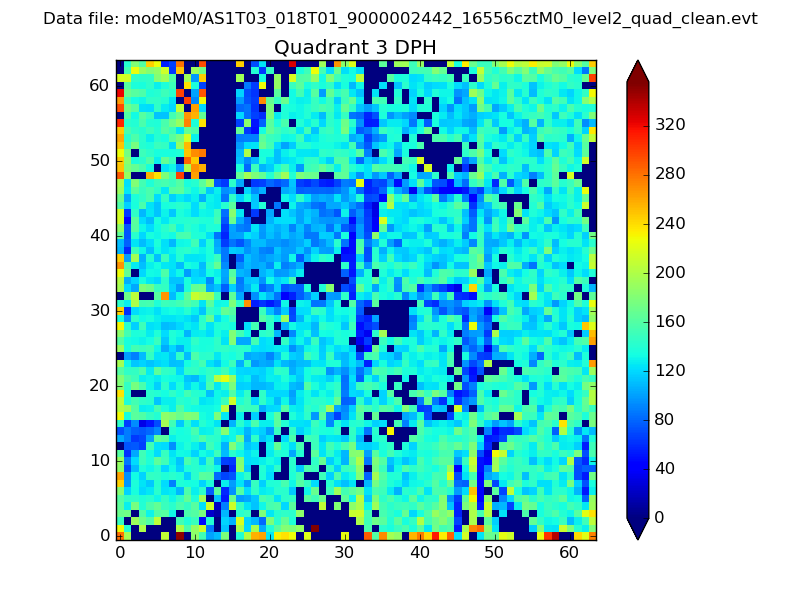 |
 |
Quadrant C |
| Plot type | Count rate plots | Images |
|---|---|---|
| Comparison with Poisson distribution Blue bars denote a histogram of data divided into 1 sec bins. Red curve is a Poisson curve with rate = median count rate of data. |
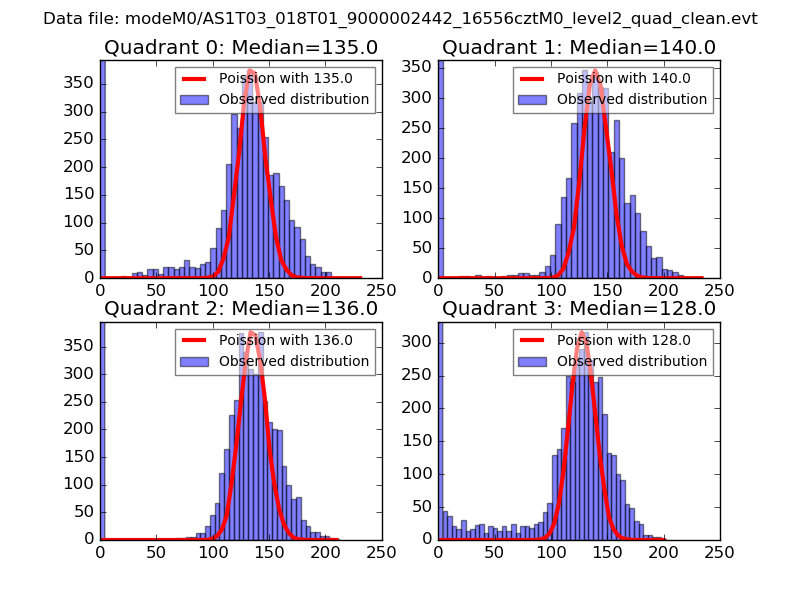 |
 |
| Quadrant-wise count rates Data is divided into 100 sec bins |
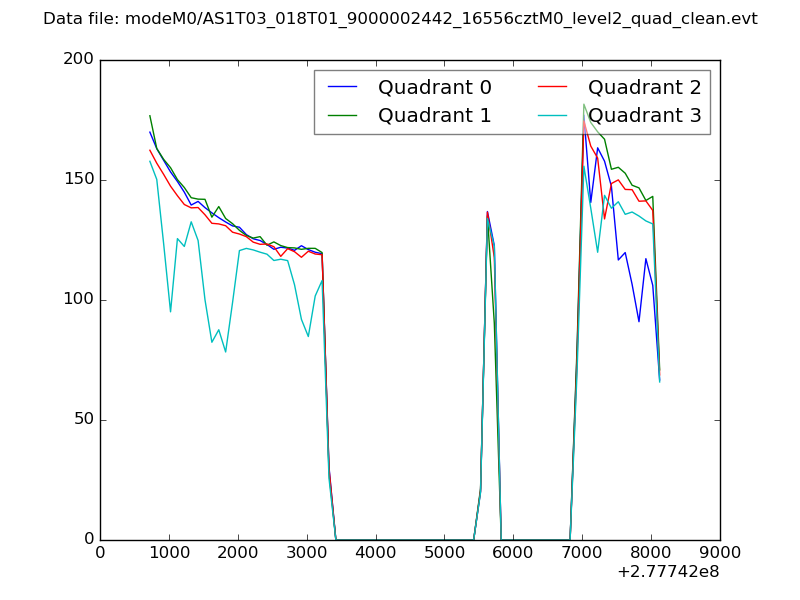 |
|
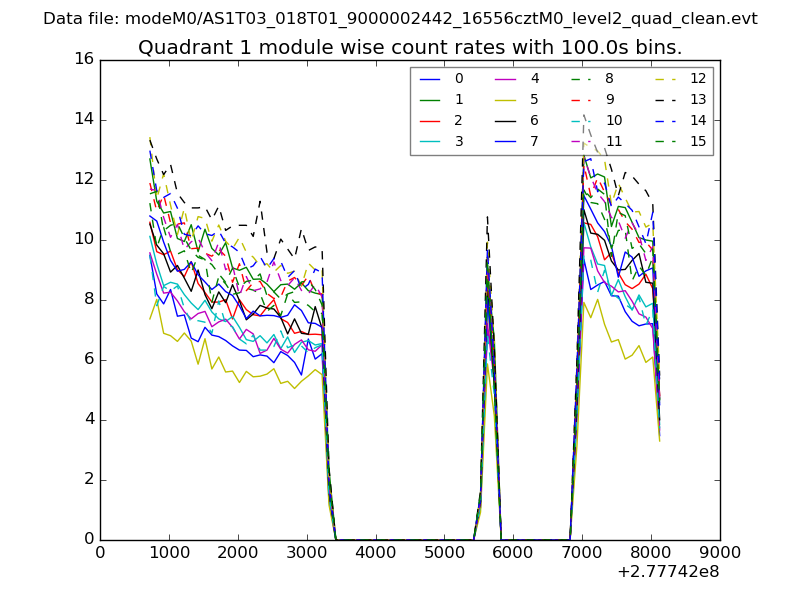
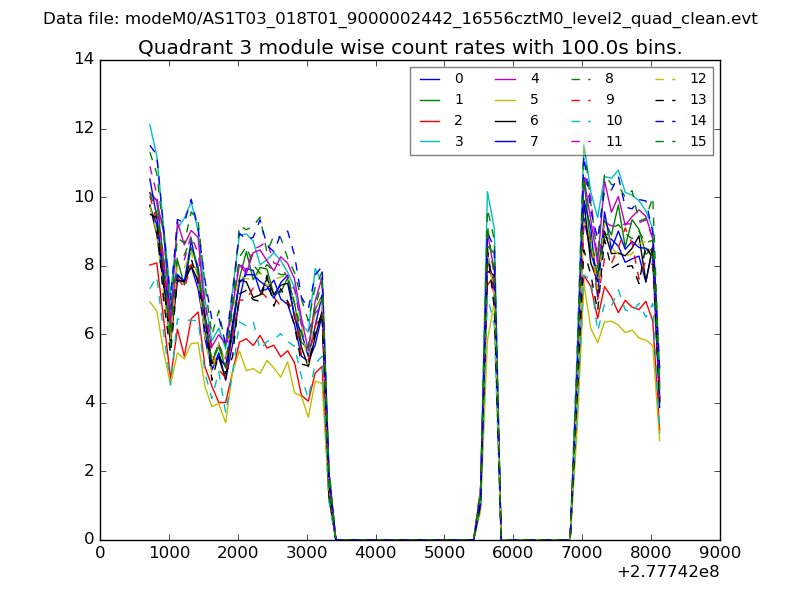
| Module-wise count rates for Quadrant A Data is divided into 100 sec bins |
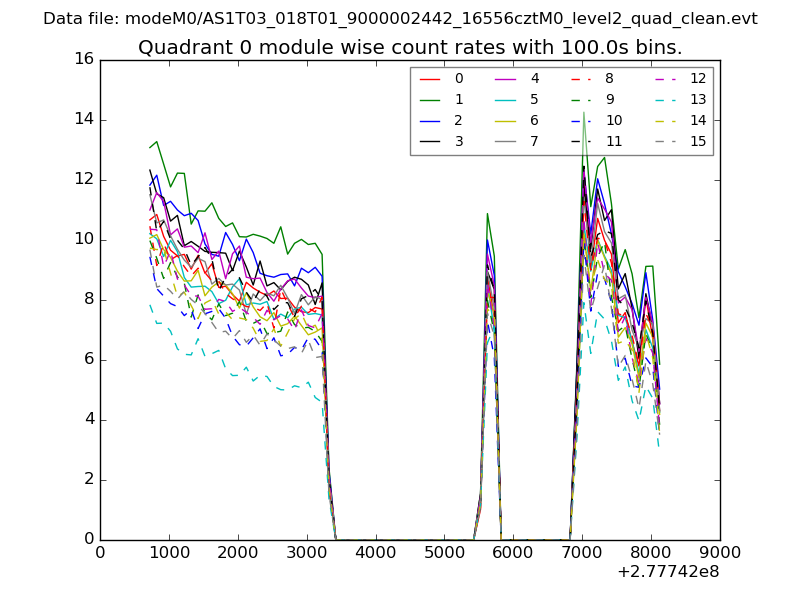 |
 |
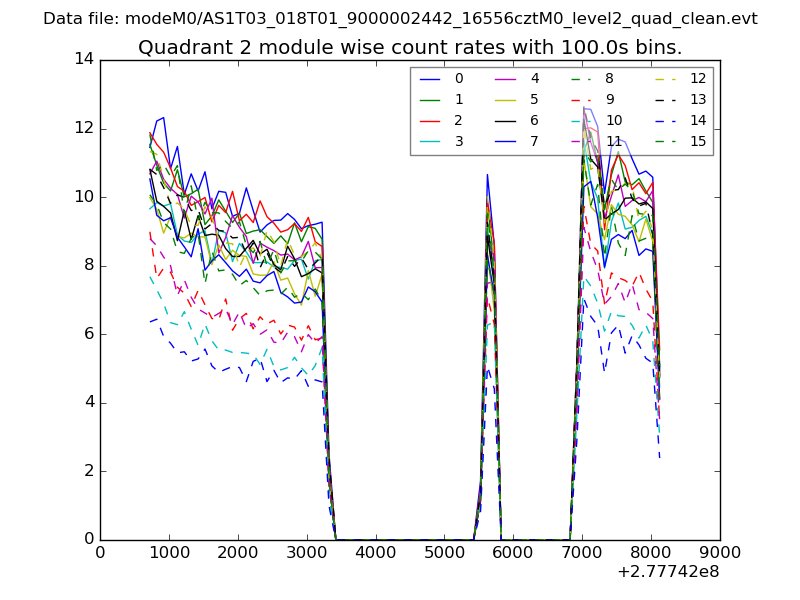
| Module-wise count rates for Quadrant B Data is divided into 100 sec bins |
 |
 |
| Module-wise count rates for Quadrant C Data is divided into 100 sec bins |
 |
 |
| Module-wise count rates for Quadrant D Data is divided into 100 sec bins |
 |
 |
| Parameter | Plot |
|---|---|
| CZT HV Monitor | 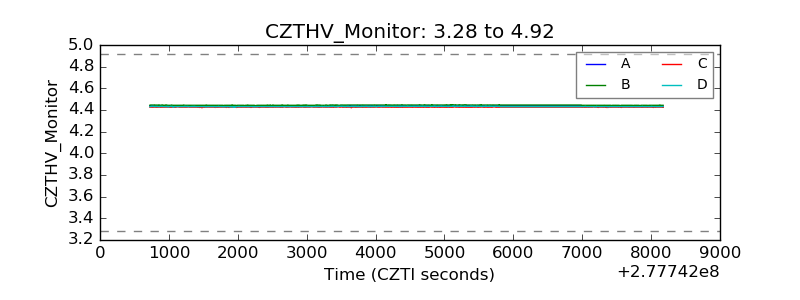 |
| D_VDD | 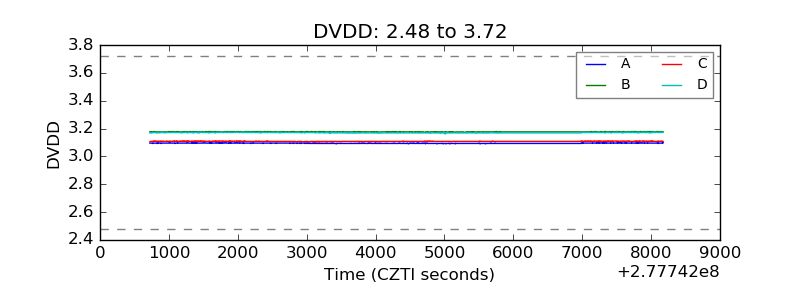 |
| Temperature 1 | 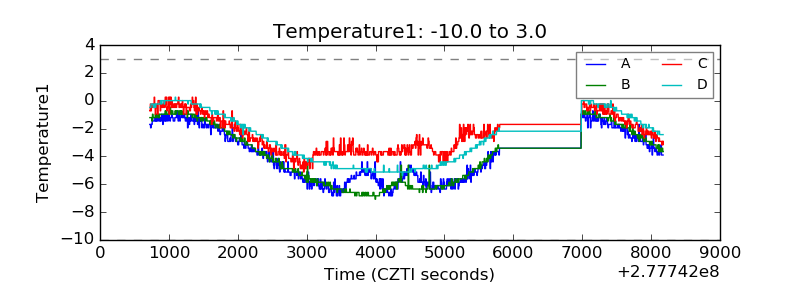 |
| Veto HV Monitor | 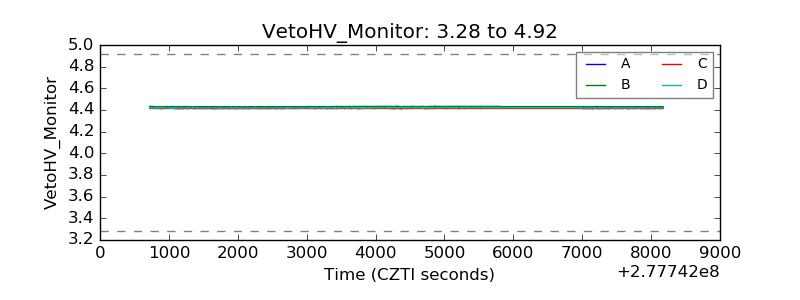 |
| Veto LLD |  |
| Alpha Counter | 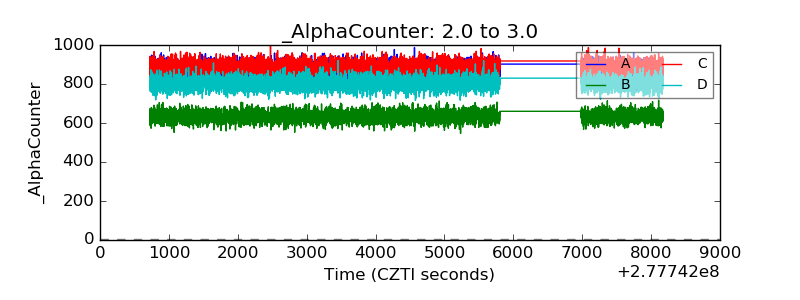 |
| _CPM_Rate | 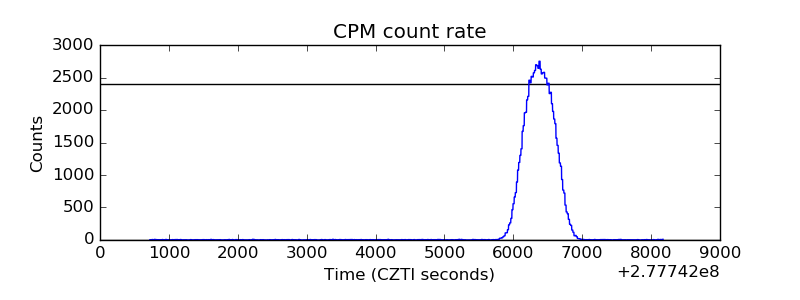 |
| CZT Counter | 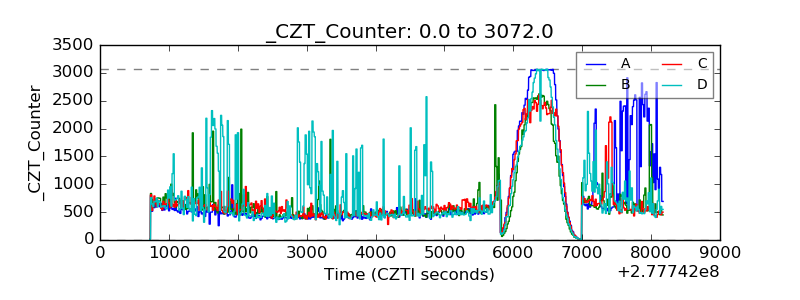 |
| +2.5 Volts monitor |  |
| +5 Volts monitor |  |
| _ROLL_ROT |  |
| _Roll_DEC | 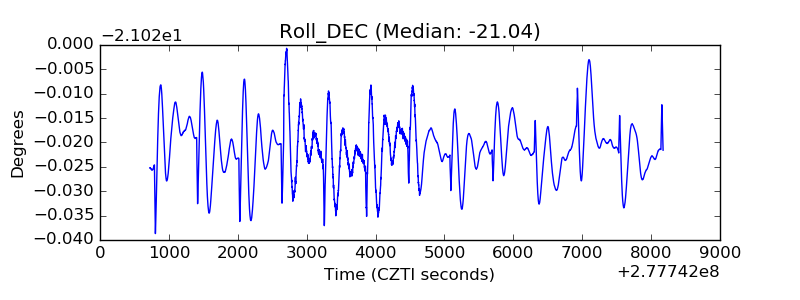 |
| _Roll_RA | 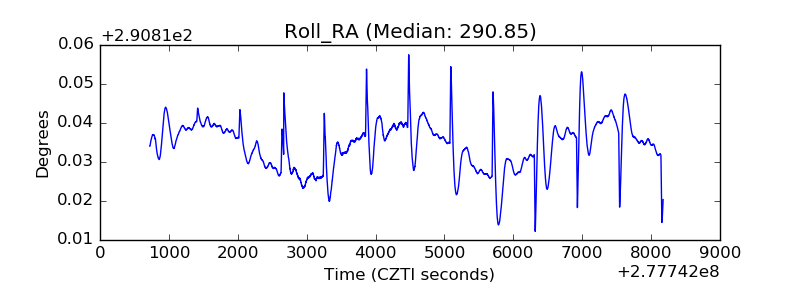 |
| Veto Counter |  |