| Param | Original file | Final file |
|---|---|---|
| Filename | modeM0/AS1T03_018T01_9000002442_16557cztM0_level2.evt | modeM0/AS1T03_018T01_9000002442_16557cztM0_level2_quad_clean.evt |
| Size (bytes) | 528,808,320 | 89,009,280 |
| Size | 504.3 MB | 84.9 MB |
| Events in quadrant A | 4,698,012 | 555,256 |
| Events in quadrant B | 3,529,978 | 597,888 |
| Events in quadrant C | 3,452,852 | 572,611 |
| Events in quadrant D | 3,913,742 | 536,607 |
| Mode M0 | |||
|---|---|---|---|
| Quadrant | BADHDUFLAG | Total packets | Discarded packets |
| A | 0 | 18173 | 3 |
| B | 0 | 14450 | 2 |
| C | 0 | 14172 | 2 |
| D | 0 | 15881 | 2 |
| Mode M9 | |||
|---|---|---|---|
| Quadrant | BADHDUFLAG | Total packets | Discarded packets |
| A | 0 | 15 | 0 |
| B | 0 | 15 | 0 |
| C | 0 | 15 | 0 |
| D | 0 | 16 | 0 |
| Mode SS | |||
|---|---|---|---|
| Quadrant | BADHDUFLAG | Total packets | Discarded packets |
| A | 0 | 126 | 0 |
| B | 0 | 126 | 0 |
| C | 0 | 126 | 0 |
| D | 0 | 126 | 0 |
| Quadrant | Total seconds | Saturated seconds | Saturation percentage |
|---|---|---|---|
| A | 6201 | 507 | 8.176101% |
| B | 6201 | 90 | 1.451379% |
| C | 6201 | 127 | 2.048057% |
| D | 6201 | 178 | 2.870505% |
Noise dominated data is calculated using 1-second bins in cleaned event files. If a bin has >2000 counts, and if more than 50% of those come from <1% of pixels, then it is considered to be noise-dominated and hence unusable.
| Quadrant | # 1 sec bins | Bins with >0 counts | Bins with >2000 counts | High rate bins dominated by noise | Noise dominated (total time) | Noise dominated (detector-on time) | Marked lightcurve |
|---|---|---|---|---|---|---|---|
| A | 7472 | 6203 | 420 | 420 | 5.62% | 6.77% | 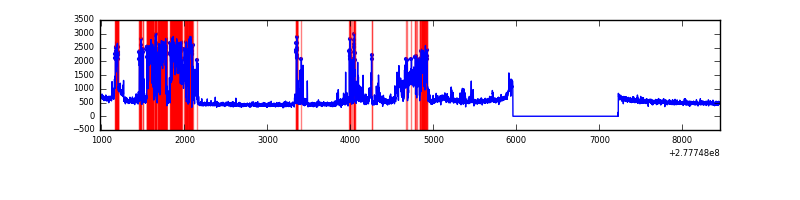 |
| B | 7472 | 6203 | 23 | 23 | 0.31% | 0.37% | 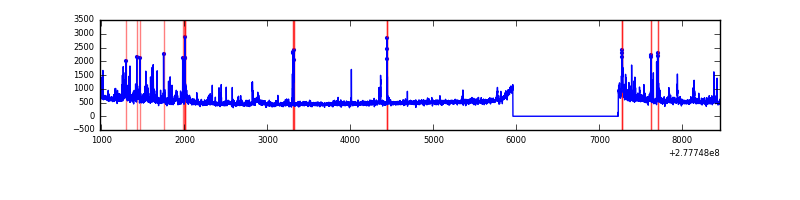 |
| C | 7472 | 6203 | 36 | 36 | 0.48% | 0.58% | 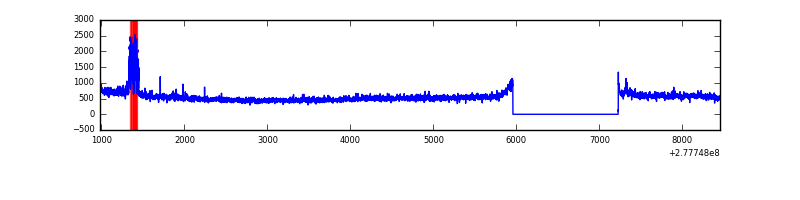 |
| D | 7472 | 6203 | 120 | 120 | 1.61% | 1.93% | 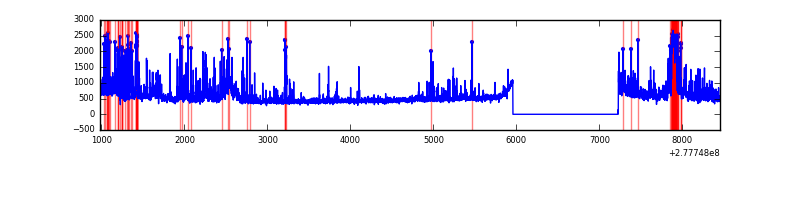 |
Top three noisy pixels from each quadrant. If the there are fewer than three noisy pixels in the level2.evt file, extra rows are filled as -1
| Pixel properties | Quadrant properties | ||||||
|---|---|---|---|---|---|---|---|
| Quadrant | DetID | PixID | Counts | Sigma | Mean | Median | Sigma |
| A | 15 | 174 | 1705670 | 11031.64 | 769 | 757 | 154.5 |
| A | 15 | 223 | 18277 | 113.36 | 769 | 757 | 154.5 |
| A | 9 | 143 | 10840 | 65.24 | 769 | 757 | 154.5 |
| B | 7 | 220 | 155382 | 1023.37 | 799 | 782 | 151.1 |
| B | 15 | 35 | 92026 | 603.99 | 799 | 782 | 151.1 |
| B | 5 | 172 | 37144 | 240.7 | 799 | 782 | 151.1 |
| C | 3 | 233 | 343994 | 1933.5 | 758 | 764 | 177.5 |
| C | 14 | 238 | 118601 | 663.8 | 758 | 764 | 177.5 |
| C | 7 | 247 | 30862 | 169.55 | 758 | 764 | 177.5 |
| D | 5 | 222 | 497908 | 2713.88 | 750 | 729 | 183.2 |
| D | 7 | 38 | 481679 | 2625.3 | 750 | 729 | 183.2 |
| D | 1 | 52 | 66270 | 357.76 | 750 | 729 | 183.2 |
Histogram calculated using DETX and DETY for each event in the final _common_clean file
| Quadrant A |  |
 |
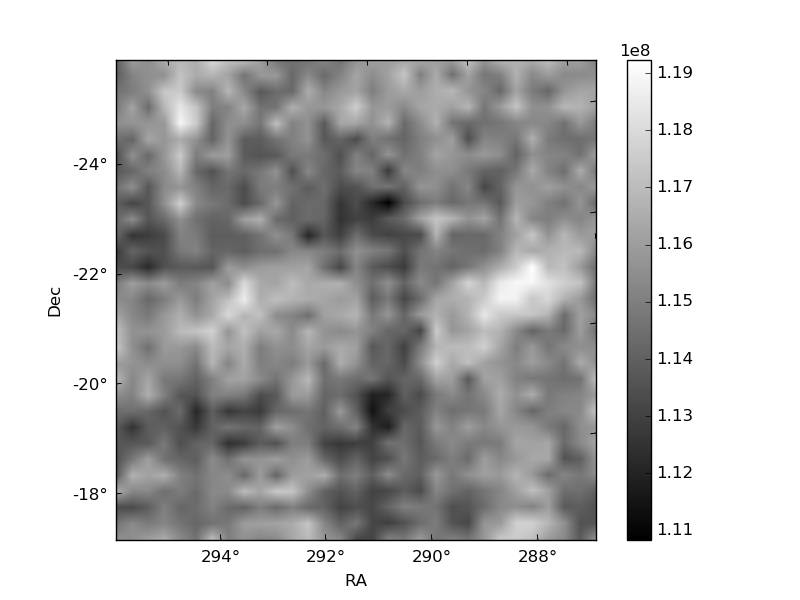
Quadrant B |
|---|---|---|---|
| Quadrant D |  |
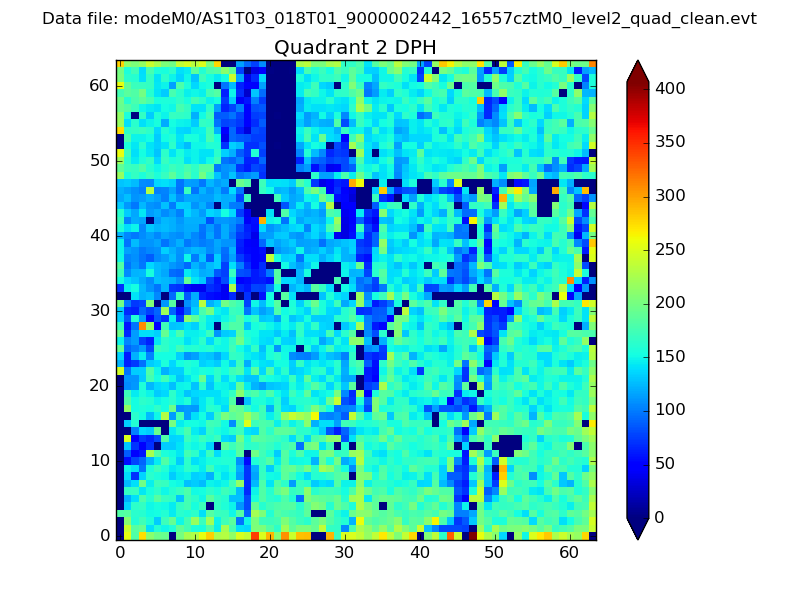 |
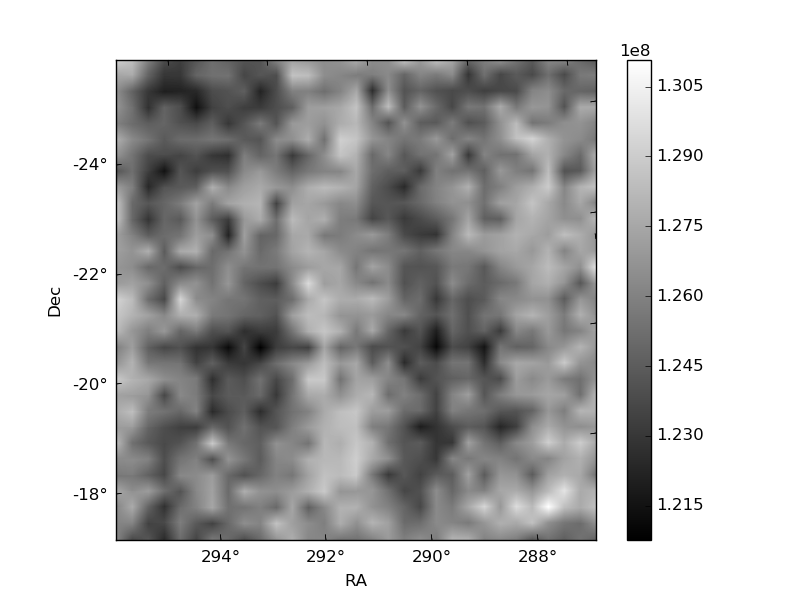
Quadrant C |
| Plot type | Count rate plots | Images |
|---|---|---|
| Comparison with Poisson distribution Blue bars denote a histogram of data divided into 1 sec bins. Red curve is a Poisson curve with rate = median count rate of data. |
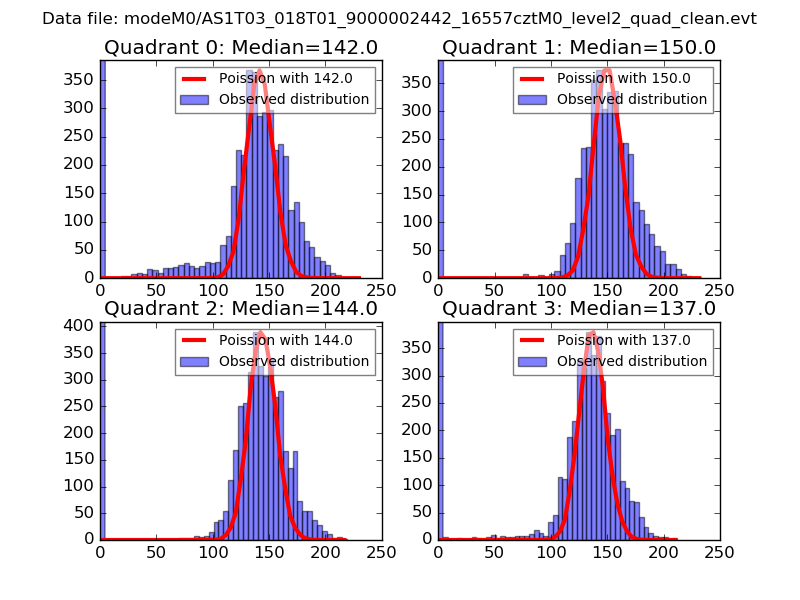 |
 |
| Quadrant-wise count rates Data is divided into 100 sec bins |
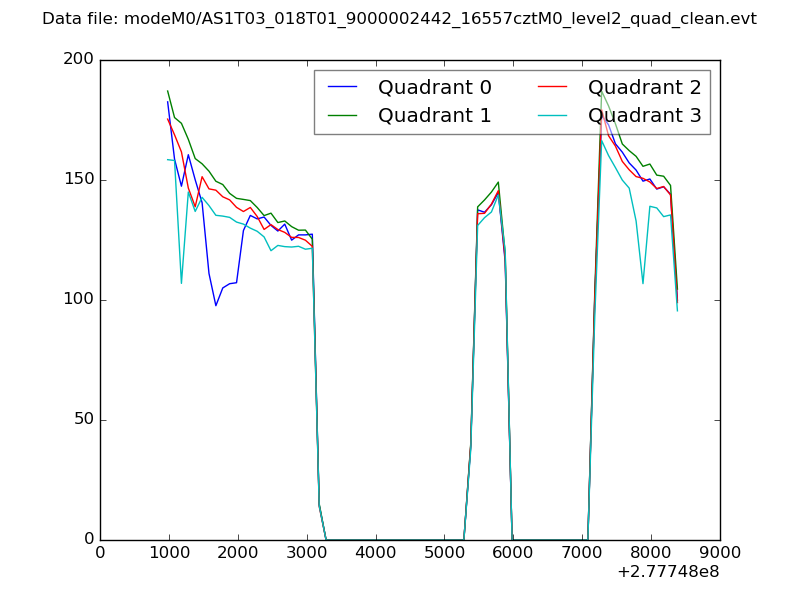 |
|
| Module-wise count rates for Quadrant A Data is divided into 100 sec bins |
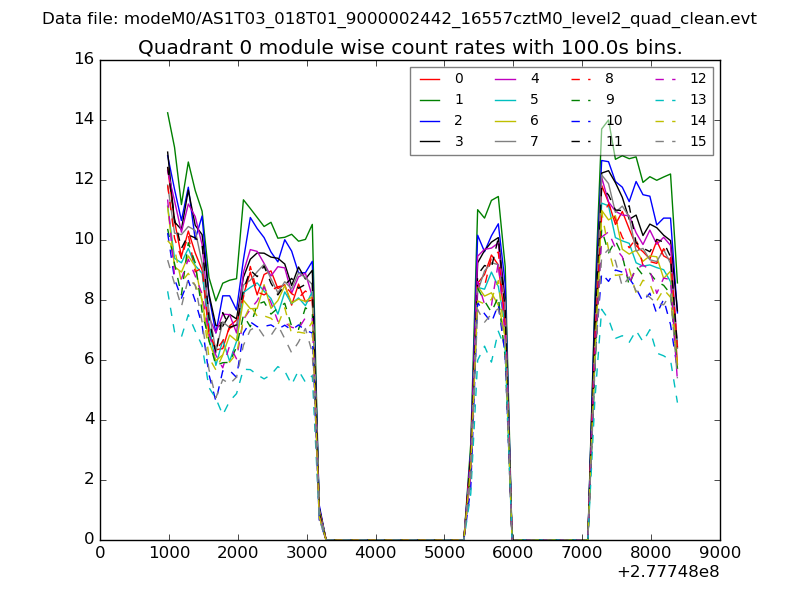 |
 |
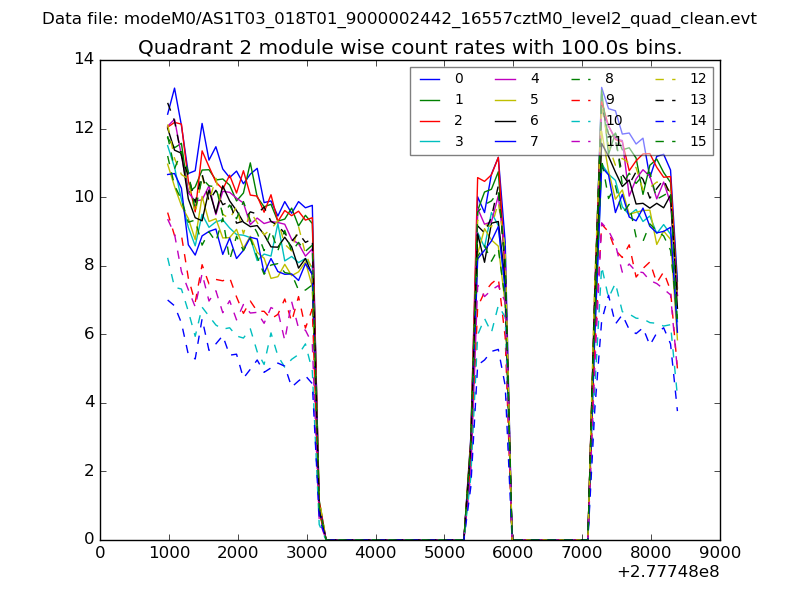
| Module-wise count rates for Quadrant B Data is divided into 100 sec bins |
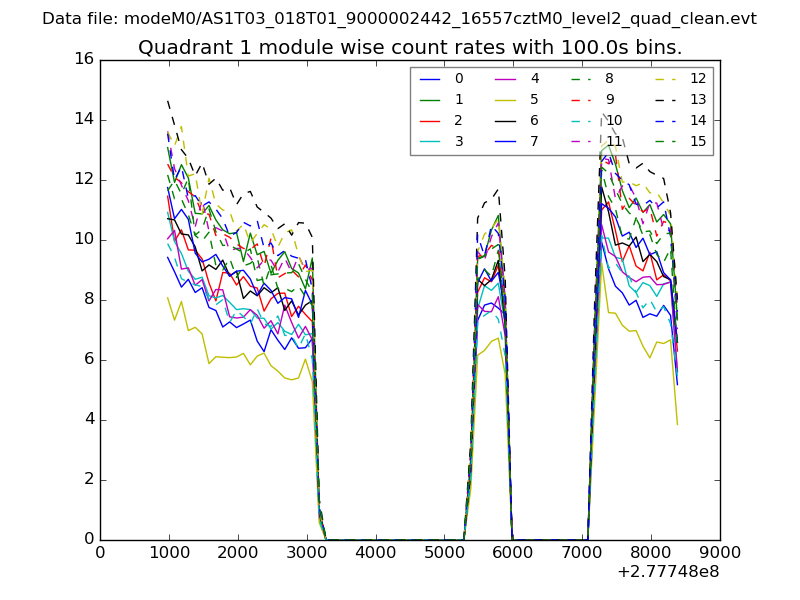 |
 |
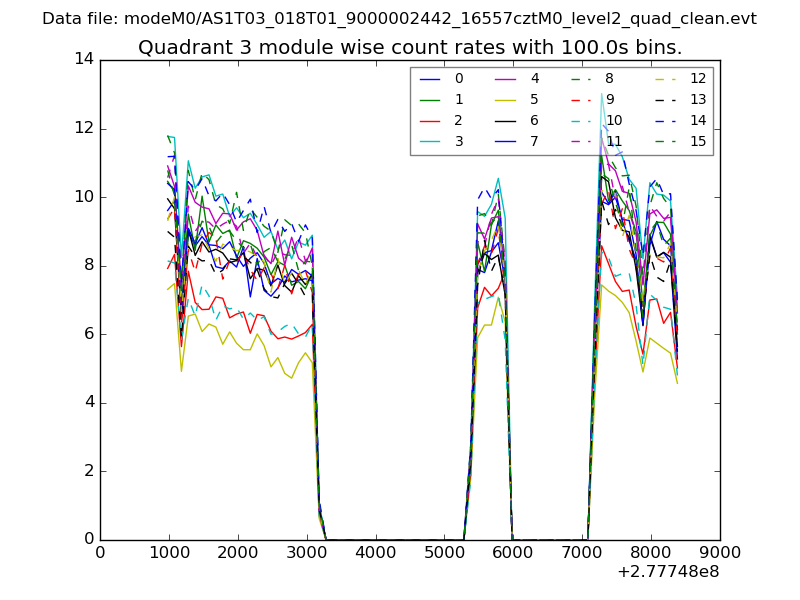
| Module-wise count rates for Quadrant C Data is divided into 100 sec bins |
 |
 |
| Module-wise count rates for Quadrant D Data is divided into 100 sec bins |
 |
 |
| Parameter | Plot |
|---|---|
| CZT HV Monitor | 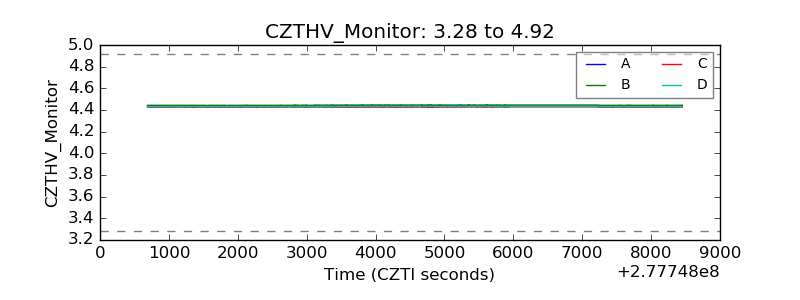 |
| D_VDD | 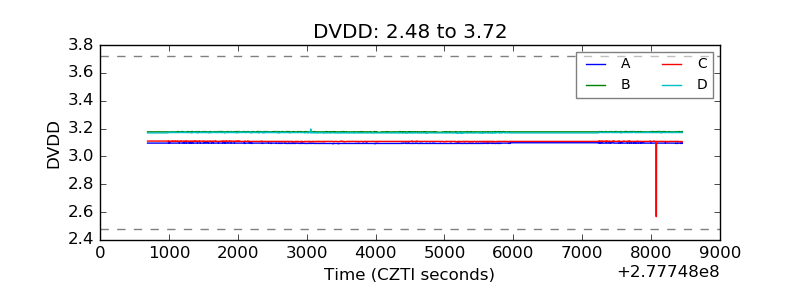 |
| Temperature 1 | 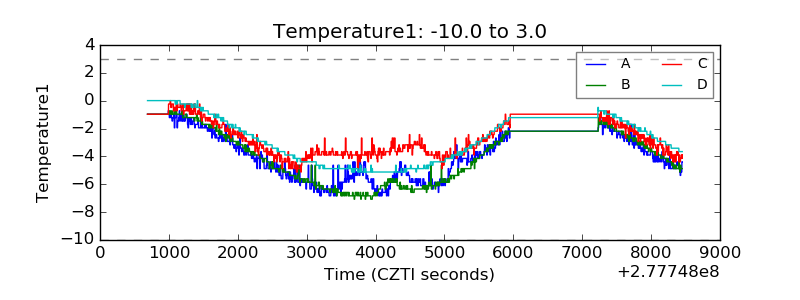 |
| Veto HV Monitor | 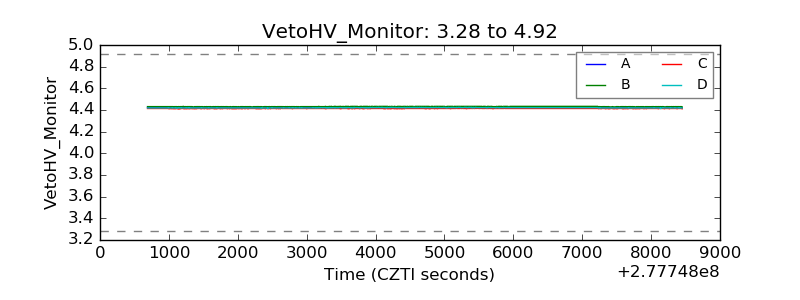 |
| Veto LLD | 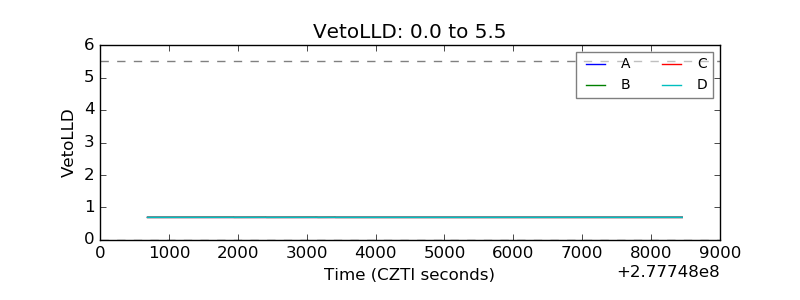 |
| Alpha Counter | 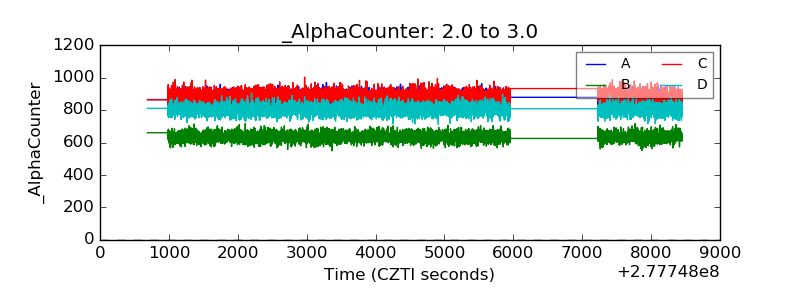 |
| _CPM_Rate | 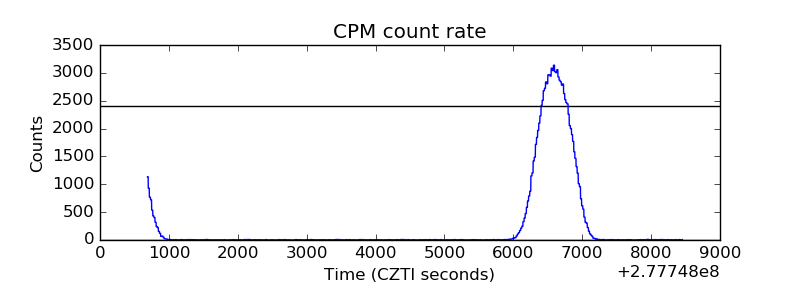 |
| CZT Counter | 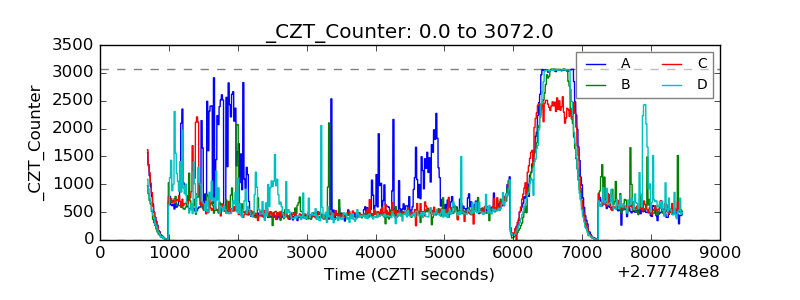 |
| +2.5 Volts monitor |  |
| +5 Volts monitor | 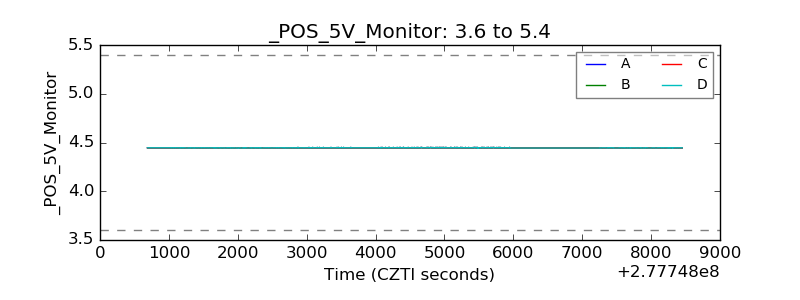 |
| _ROLL_ROT | 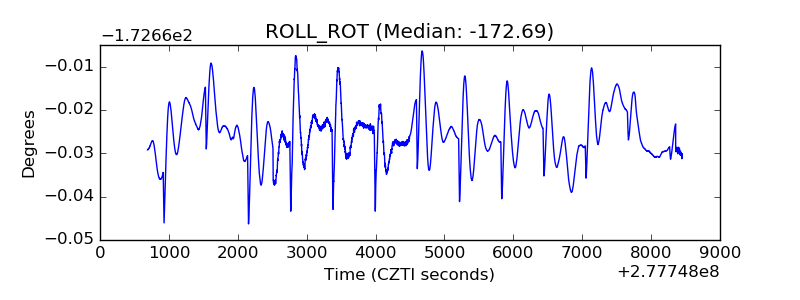 |
| _Roll_DEC | 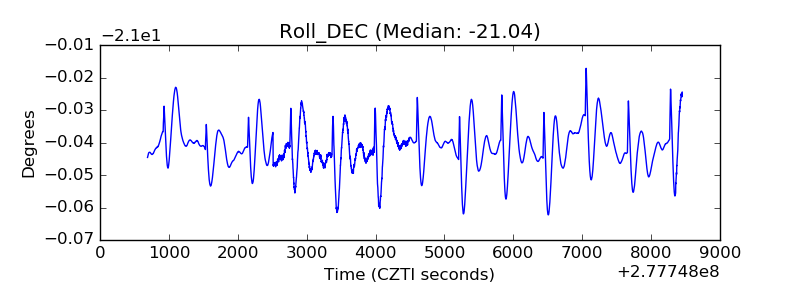 |
| _Roll_RA | 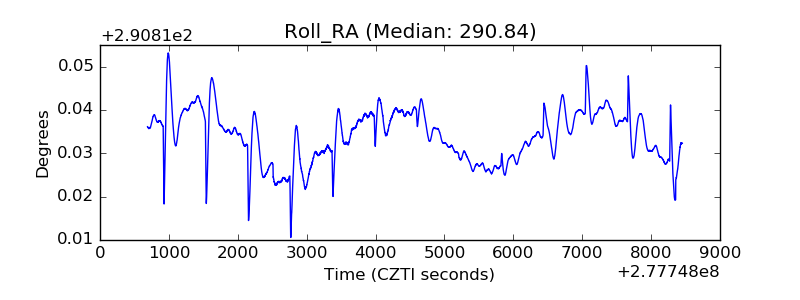 |
| Veto Counter | 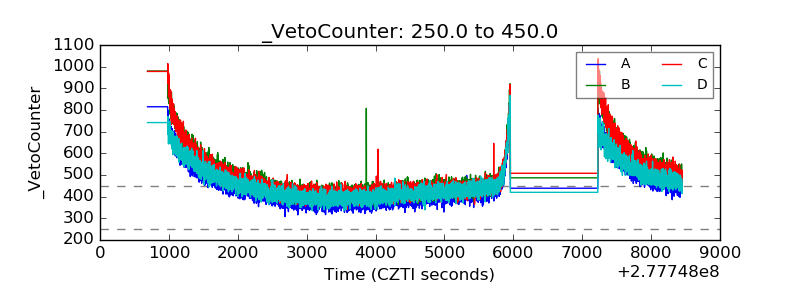 |