| Param | Original file | Final file |
|---|---|---|
| Filename | modeM0/AS1T03_018T01_9000002442_16558cztM0_level2.evt | modeM0/AS1T03_018T01_9000002442_16558cztM0_level2_quad_clean.evt |
| Size (bytes) | 497,954,880 | 89,631,360 |
| Size | 474.9 MB | 85.5 MB |
| Events in quadrant A | 3,079,823 | 586,120 |
| Events in quadrant B | 3,742,137 | 607,231 |
| Events in quadrant C | 3,781,905 | 578,881 |
| Events in quadrant D | 4,057,828 | 511,130 |
| Mode M0 | |||
|---|---|---|---|
| Quadrant | BADHDUFLAG | Total packets | Discarded packets |
| A | 0 | 12957 | 3 |
| B | 0 | 14902 | 2 |
| C | 0 | 15360 | 2 |
| D | 0 | 16193 | 2 |
| Mode M9 | |||
|---|---|---|---|
| Quadrant | BADHDUFLAG | Total packets | Discarded packets |
| A | 0 | 19 | 0 |
| B | 0 | 19 | 0 |
| C | 0 | 19 | 0 |
| D | 0 | 20 | 0 |
| Mode SS | |||
|---|---|---|---|
| Quadrant | BADHDUFLAG | Total packets | Discarded packets |
| A | 0 | 126 | 0 |
| B | 0 | 126 | 0 |
| C | 0 | 126 | 0 |
| D | 0 | 126 | 0 |
| Quadrant | Total seconds | Saturated seconds | Saturation percentage |
|---|---|---|---|
| A | 6170 | 37 | 0.599676% |
| B | 6170 | 157 | 2.544571% |
| C | 6170 | 135 | 2.188006% |
| D | 6170 | 464 | 7.520259% |
Noise dominated data is calculated using 1-second bins in cleaned event files. If a bin has >2000 counts, and if more than 50% of those come from <1% of pixels, then it is considered to be noise-dominated and hence unusable.
| Quadrant | # 1 sec bins | Bins with >0 counts | Bins with >2000 counts | High rate bins dominated by noise | Noise dominated (total time) | Noise dominated (detector-on time) | Marked lightcurve |
|---|---|---|---|---|---|---|---|
| A | 7506 | 6172 | 2 | 2 | 0.03% | 0.03% | 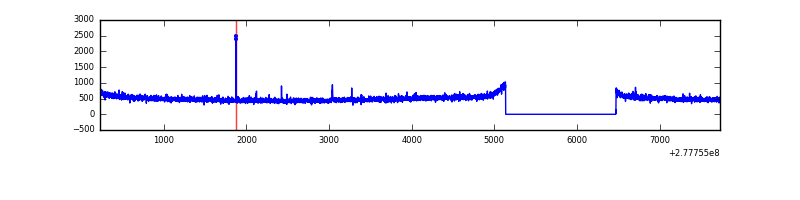 |
| B | 7506 | 6172 | 99 | 99 | 1.32% | 1.60% | 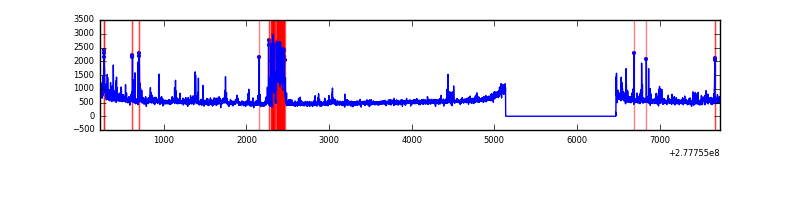 |
| C | 7506 | 6172 | 7 | 7 | 0.09% | 0.11% | 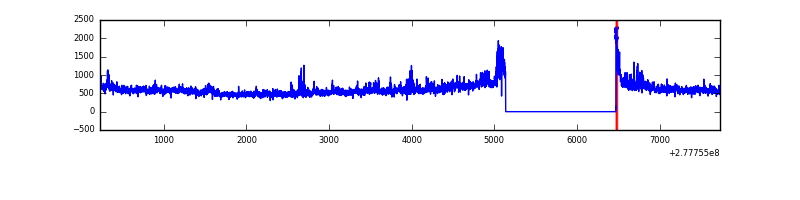 |
| D | 7506 | 6172 | 158 | 158 | 2.10% | 2.56% | 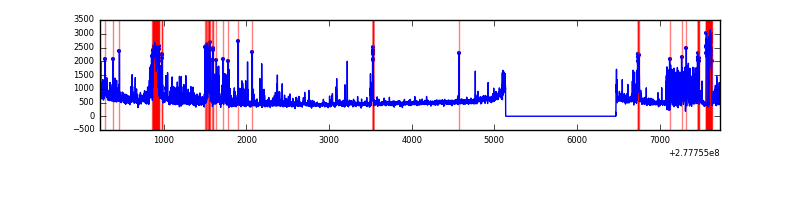 |
Top three noisy pixels from each quadrant. If the there are fewer than three noisy pixels in the level2.evt file, extra rows are filled as -1
| Pixel properties | Quadrant properties | ||||||
|---|---|---|---|---|---|---|---|
| Quadrant | DetID | PixID | Counts | Sigma | Mean | Median | Sigma |
| A | 15 | 174 | 14118 | 83.34 | 793 | 779 | 160.1 |
| A | 15 | 223 | 10423 | 60.26 | 793 | 779 | 160.1 |
| A | 0 | 226 | 7141 | 39.75 | 793 | 779 | 160.1 |
| B | 10 | 16 | 255870 | 1683.67 | 804 | 786 | 151.5 |
| B | 15 | 35 | 107019 | 701.19 | 804 | 786 | 151.5 |
| B | 7 | 220 | 64434 | 420.11 | 804 | 786 | 151.5 |
| C | 3 | 233 | 456012 | 2575.38 | 762 | 771 | 176.8 |
| C | 7 | 247 | 232908 | 1313.24 | 762 | 771 | 176.8 |
| C | 14 | 238 | 120310 | 676.25 | 762 | 771 | 176.8 |
| D | 5 | 222 | 522266 | 2919.55 | 727 | 703 | 178.6 |
| D | 7 | 38 | 299002 | 1669.79 | 727 | 703 | 178.6 |
| D | 1 | 52 | 292302 | 1632.28 | 727 | 703 | 178.6 |
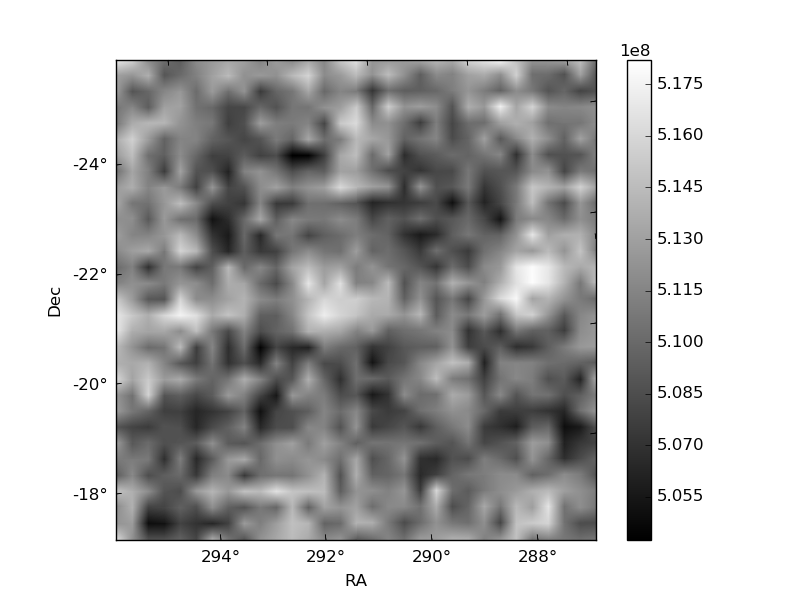
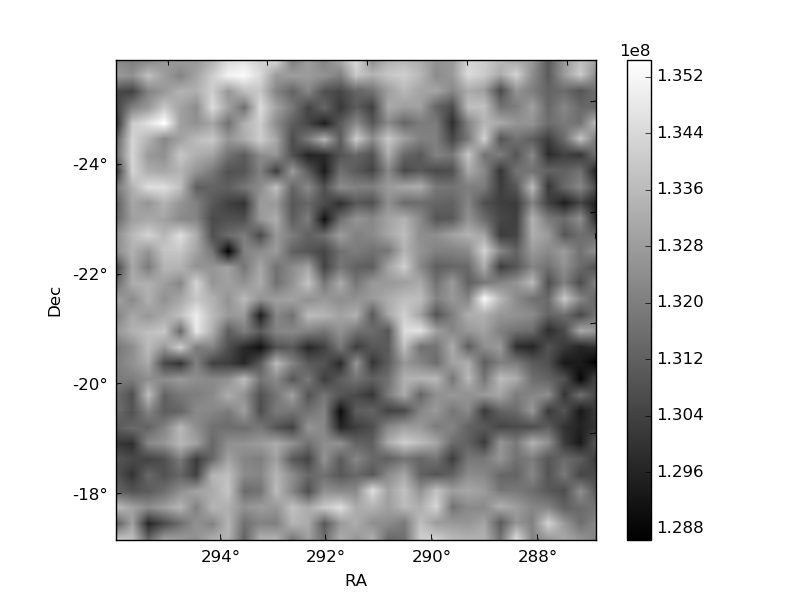
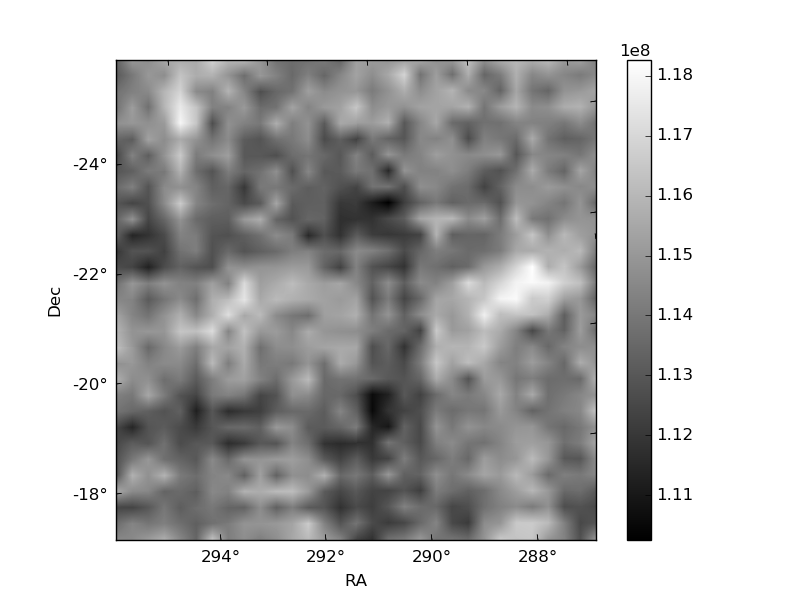
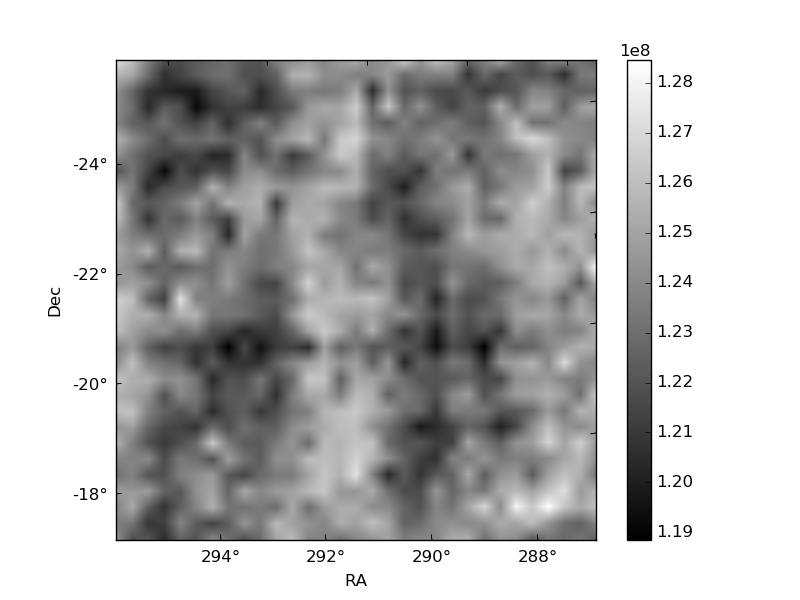
Histogram calculated using DETX and DETY for each event in the final _common_clean file
| Quadrant A | 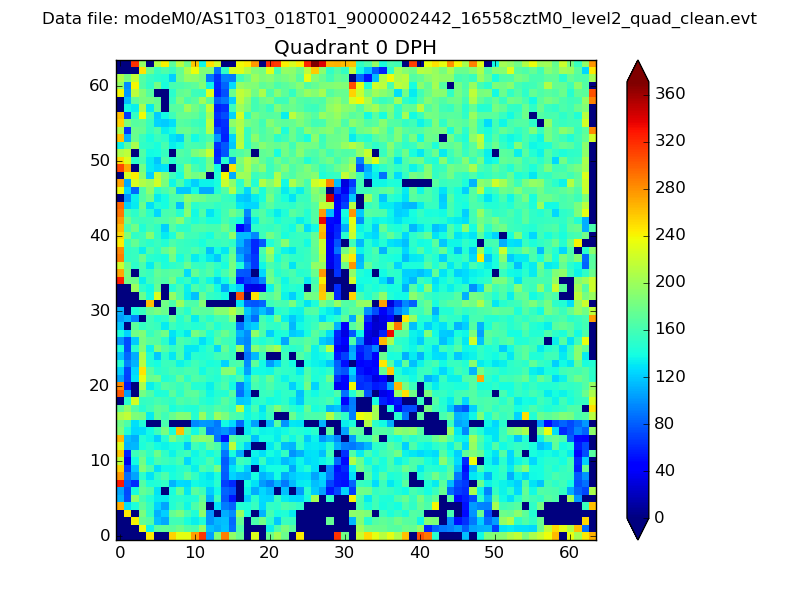 |
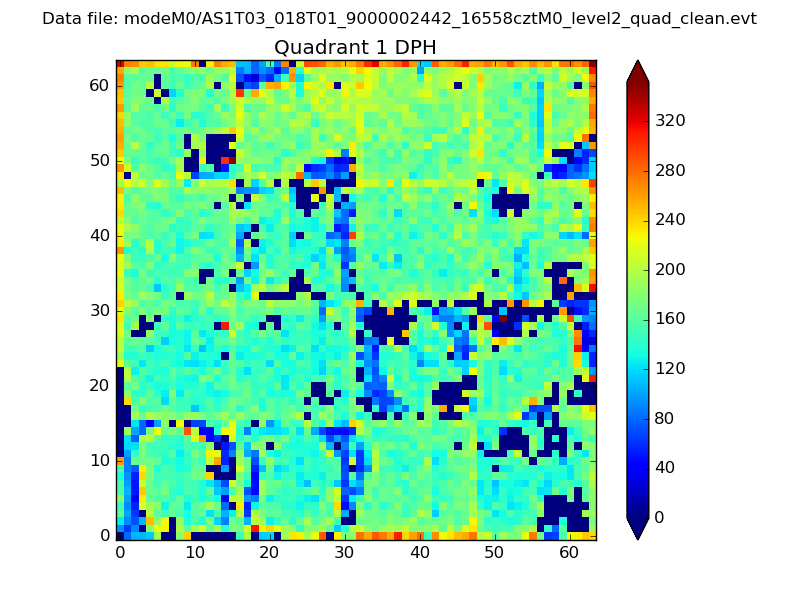 |
Quadrant B |
|---|---|---|---|
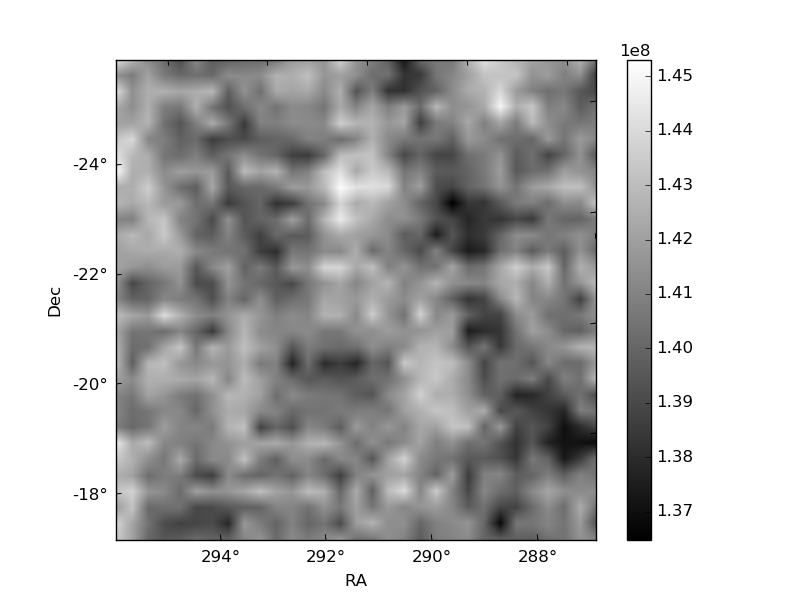
| Quadrant D | 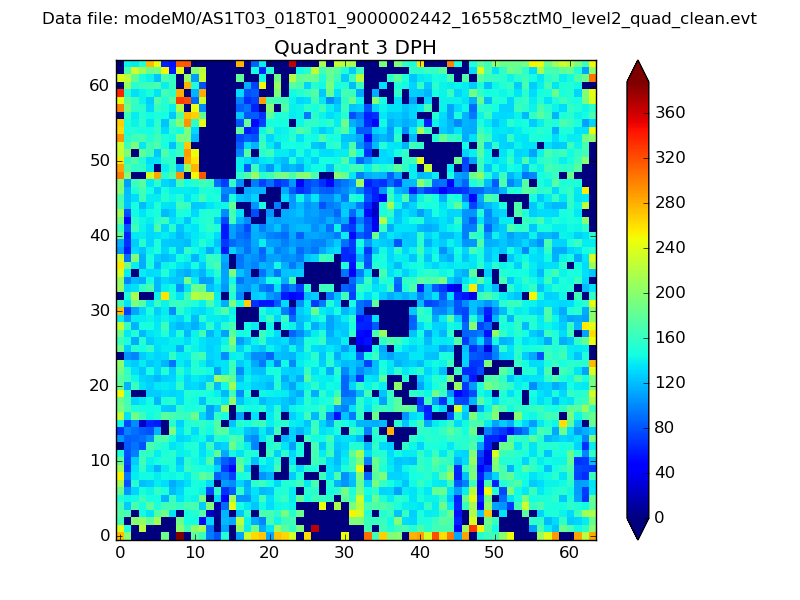 |
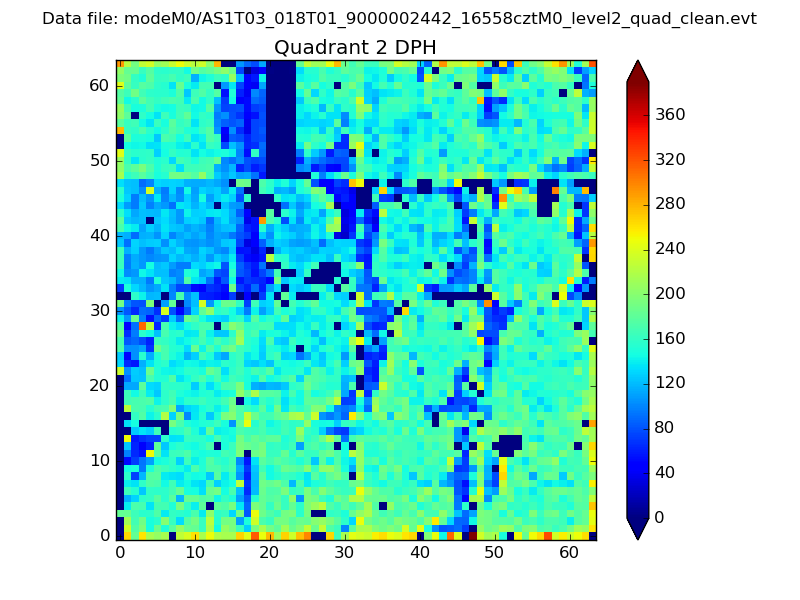 |
Quadrant C |
| Plot type | Count rate plots | Images |
|---|---|---|
| Comparison with Poisson distribution Blue bars denote a histogram of data divided into 1 sec bins. Red curve is a Poisson curve with rate = median count rate of data. |
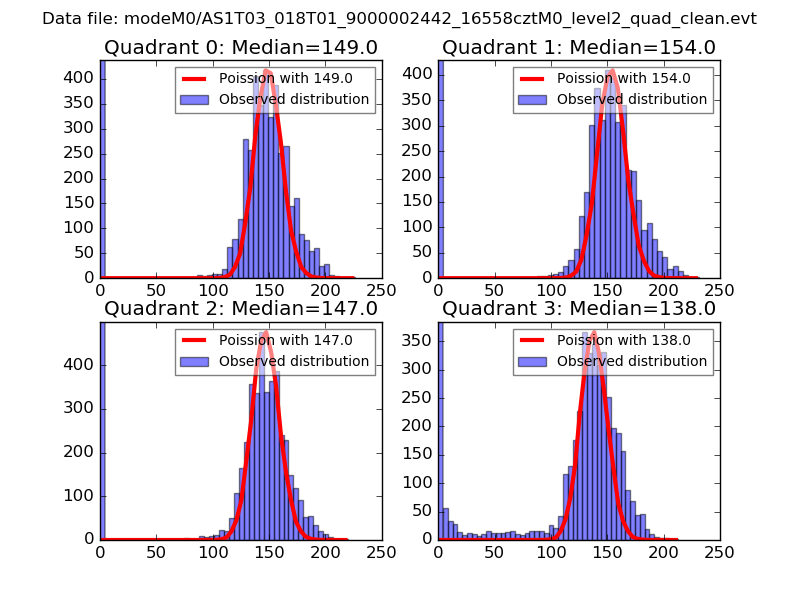 |
 |
| Quadrant-wise count rates Data is divided into 100 sec bins |
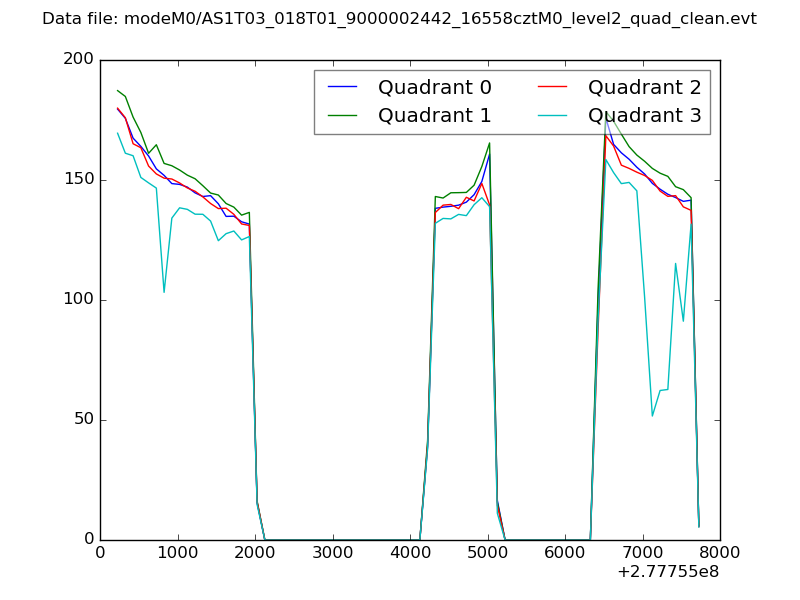 |
|
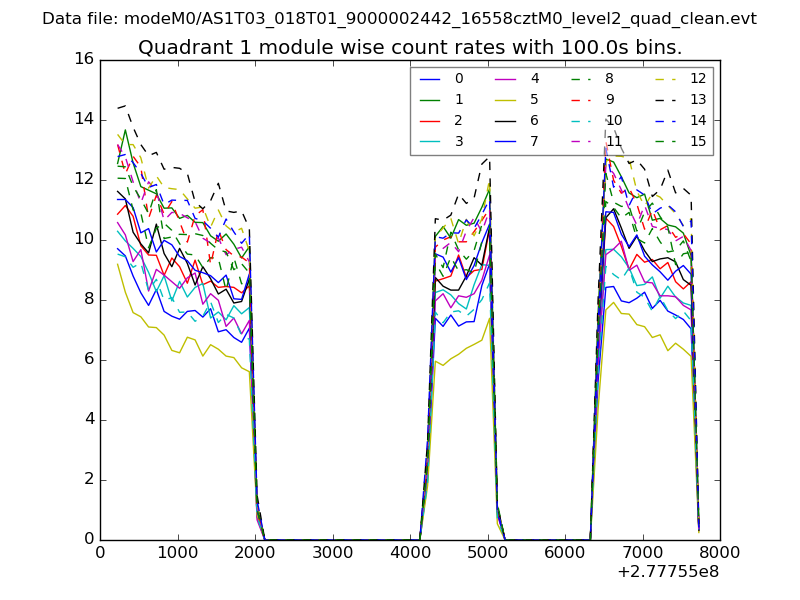
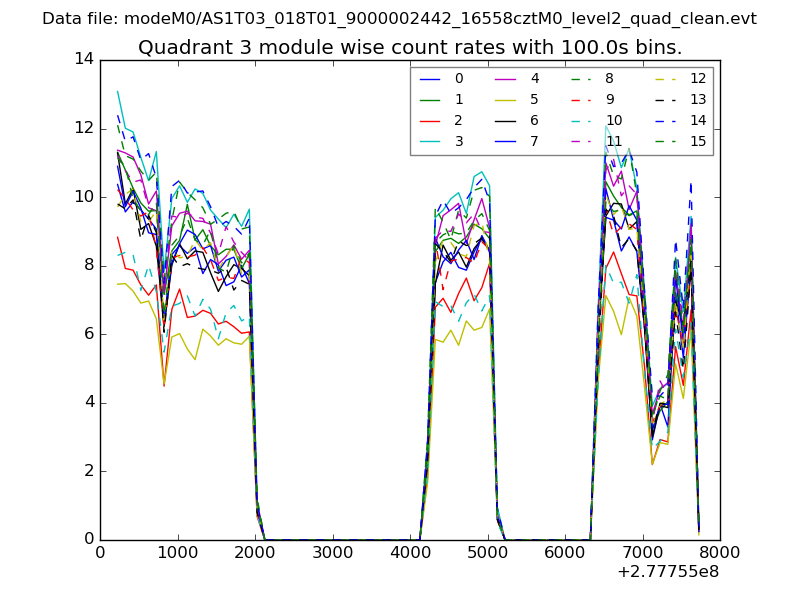
| Module-wise count rates for Quadrant A Data is divided into 100 sec bins |
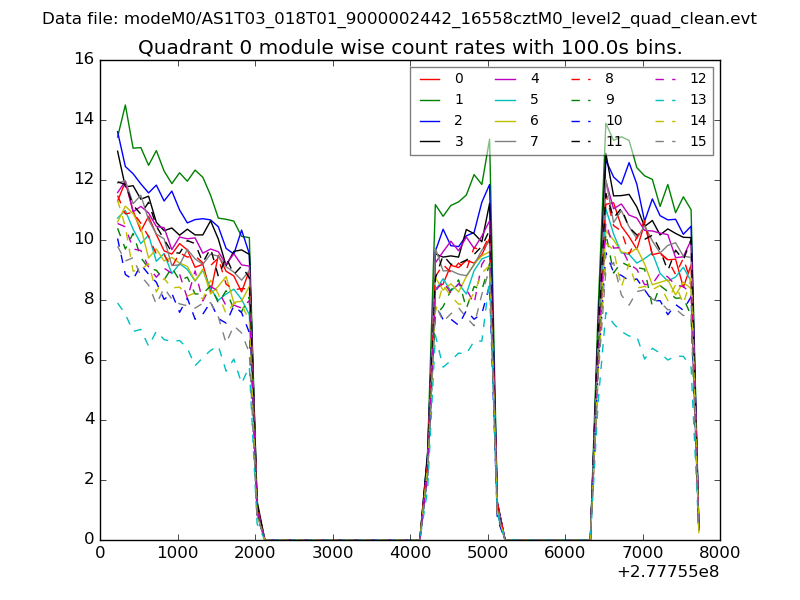 |
 |
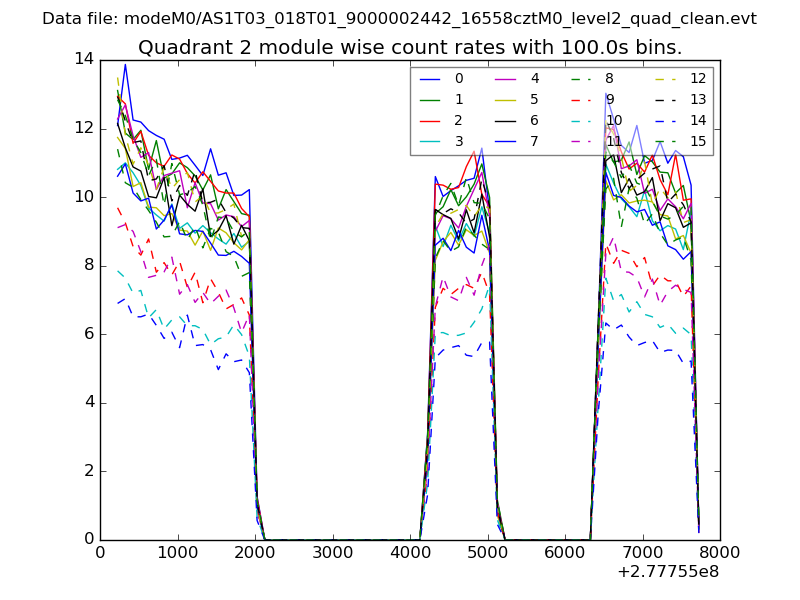
| Module-wise count rates for Quadrant B Data is divided into 100 sec bins |
 |
 |
| Module-wise count rates for Quadrant C Data is divided into 100 sec bins |
 |
 |
| Module-wise count rates for Quadrant D Data is divided into 100 sec bins |
 |
 |
| Parameter | Plot |
|---|---|
| CZT HV Monitor | 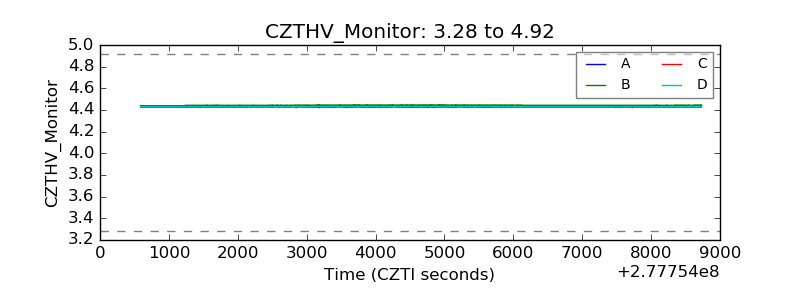 |
| D_VDD | 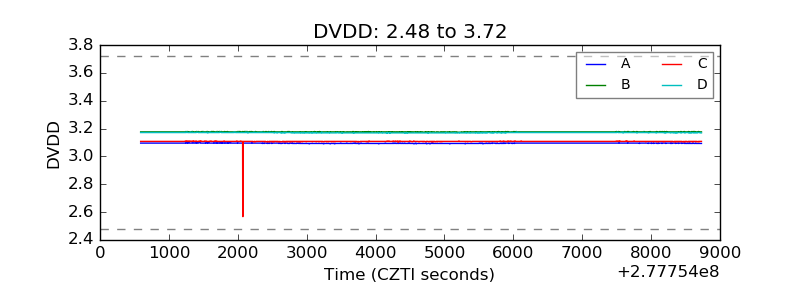 |
| Temperature 1 |  |
| Veto HV Monitor | 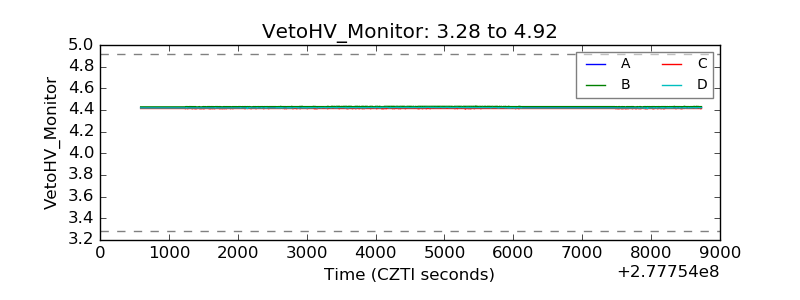 |
| Veto LLD | 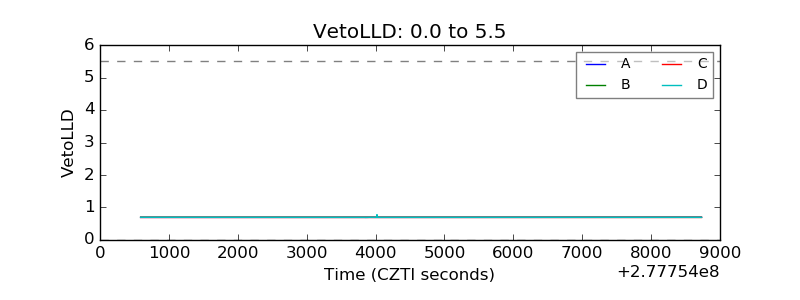 |
| Alpha Counter | 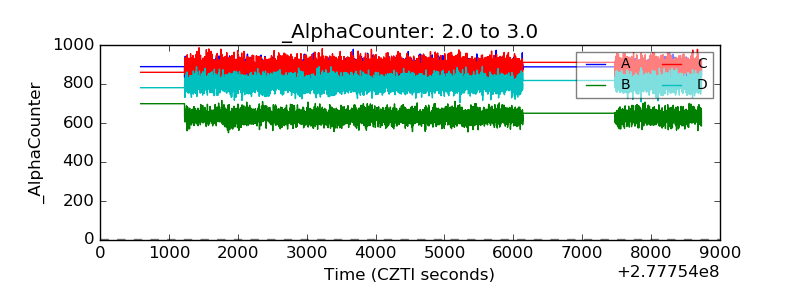 |
| _CPM_Rate | 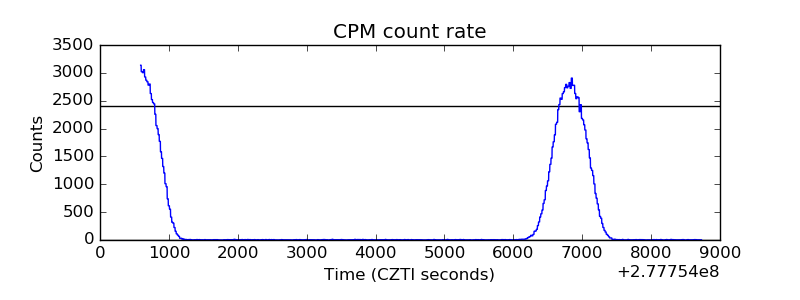 |
| CZT Counter | 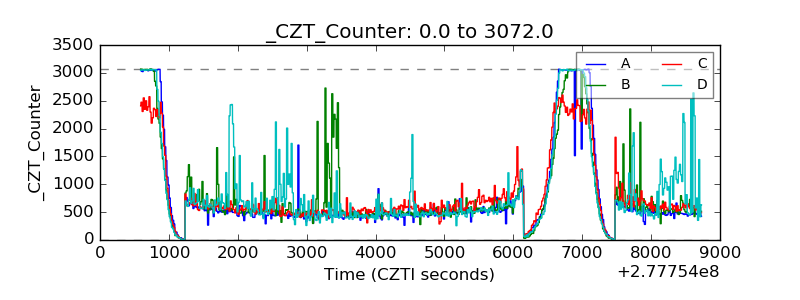 |
| +2.5 Volts monitor |  |
| +5 Volts monitor |  |
| _ROLL_ROT |  |
| _Roll_DEC | 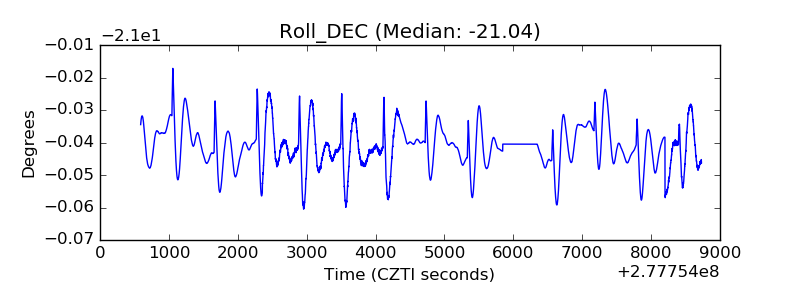 |
| _Roll_RA | 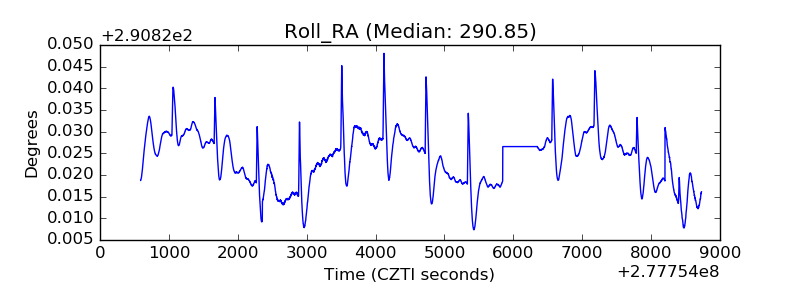 |
| Veto Counter | 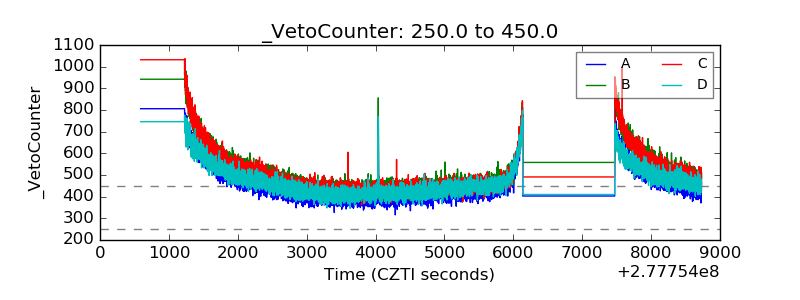 |