| Param | Original file | Final file |
|---|---|---|
| Filename | modeM0/AS1T03_018T01_9000002442_16561cztM0_level2.evt | modeM0/AS1T03_018T01_9000002442_16561cztM0_level2_quad_clean.evt |
| Size (bytes) | 507,248,640 | 73,964,160 |
| Size | 483.8 MB | 70.5 MB |
| Events in quadrant A | 3,535,161 | 443,169 |
| Events in quadrant B | 3,901,024 | 452,325 |
| Events in quadrant C | 3,665,198 | 442,492 |
| Events in quadrant D | 3,785,168 | 413,954 |
| Mode M0 | |||
|---|---|---|---|
| Quadrant | BADHDUFLAG | Total packets | Discarded packets |
| A | 0 | 14798 | 3 |
| B | 0 | 16025 | 2 |
| C | 0 | 15034 | 2 |
| D | 0 | 16131 | 2 |
| Mode M9 | |||
|---|---|---|---|
| Quadrant | BADHDUFLAG | Total packets | Discarded packets |
| A | 0 | 13 | 0 |
| B | 0 | 13 | 0 |
| C | 0 | 13 | 0 |
| D | 0 | 14 | 0 |
| Mode SS | |||
|---|---|---|---|
| Quadrant | BADHDUFLAG | Total packets | Discarded packets |
| A | 0 | 144 | 0 |
| B | 0 | 144 | 0 |
| C | 0 | 144 | 0 |
| D | 0 | 144 | 0 |
| Quadrant | Total seconds | Saturated seconds | Saturation percentage |
|---|---|---|---|
| A | 6993 | 72 | 1.029601% |
| B | 6993 | 147 | 2.102102% |
| C | 6993 | 117 | 1.673102% |
| D | 6993 | 379 | 5.419705% |
Noise dominated data is calculated using 1-second bins in cleaned event files. If a bin has >2000 counts, and if more than 50% of those come from <1% of pixels, then it is considered to be noise-dominated and hence unusable.
| Quadrant | # 1 sec bins | Bins with >0 counts | Bins with >2000 counts | High rate bins dominated by noise | Noise dominated (total time) | Noise dominated (detector-on time) | Marked lightcurve |
|---|---|---|---|---|---|---|---|
| A | 7854 | 6995 | 14 | 14 | 0.18% | 0.20% | 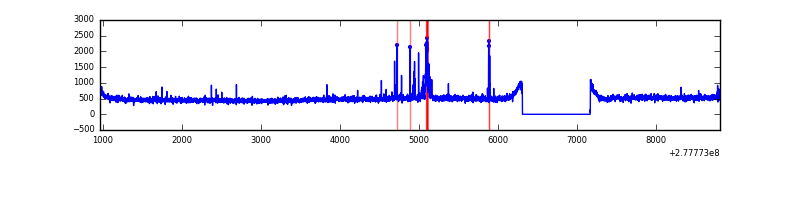 |
| B | 7854 | 6995 | 22 | 22 | 0.28% | 0.31% | 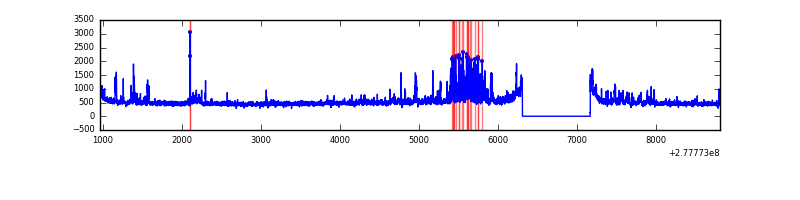 |
| C | 7854 | 6995 | 0 | 0 | 0.00% | 0.00% | 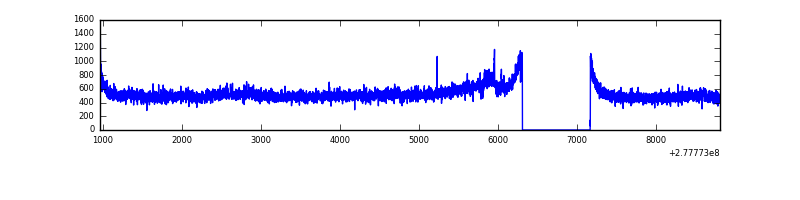 |
| D | 7854 | 6995 | 34 | 34 | 0.43% | 0.49% | 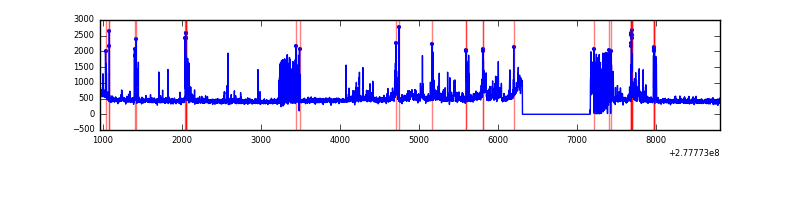 |
Top three noisy pixels from each quadrant. If the there are fewer than three noisy pixels in the level2.evt file, extra rows are filled as -1
| Pixel properties | Quadrant properties | ||||||
|---|---|---|---|---|---|---|---|
| Quadrant | DetID | PixID | Counts | Sigma | Mean | Median | Sigma |
| A | 11 | 29 | 113859 | 652.98 | 850 | 831 | 173.1 |
| A | 15 | 174 | 100703 | 576.97 | 850 | 831 | 173.1 |
| A | 9 | 143 | 24803 | 138.49 | 850 | 831 | 173.1 |
| B | 15 | 35 | 366373 | 2192.75 | 859 | 840 | 166.7 |
| B | 4 | 48 | 44424 | 261.45 | 859 | 840 | 166.7 |
| B | 0 | 198 | 30535 | 178.13 | 859 | 840 | 166.7 |
| C | 3 | 233 | 315991 | 1630.0 | 823 | 828 | 193.4 |
| C | 14 | 238 | 125352 | 644.03 | 823 | 828 | 193.4 |
| C | 7 | 247 | 12999 | 62.95 | 823 | 828 | 193.4 |
| D | 5 | 222 | 418333 | 2124.53 | 800 | 776 | 196.5 |
| D | 1 | 52 | 272291 | 1381.47 | 800 | 776 | 196.5 |
| D | 10 | 70 | 50378 | 252.37 | 800 | 776 | 196.5 |
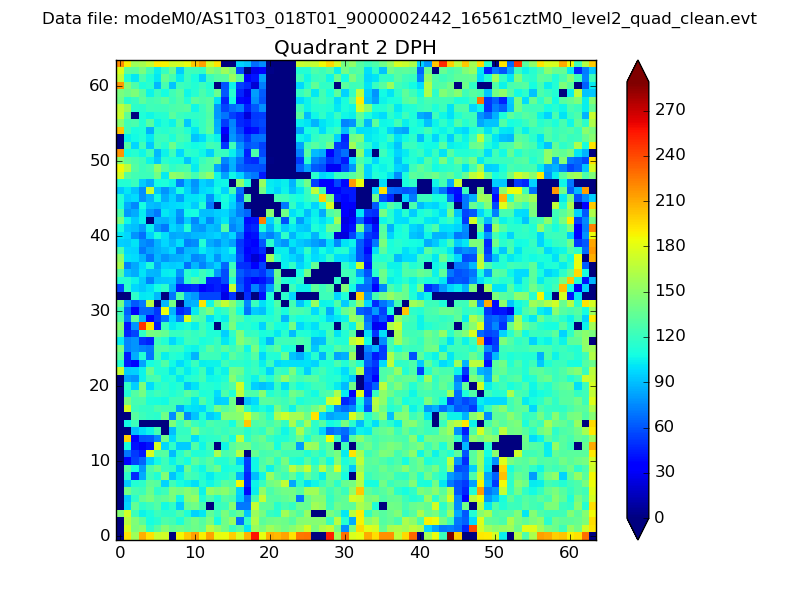
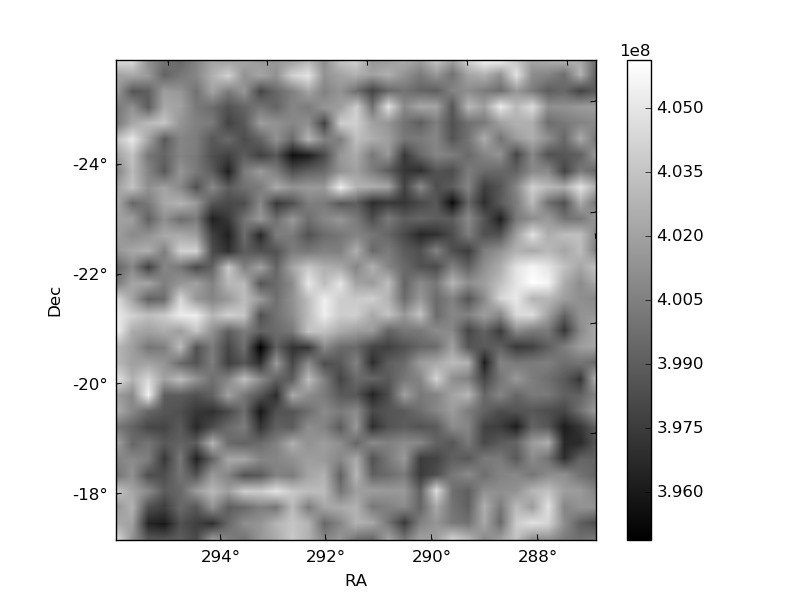
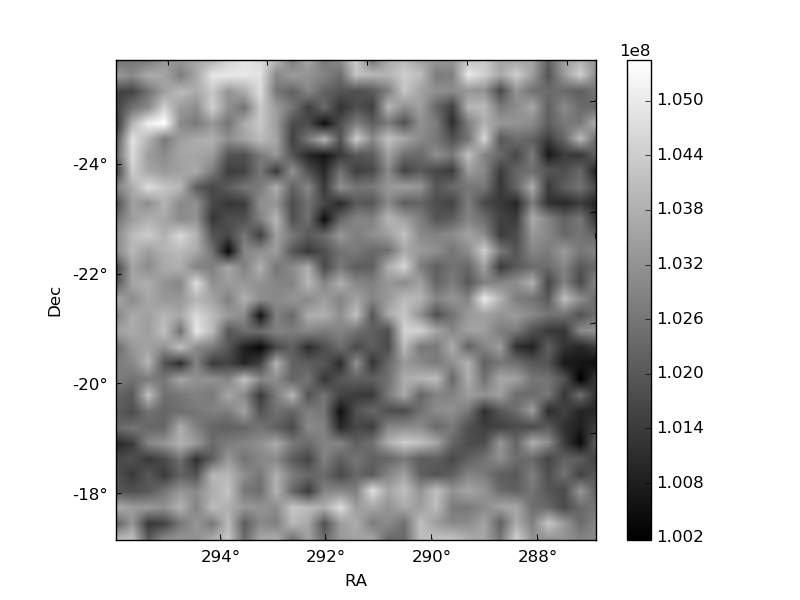
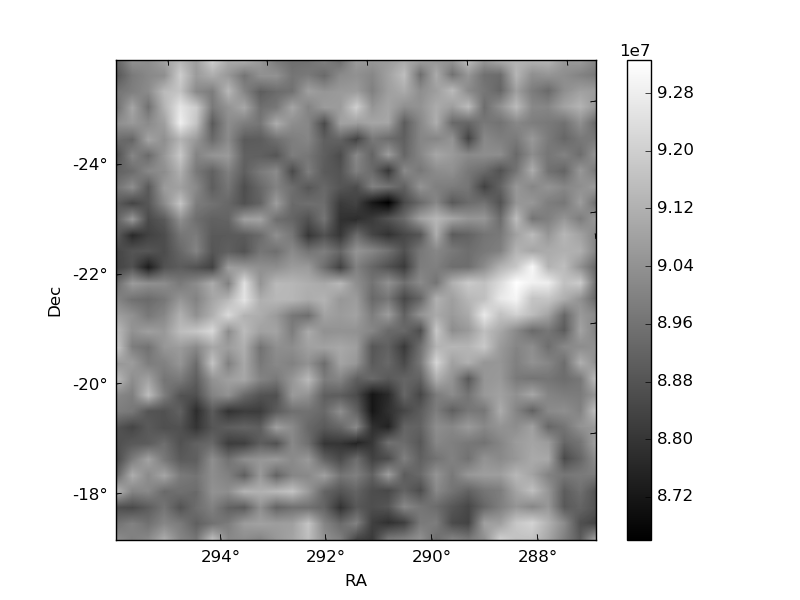
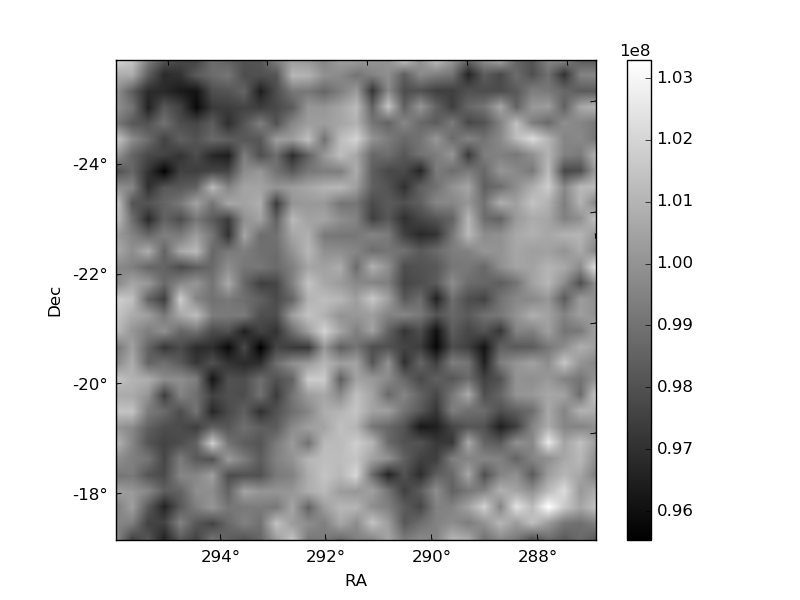
Histogram calculated using DETX and DETY for each event in the final _common_clean file
| Quadrant A | 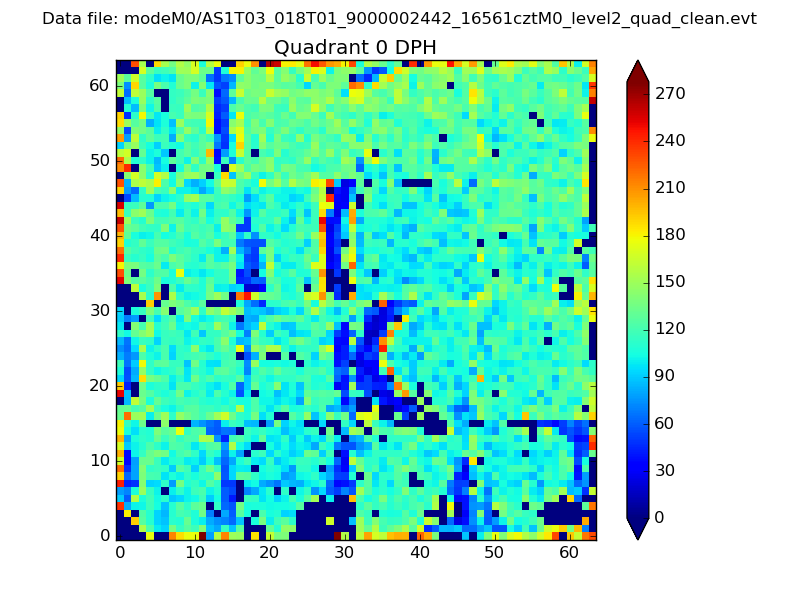 |
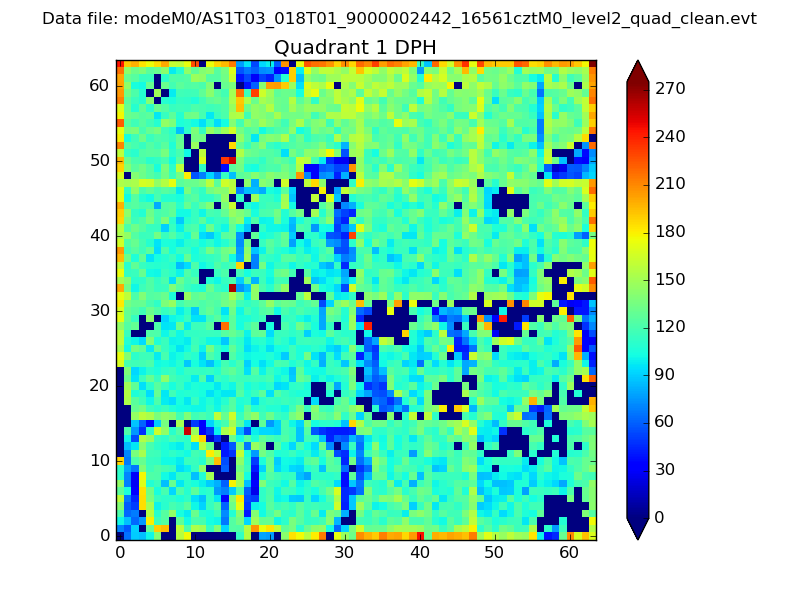 |
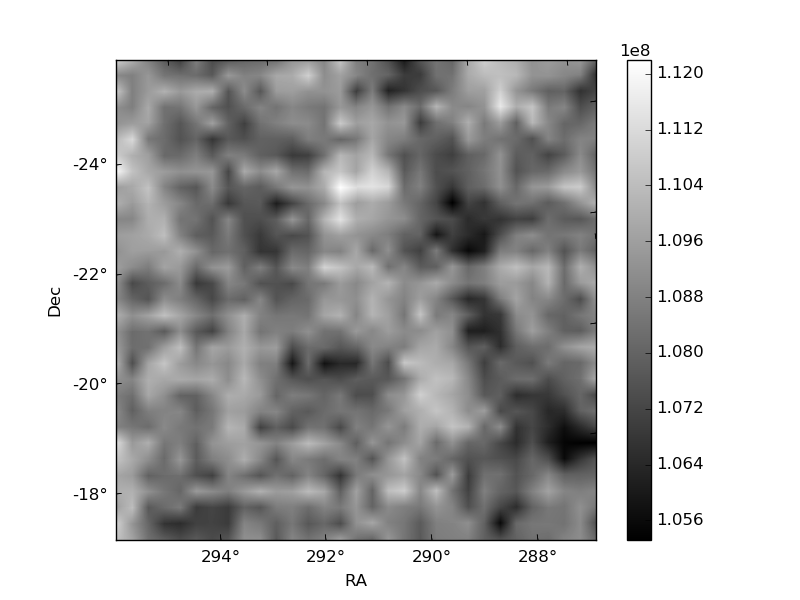
Quadrant B |
|---|---|---|---|
| Quadrant D | 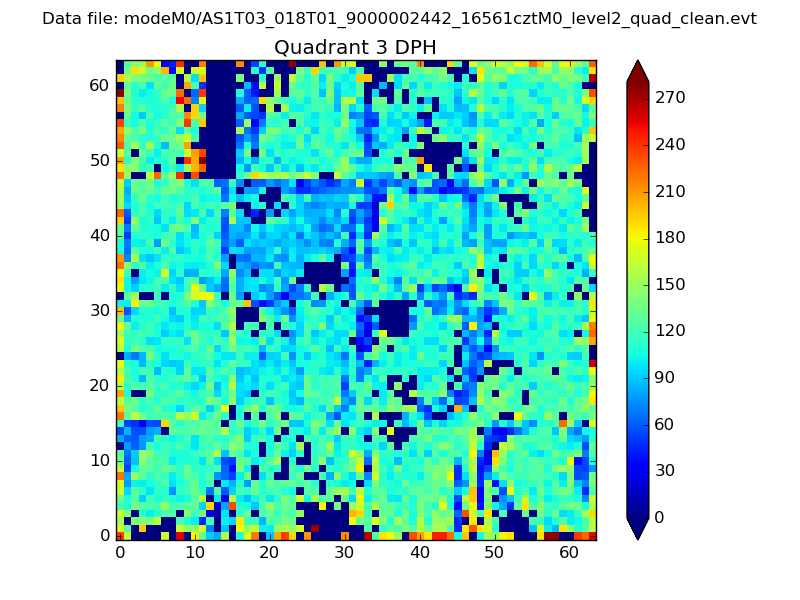 |
 |
Quadrant C |
| Plot type | Count rate plots | Images |
|---|---|---|
| Comparison with Poisson distribution Blue bars denote a histogram of data divided into 1 sec bins. Red curve is a Poisson curve with rate = median count rate of data. |
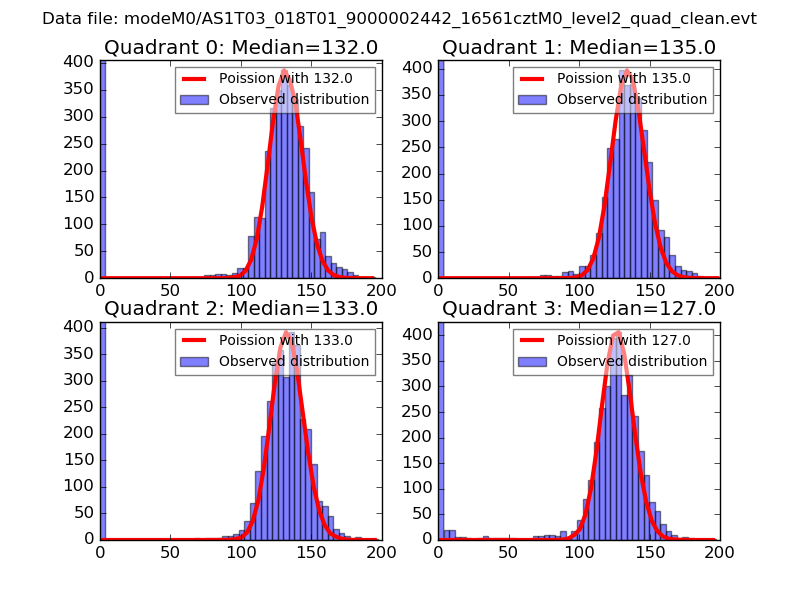 |
 |
| Quadrant-wise count rates Data is divided into 100 sec bins |
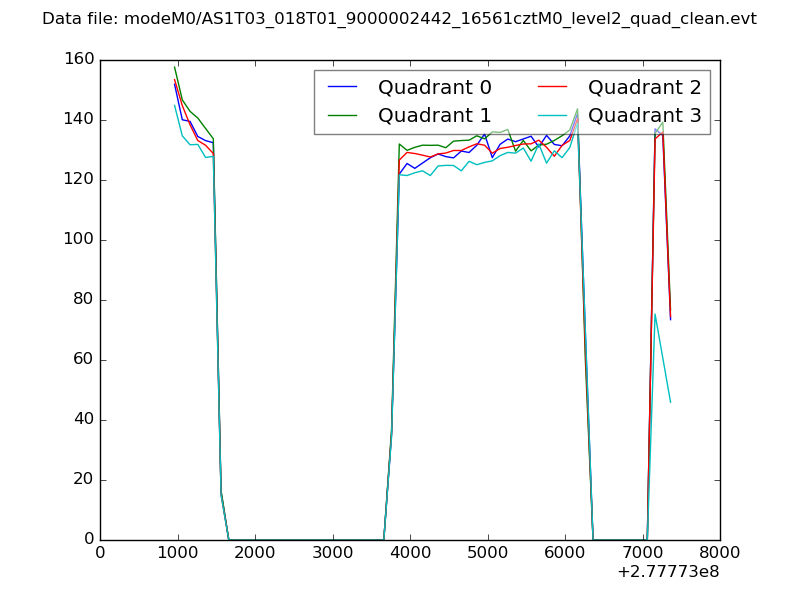 |
|
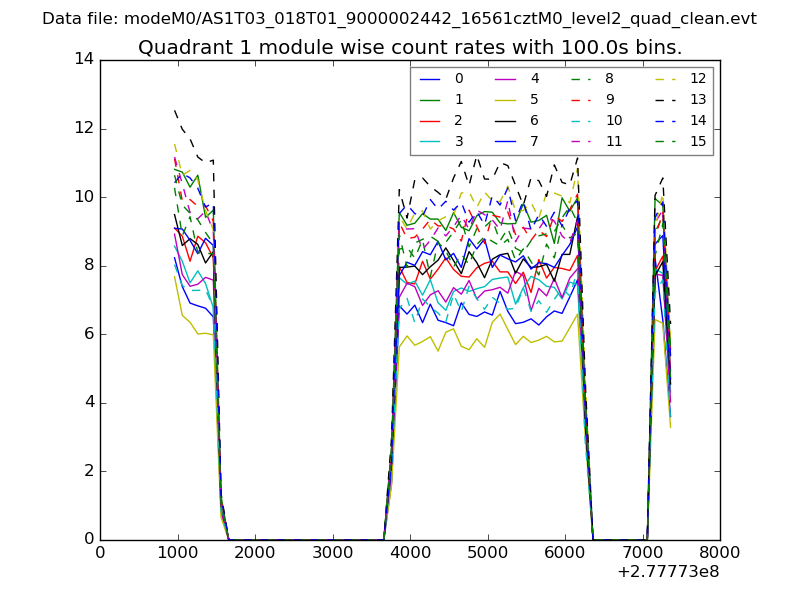
| Module-wise count rates for Quadrant A Data is divided into 100 sec bins |
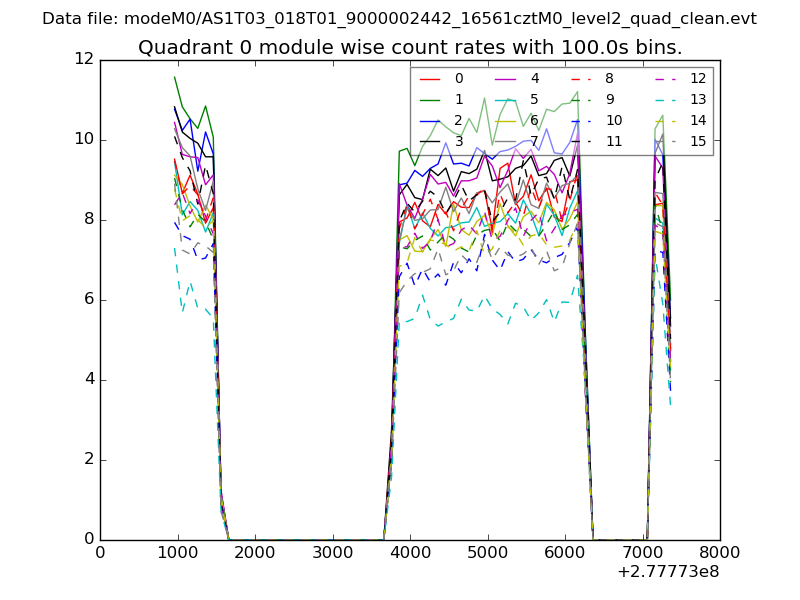 |
 |
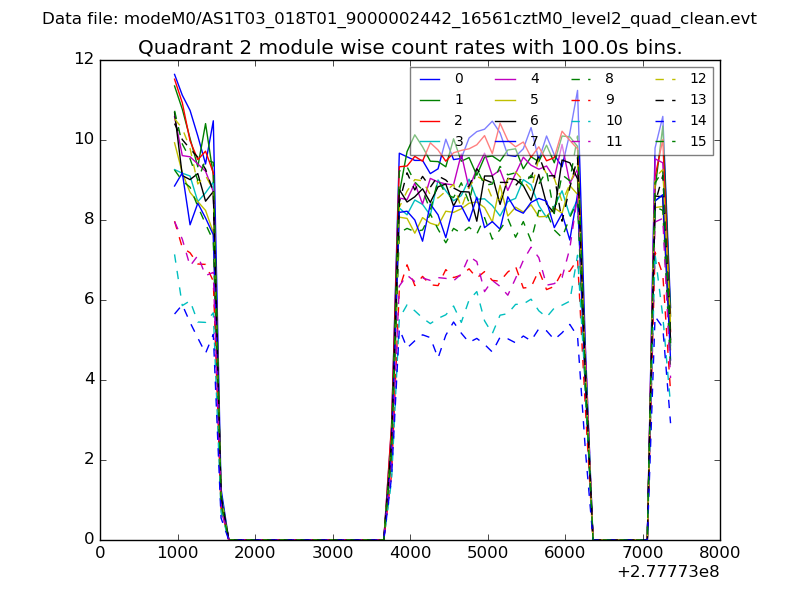
| Module-wise count rates for Quadrant B Data is divided into 100 sec bins |
 |
 |
| Module-wise count rates for Quadrant C Data is divided into 100 sec bins |
 |
 |
| Module-wise count rates for Quadrant D Data is divided into 100 sec bins |
 |
 |
| Parameter | Plot |
|---|---|
| CZT HV Monitor | 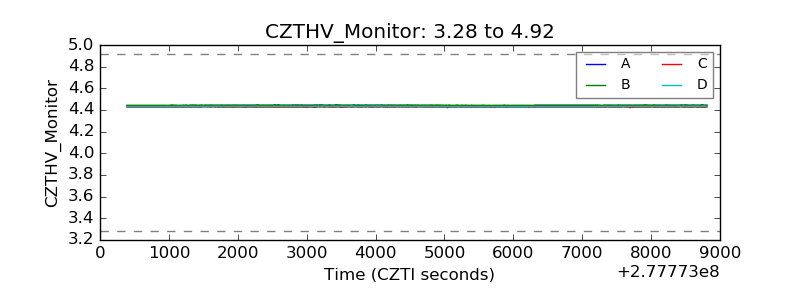 |
| D_VDD | 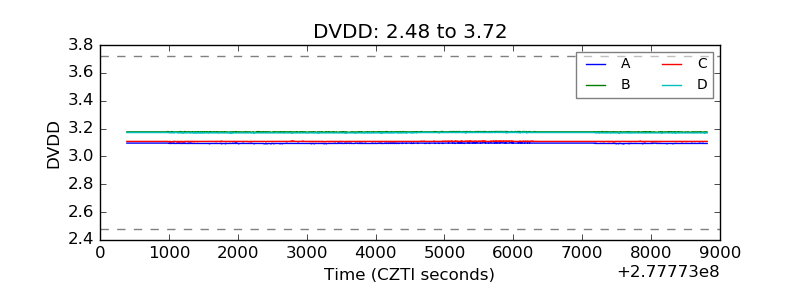 |
| Temperature 1 | 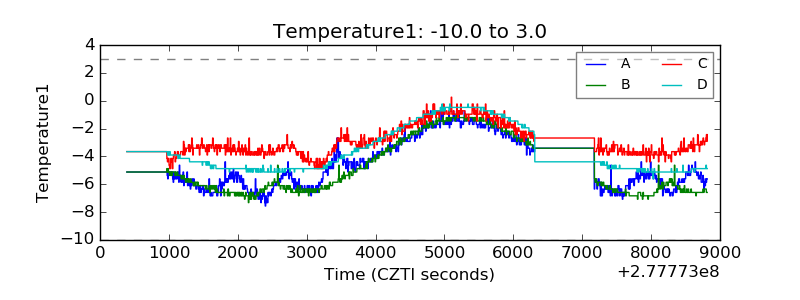 |
| Veto HV Monitor | 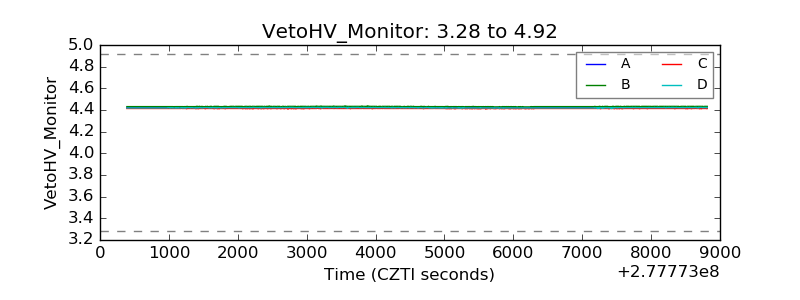 |
| Veto LLD | 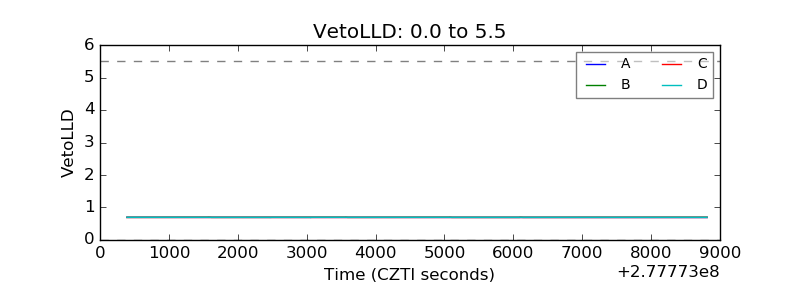 |
| Alpha Counter | 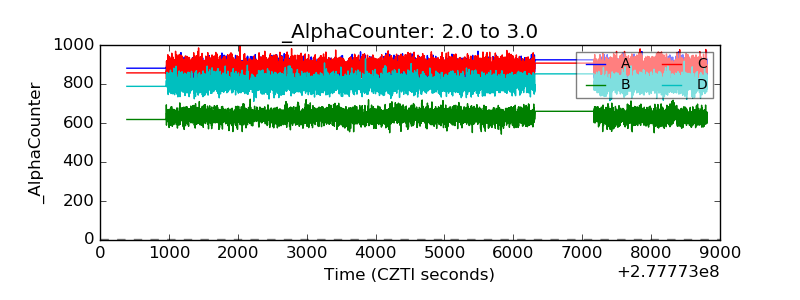 |
| _CPM_Rate | 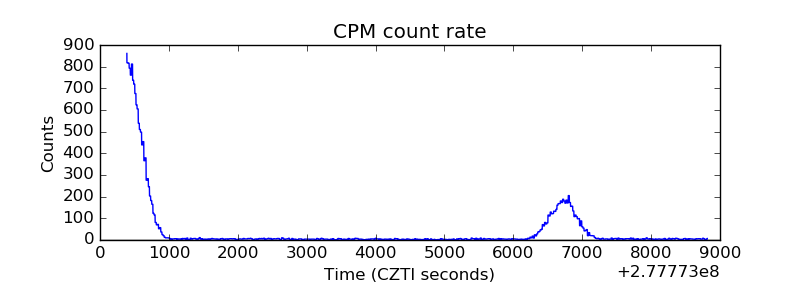 |
| CZT Counter | 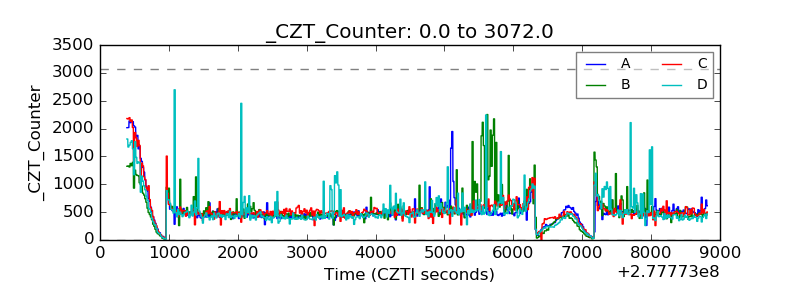 |
| +2.5 Volts monitor |  |
| +5 Volts monitor |  |
| _ROLL_ROT | 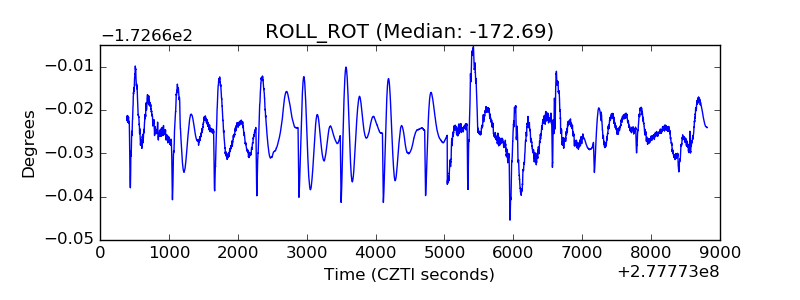 |
| _Roll_DEC |  |
| _Roll_RA | 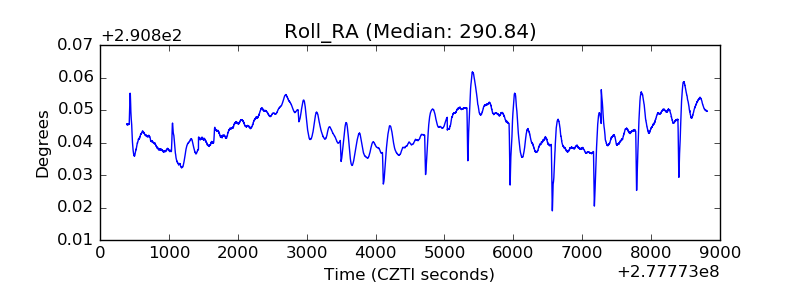 |
| Veto Counter |  |