| Param | Original file | Final file |
|---|---|---|
| Filename | modeM0/AS1T03_018T01_9000002442_16563cztM0_level2.evt | modeM0/AS1T03_018T01_9000002442_16563cztM0_level2_quad_clean.evt |
| Size (bytes) | 606,945,600 | 81,195,840 |
| Size | 578.8 MB | 77.4 MB |
| Events in quadrant A | 3,865,977 | 490,659 |
| Events in quadrant B | 4,674,055 | 497,842 |
| Events in quadrant C | 4,297,609 | 494,052 |
| Events in quadrant D | 5,003,945 | 422,730 |
| Mode M0 | |||
|---|---|---|---|
| Quadrant | BADHDUFLAG | Total packets | Discarded packets |
| A | 0 | 16824 | 4 |
| B | 0 | 18935 | 3 |
| C | 0 | 17493 | 3 |
| D | 0 | 20521 | 3 |
| Mode M9 | |||
|---|---|---|---|
| Quadrant | BADHDUFLAG | Total packets | Discarded packets |
| A | 0 | 5 | 0 |
| B | 0 | 5 | 0 |
| C | 0 | 5 | 0 |
| D | 0 | 5 | 0 |
| Mode SS | |||
|---|---|---|---|
| Quadrant | BADHDUFLAG | Total packets | Discarded packets |
| A | 0 | 166 | 0 |
| B | 0 | 166 | 0 |
| C | 0 | 166 | 0 |
| D | 0 | 166 | 0 |
| Quadrant | Total seconds | Saturated seconds | Saturation percentage |
|---|---|---|---|
| A | 7940 | 280 | 3.526448% |
| B | 7940 | 421 | 5.302267% |
| C | 7940 | 336 | 4.231738% |
| D | 7940 | 1108 | 13.954660% |
Noise dominated data is calculated using 1-second bins in cleaned event files. If a bin has >2000 counts, and if more than 50% of those come from <1% of pixels, then it is considered to be noise-dominated and hence unusable.
| Quadrant | # 1 sec bins | Bins with >0 counts | Bins with >2000 counts | High rate bins dominated by noise | Noise dominated (total time) | Noise dominated (detector-on time) | Marked lightcurve |
|---|---|---|---|---|---|---|---|
| A | 8551 | 7944 | 0 | 0 | 0.00% | 0.00% | 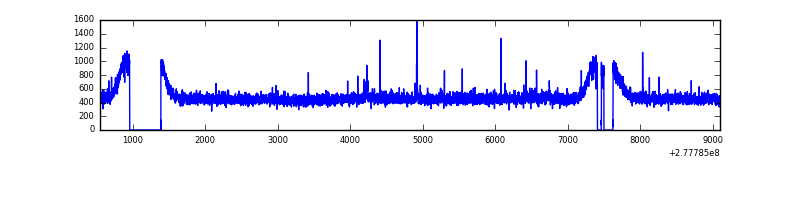 |
| B | 8551 | 7943 | 63 | 63 | 0.74% | 0.79% | 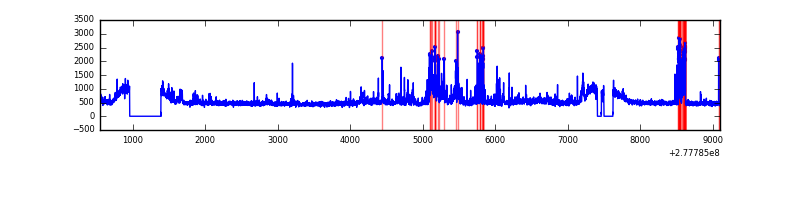 |
| C | 8551 | 7943 | 0 | 0 | 0.00% | 0.00% | 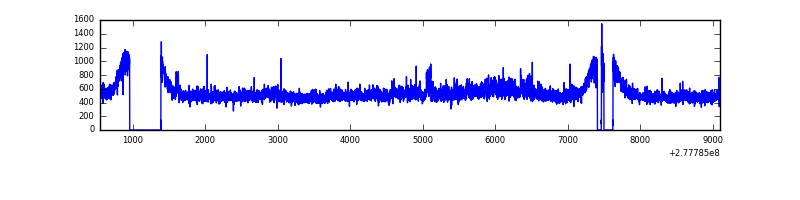 |
| D | 8551 | 7944 | 134 | 134 | 1.57% | 1.69% | 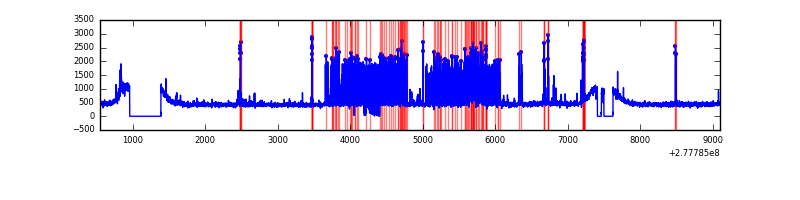 |
Top three noisy pixels from each quadrant. If the there are fewer than three noisy pixels in the level2.evt file, extra rows are filled as -1
| Pixel properties | Quadrant properties | ||||||
|---|---|---|---|---|---|---|---|
| Quadrant | DetID | PixID | Counts | Sigma | Mean | Median | Sigma |
| A | 15 | 174 | 16994 | 79.09 | 993 | 971 | 202.6 |
| A | 9 | 143 | 13468 | 61.69 | 993 | 971 | 202.6 |
| A | 15 | 223 | 10138 | 45.25 | 993 | 971 | 202.6 |
| B | 15 | 35 | 364702 | 1878.92 | 993 | 967 | 193.6 |
| B | 0 | 85 | 144394 | 740.89 | 993 | 967 | 193.6 |
| B | 0 | 229 | 75538 | 385.21 | 993 | 967 | 193.6 |
| C | 3 | 233 | 260560 | 1133.98 | 958 | 965 | 228.9 |
| C | 7 | 247 | 154558 | 670.94 | 958 | 965 | 228.9 |
| C | 14 | 238 | 143739 | 623.68 | 958 | 965 | 228.9 |
| D | 1 | 52 | 1209068 | 5362.09 | 917 | 890 | 225.3 |
| D | 10 | 70 | 130905 | 577.03 | 917 | 890 | 225.3 |
| D | 7 | 38 | 108548 | 477.8 | 917 | 890 | 225.3 |
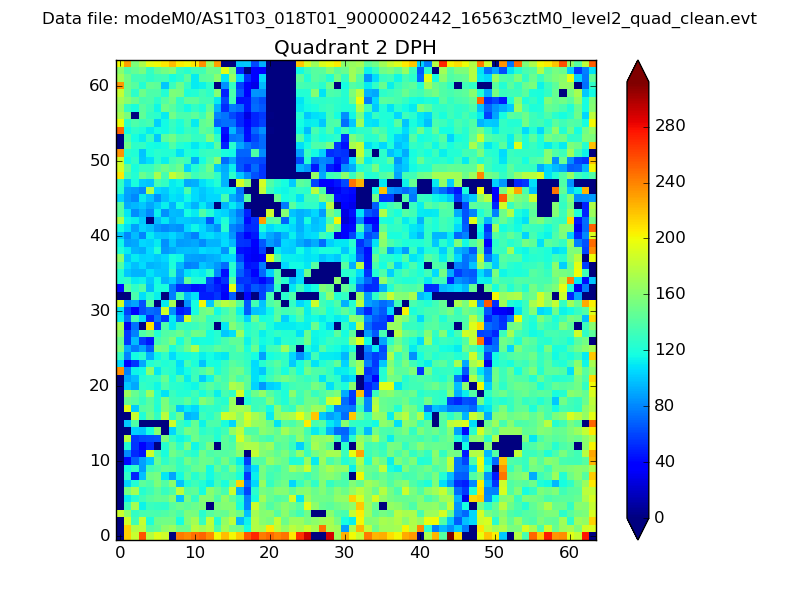
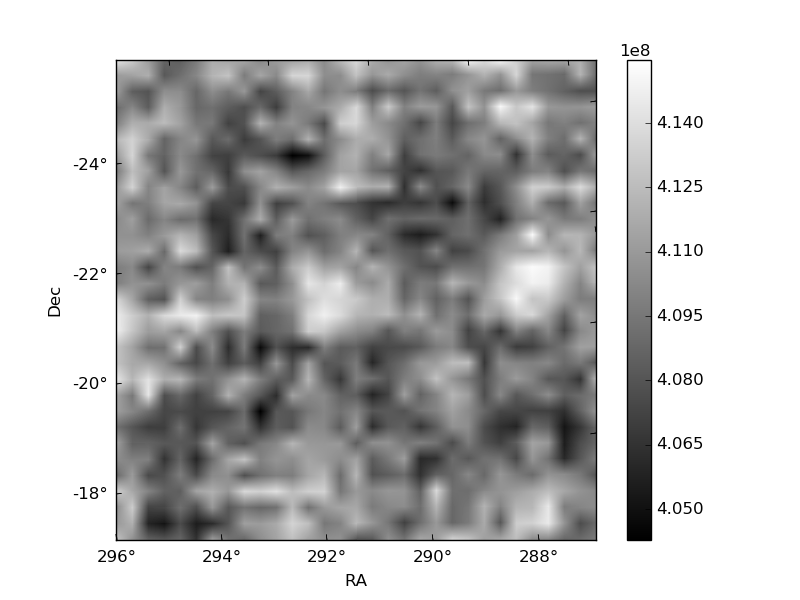
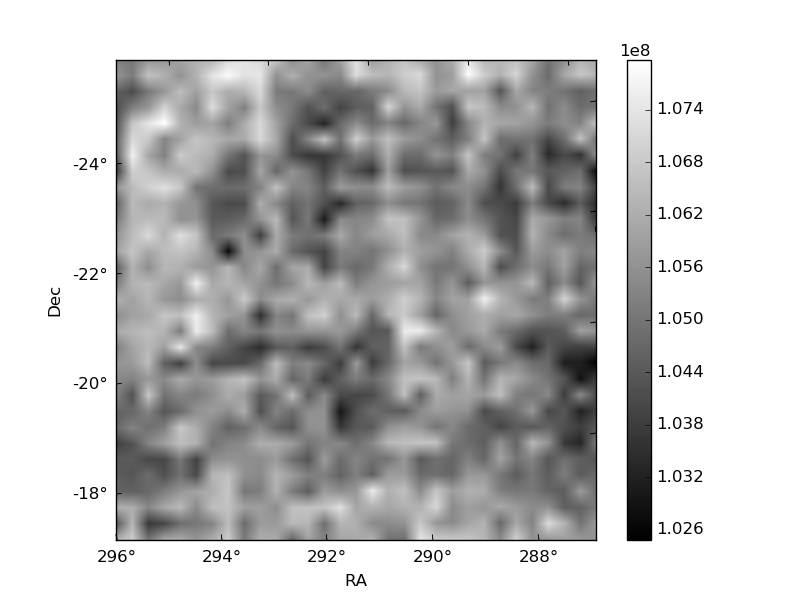
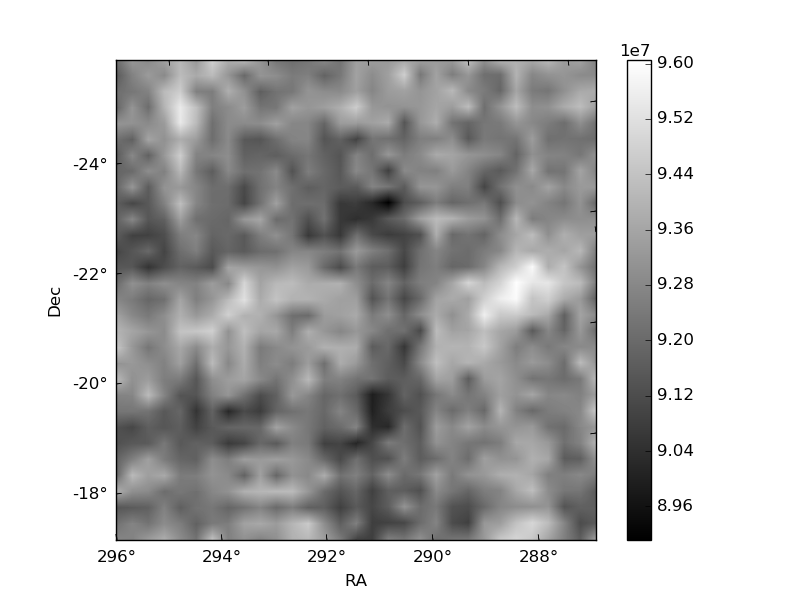
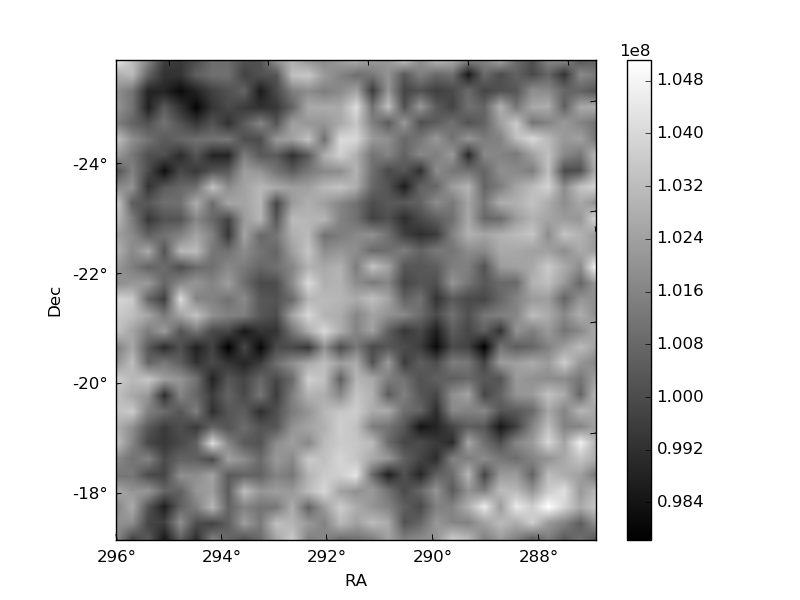
Histogram calculated using DETX and DETY for each event in the final _common_clean file
| Quadrant A | 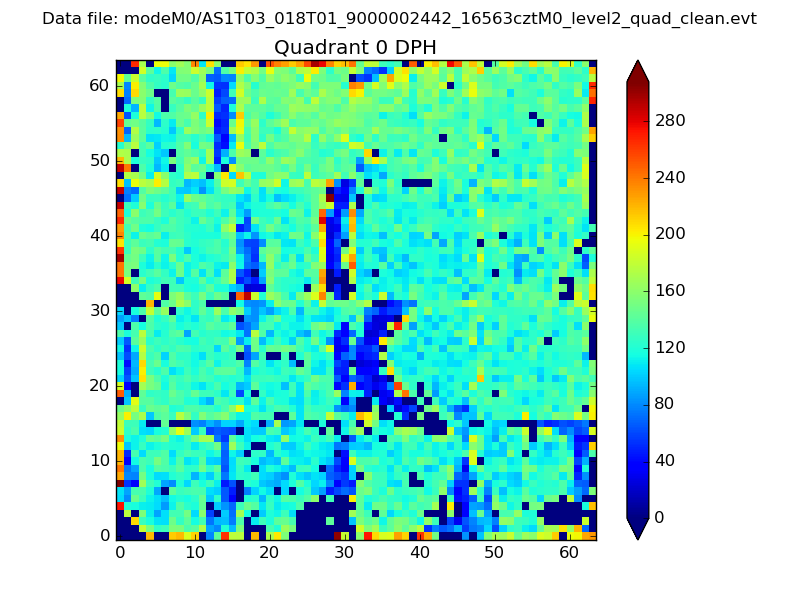 |
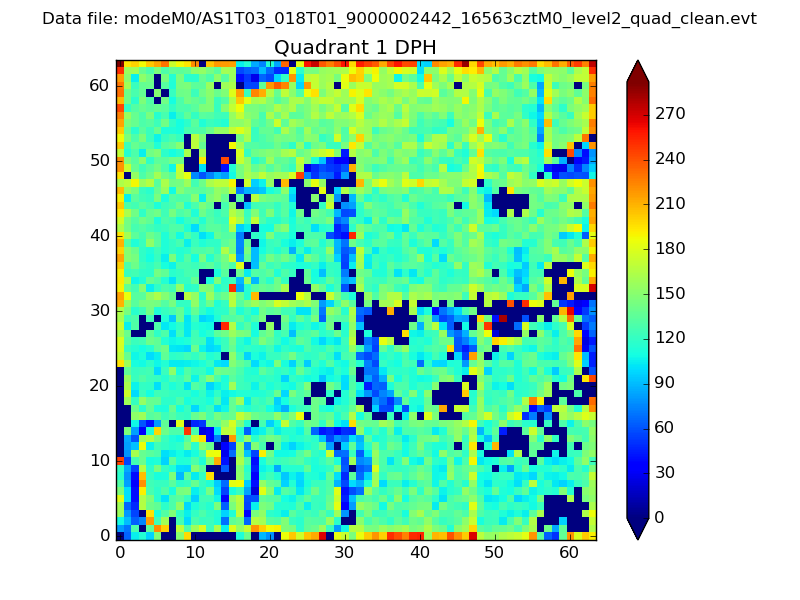 |
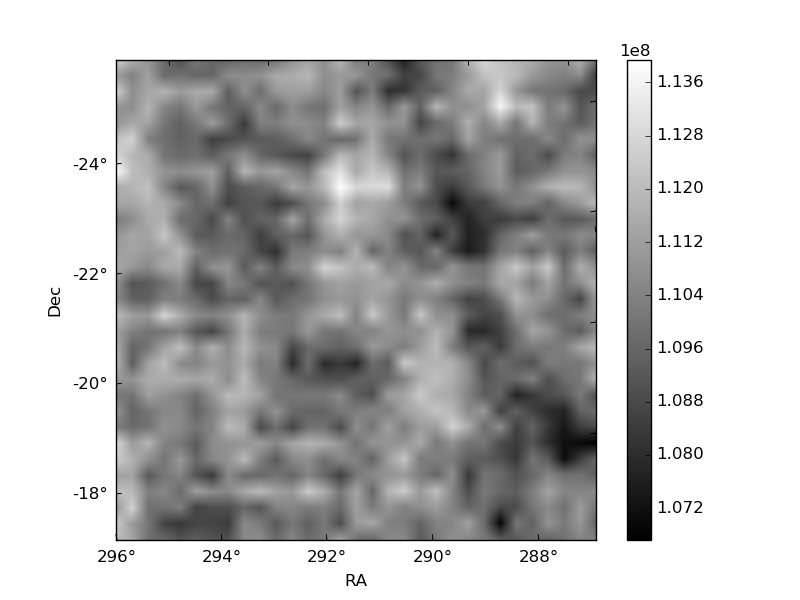
Quadrant B |
|---|---|---|---|
| Quadrant D | 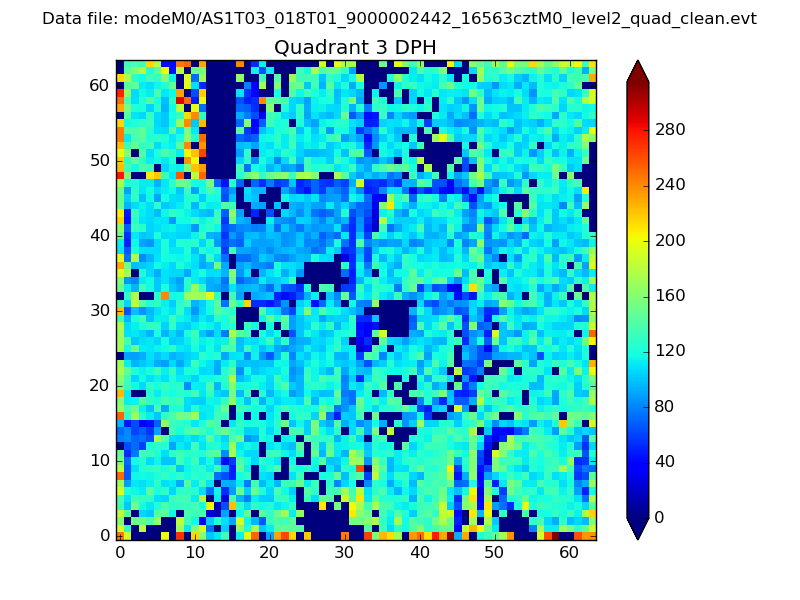 |
 |
Quadrant C |
| Plot type | Count rate plots | Images |
|---|---|---|
| Comparison with Poisson distribution Blue bars denote a histogram of data divided into 1 sec bins. Red curve is a Poisson curve with rate = median count rate of data. |
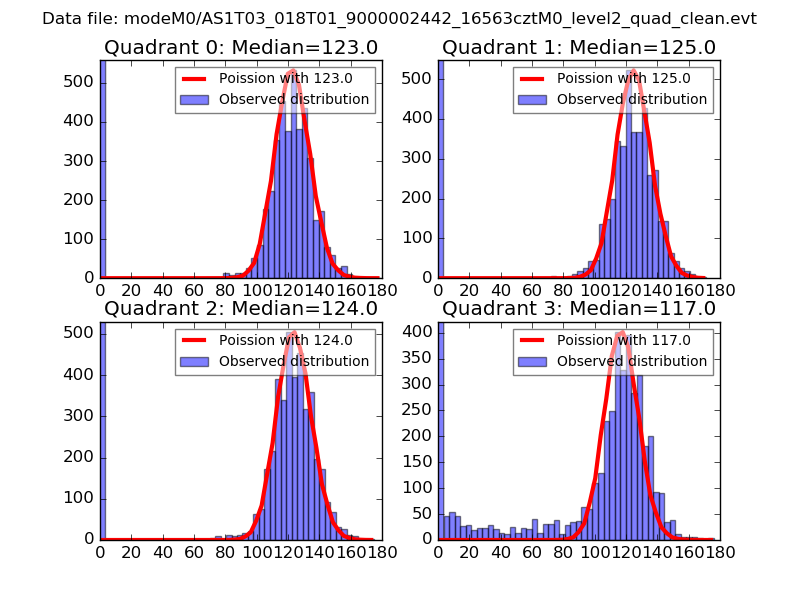 |
 |
| Quadrant-wise count rates Data is divided into 100 sec bins |
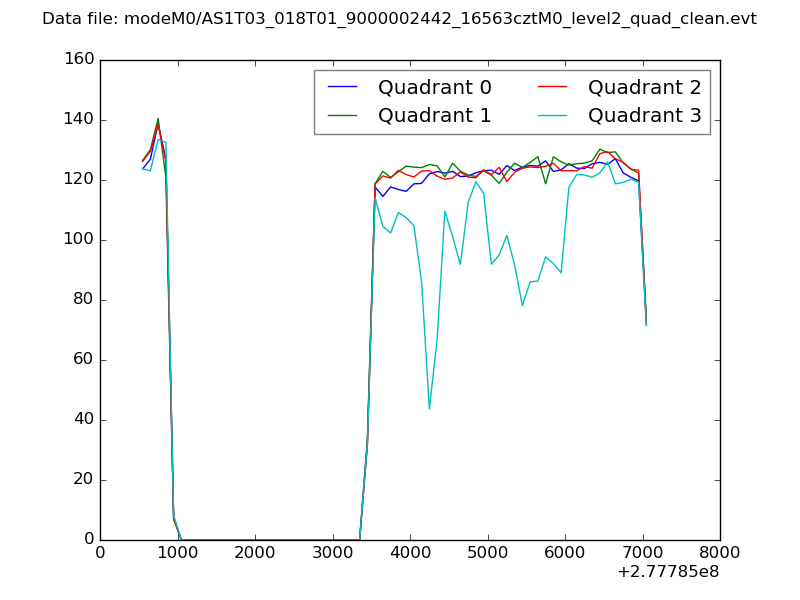 |
|
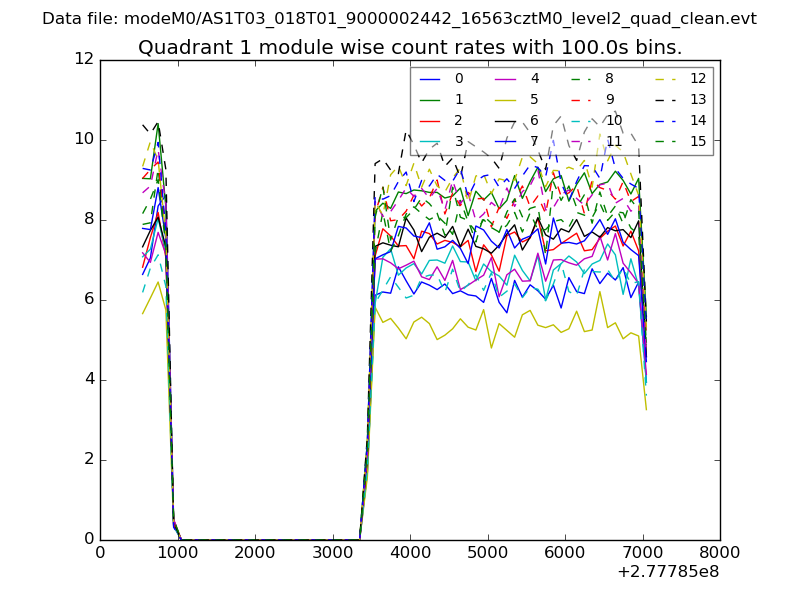
| Module-wise count rates for Quadrant A Data is divided into 100 sec bins |
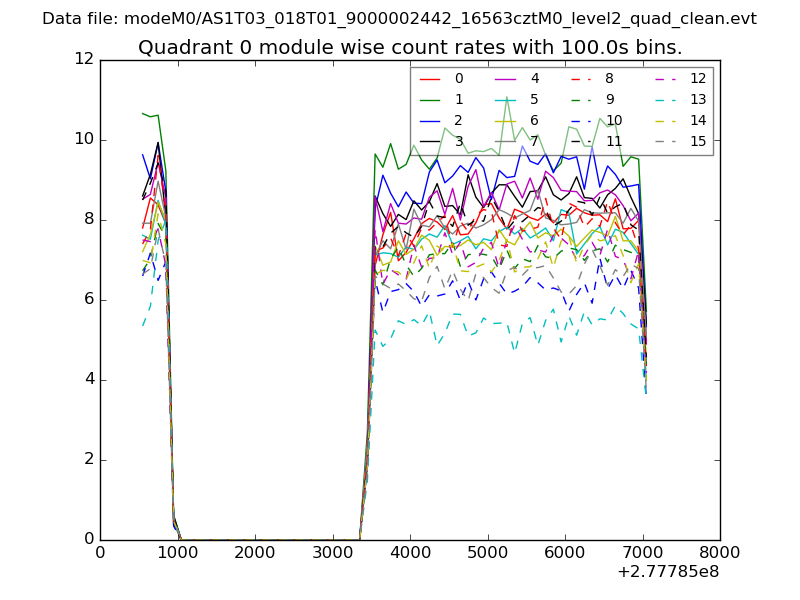 |
 |
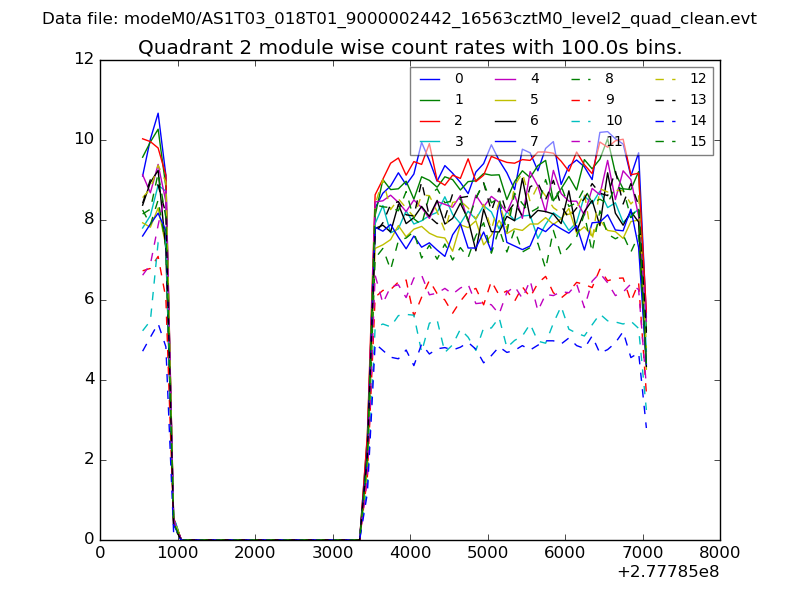
| Module-wise count rates for Quadrant B Data is divided into 100 sec bins |
 |
 |
| Module-wise count rates for Quadrant C Data is divided into 100 sec bins |
 |
 |
| Module-wise count rates for Quadrant D Data is divided into 100 sec bins |
 |
 |
| Parameter | Plot |
|---|---|
| CZT HV Monitor | 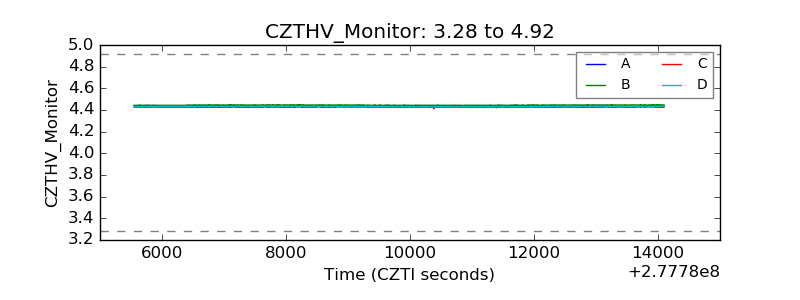 |
| D_VDD | 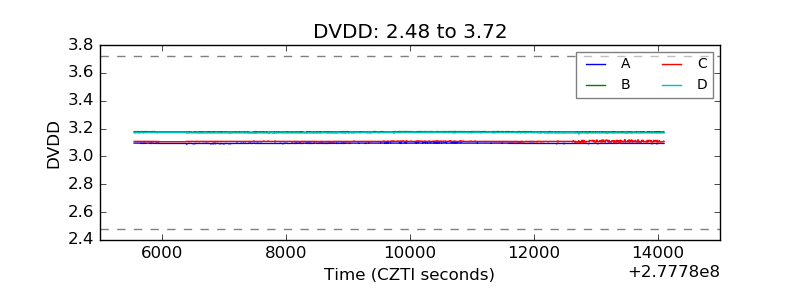 |
| Temperature 1 |  |
| Veto HV Monitor | 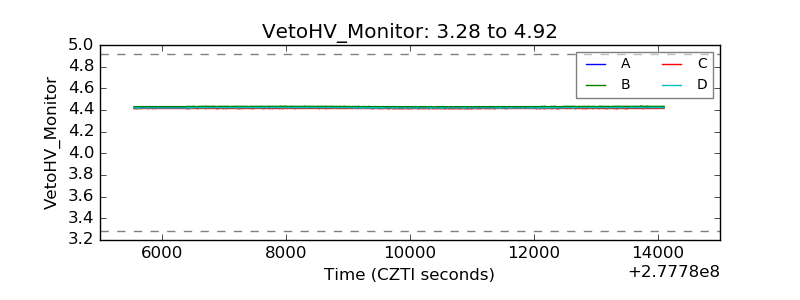 |
| Veto LLD |  |
| Alpha Counter | 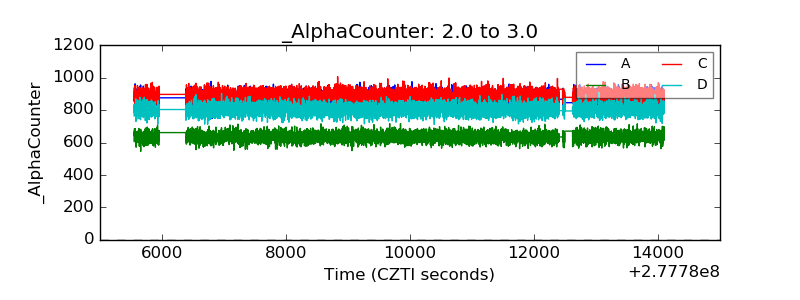 |
| _CPM_Rate | 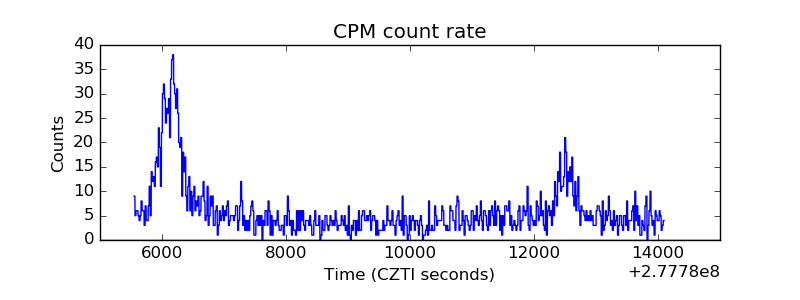 |
| CZT Counter | 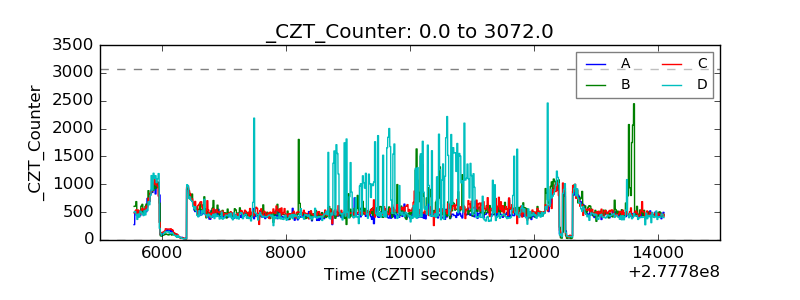 |
| +2.5 Volts monitor |  |
| +5 Volts monitor | 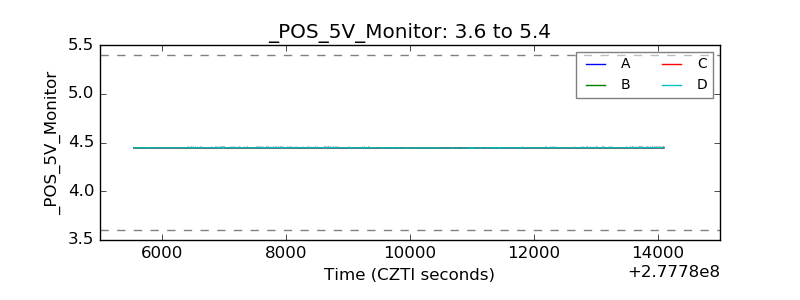 |
| _ROLL_ROT | 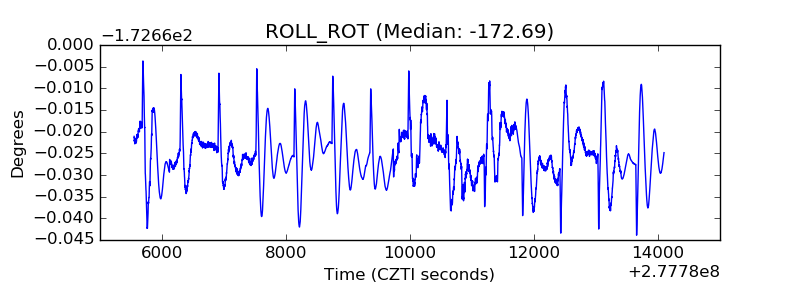 |
| _Roll_DEC | 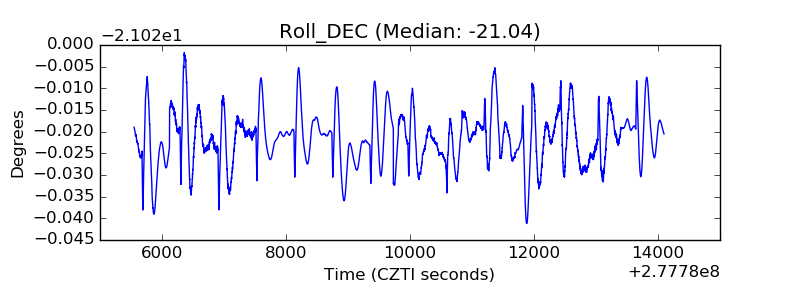 |
| _Roll_RA | 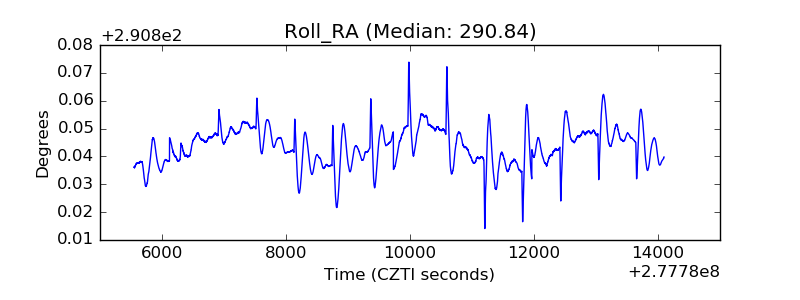 |
| Veto Counter | 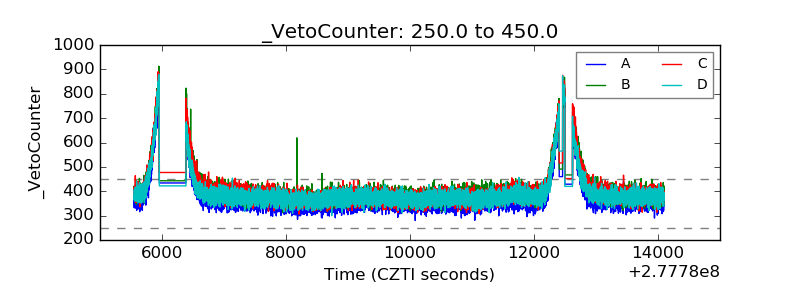 |