| Param | Original file | Final file |
|---|---|---|
| Filename | modeM0/AS1T03_018T01_9000002442_16570cztM0_level2.evt | modeM0/AS1T03_018T01_9000002442_16570cztM0_level2_quad_clean.evt |
| Size (bytes) | 557,953,920 | 91,661,760 |
| Size | 532.1 MB | 87.4 MB |
| Events in quadrant A | 3,563,259 | 586,390 |
| Events in quadrant B | 3,911,113 | 605,104 |
| Events in quadrant C | 4,591,895 | 579,666 |
| Events in quadrant D | 4,384,459 | 544,562 |
| Mode M0 | |||
|---|---|---|---|
| Quadrant | BADHDUFLAG | Total packets | Discarded packets |
| A | 0 | 15031 | 3 |
| B | 0 | 15968 | 2 |
| C | 0 | 18223 | 2 |
| D | 0 | 17577 | 2 |
| Mode M9 | |||
|---|---|---|---|
| Quadrant | BADHDUFLAG | Total packets | Discarded packets |
| A | 0 | 13 | 0 |
| B | 0 | 13 | 0 |
| C | 0 | 13 | 0 |
| D | 0 | 14 | 0 |
| Mode SS | |||
|---|---|---|---|
| Quadrant | BADHDUFLAG | Total packets | Discarded packets |
| A | 0 | 132 | 0 |
| B | 0 | 132 | 0 |
| C | 0 | 132 | 0 |
| D | 0 | 132 | 0 |
| Quadrant | Total seconds | Saturated seconds | Saturation percentage |
|---|---|---|---|
| A | 6600 | 214 | 3.242424% |
| B | 6600 | 154 | 2.333333% |
| C | 6600 | 137 | 2.075758% |
| D | 6600 | 403 | 6.106061% |
Noise dominated data is calculated using 1-second bins in cleaned event files. If a bin has >2000 counts, and if more than 50% of those come from <1% of pixels, then it is considered to be noise-dominated and hence unusable.
| Quadrant | # 1 sec bins | Bins with >0 counts | Bins with >2000 counts | High rate bins dominated by noise | Noise dominated (total time) | Noise dominated (detector-on time) | Marked lightcurve |
|---|---|---|---|---|---|---|---|
| A | 7726 | 6602 | 138 | 138 | 1.79% | 2.09% | 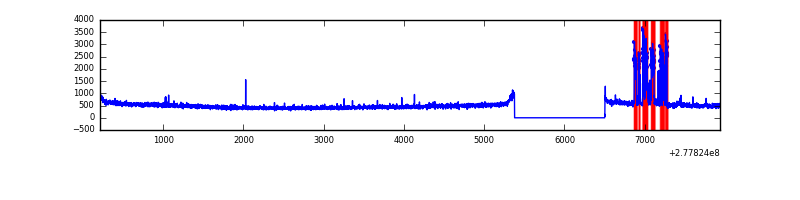 |
| B | 7726 | 6602 | 51 | 51 | 0.66% | 0.77% | 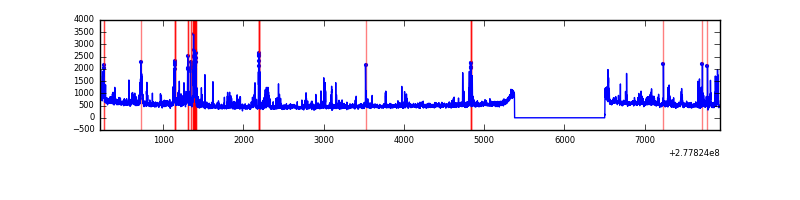 |
| C | 7726 | 6602 | 2 | 2 | 0.03% | 0.03% | 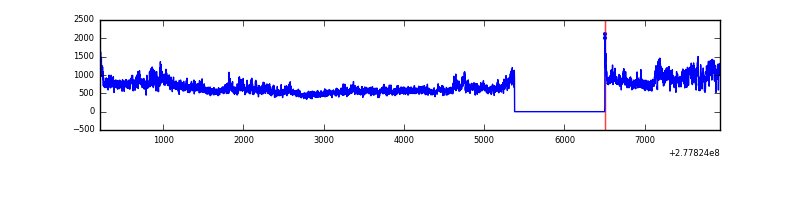 |
| D | 7726 | 6602 | 324 | 324 | 4.19% | 4.91% | 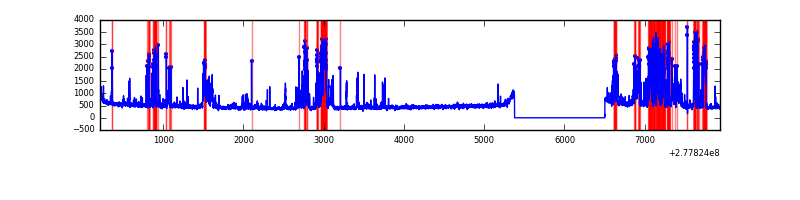 |
Top three noisy pixels from each quadrant. If the there are fewer than three noisy pixels in the level2.evt file, extra rows are filled as -1
| Pixel properties | Quadrant properties | ||||||
|---|---|---|---|---|---|---|---|
| Quadrant | DetID | PixID | Counts | Sigma | Mean | Median | Sigma |
| A | 15 | 174 | 398247 | 2437.14 | 810 | 794 | 163.1 |
| A | 11 | 29 | 29301 | 174.8 | 810 | 794 | 163.1 |
| A | 15 | 223 | 13690 | 79.08 | 810 | 794 | 163.1 |
| B | 15 | 35 | 196396 | 1252.62 | 819 | 802 | 156.1 |
| B | 7 | 220 | 166939 | 1063.97 | 819 | 802 | 156.1 |
| B | 0 | 85 | 90788 | 576.29 | 819 | 802 | 156.1 |
| C | 3 | 233 | 1405549 | 7703.24 | 778 | 785 | 182.4 |
| C | 14 | 238 | 118923 | 647.83 | 778 | 785 | 182.4 |
| C | 7 | 247 | 33393 | 178.81 | 778 | 785 | 182.4 |
| D | 10 | 70 | 688393 | 3622.64 | 774 | 750 | 189.8 |
| D | 2 | 33 | 450821 | 2371.06 | 774 | 750 | 189.8 |
| D | 7 | 38 | 267647 | 1406.07 | 774 | 750 | 189.8 |
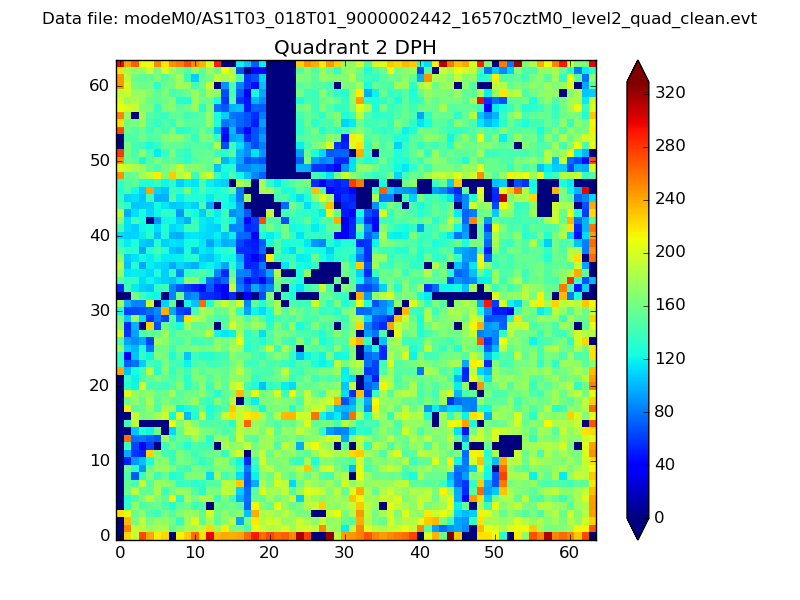
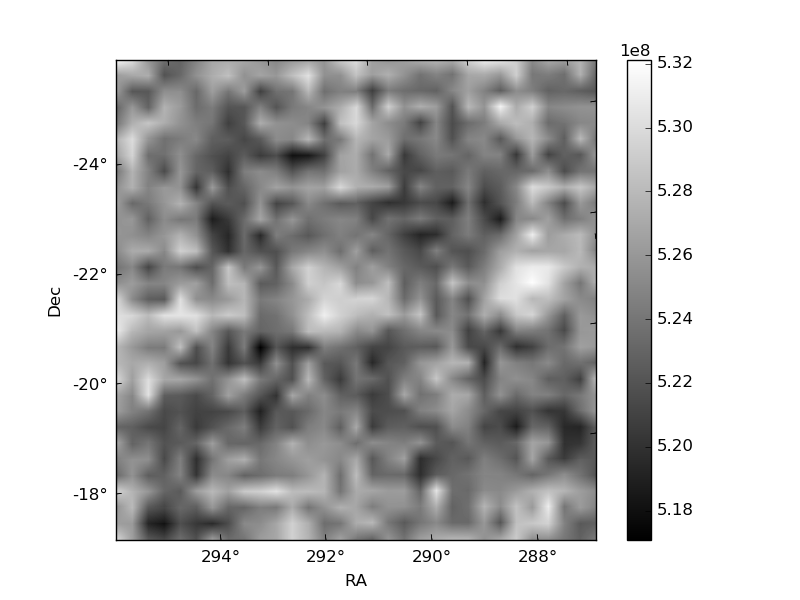
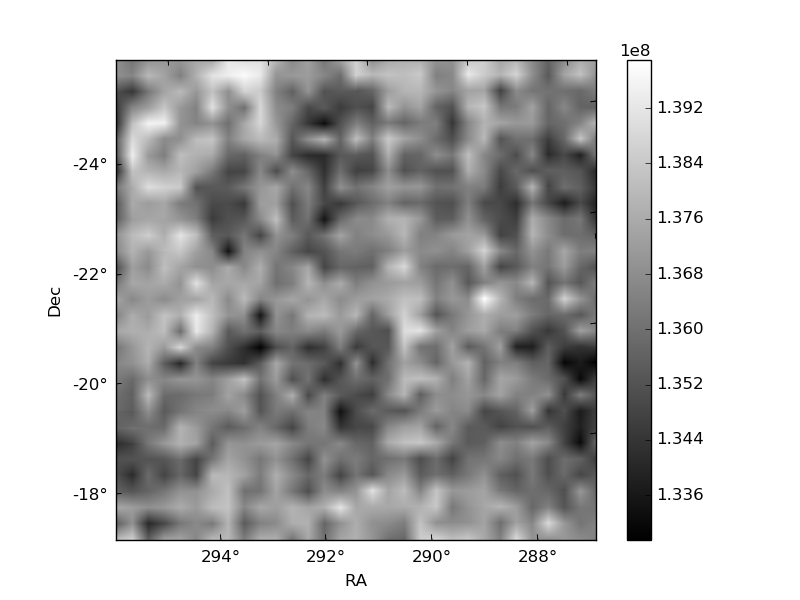
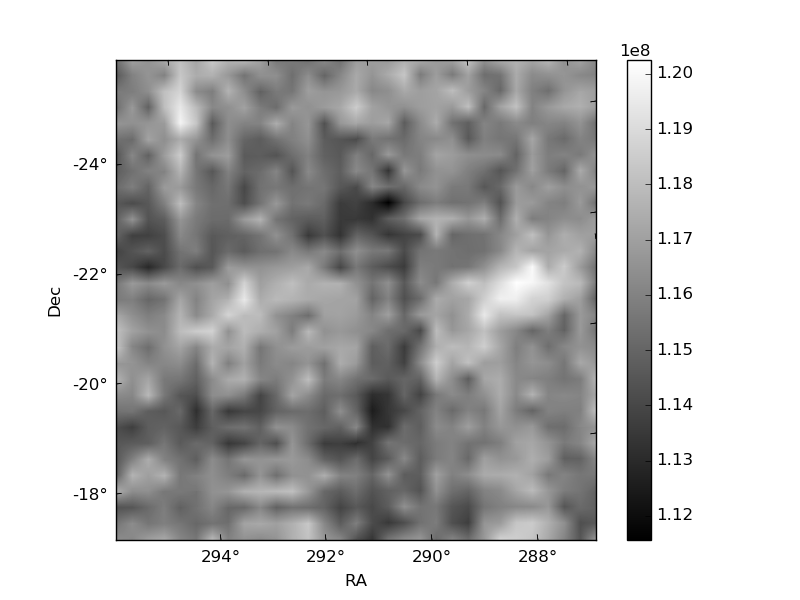
Histogram calculated using DETX and DETY for each event in the final _common_clean file
| Quadrant A | 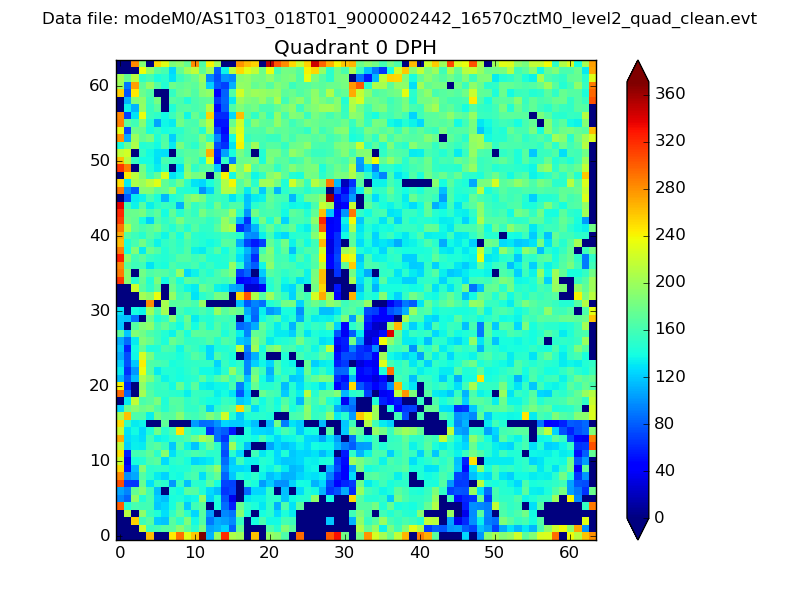 |
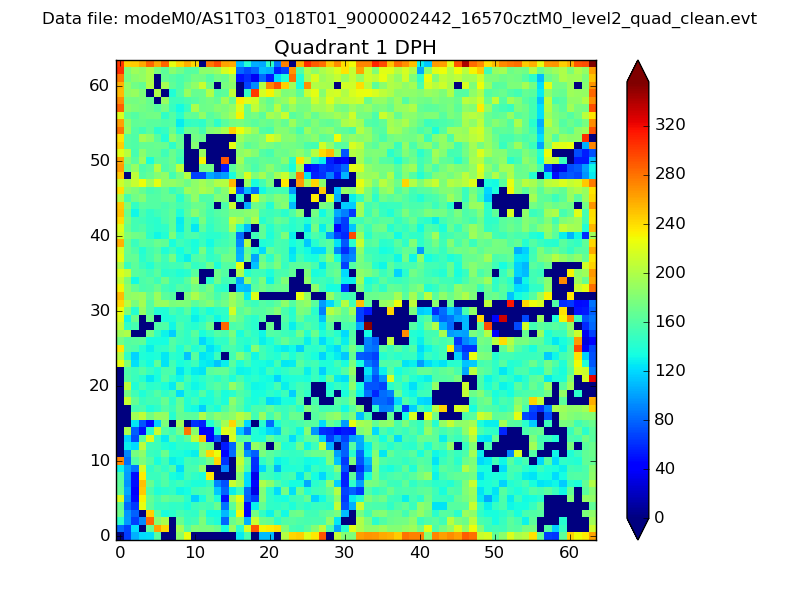 |
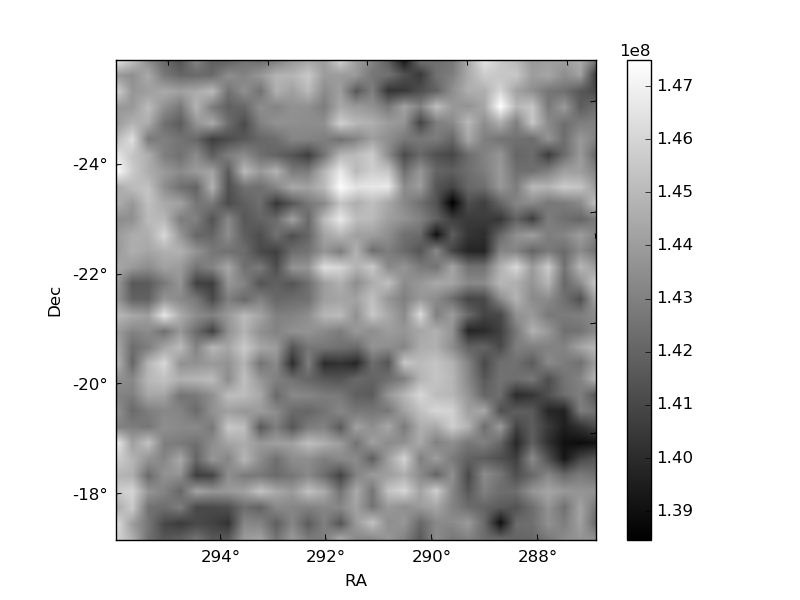
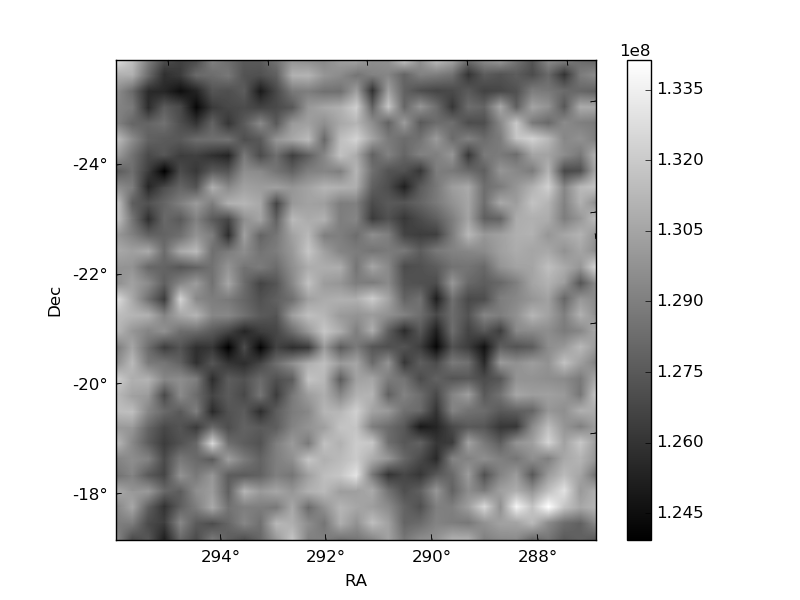
Quadrant B |
|---|---|---|---|
| Quadrant D | 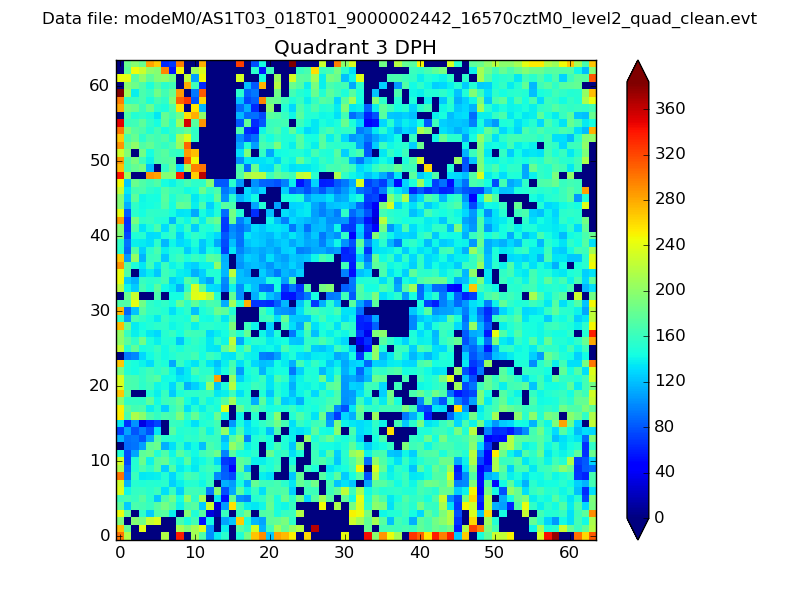 |
 |
Quadrant C |
| Plot type | Count rate plots | Images |
|---|---|---|
| Comparison with Poisson distribution Blue bars denote a histogram of data divided into 1 sec bins. Red curve is a Poisson curve with rate = median count rate of data. |
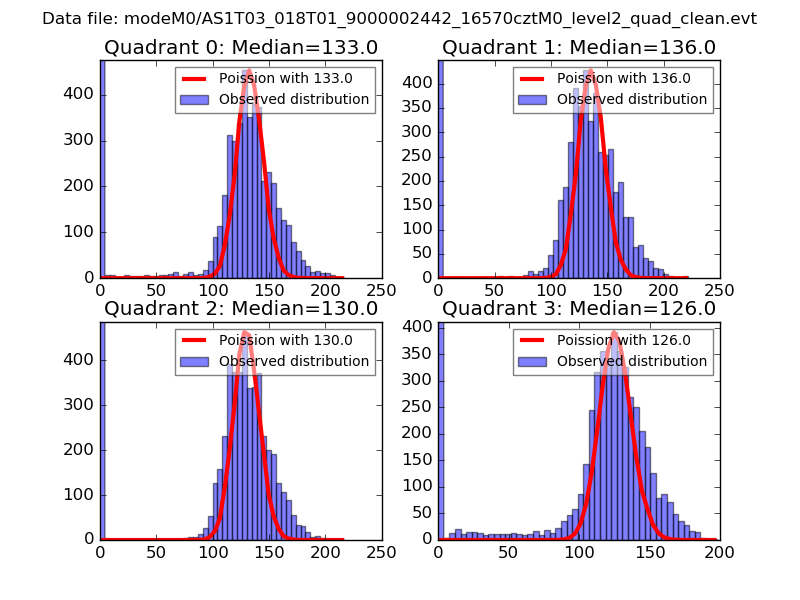 |
 |
| Quadrant-wise count rates Data is divided into 100 sec bins |
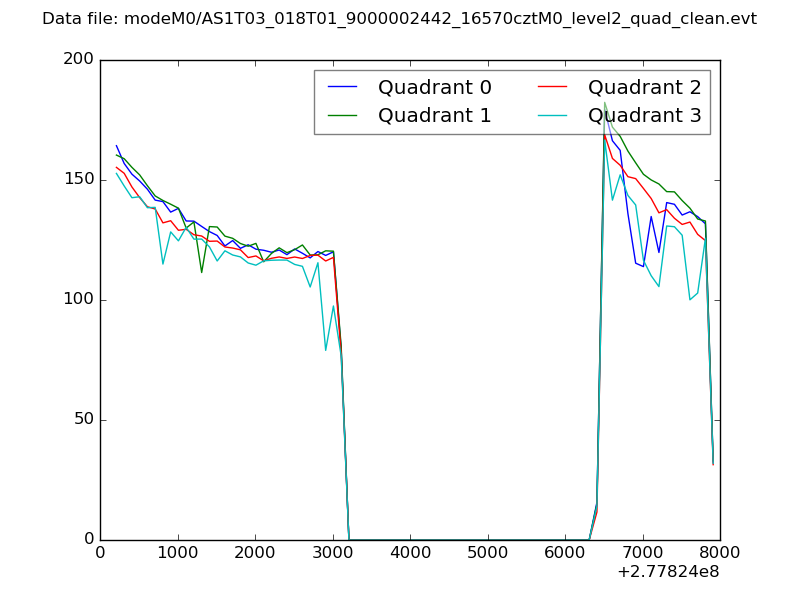 |
|
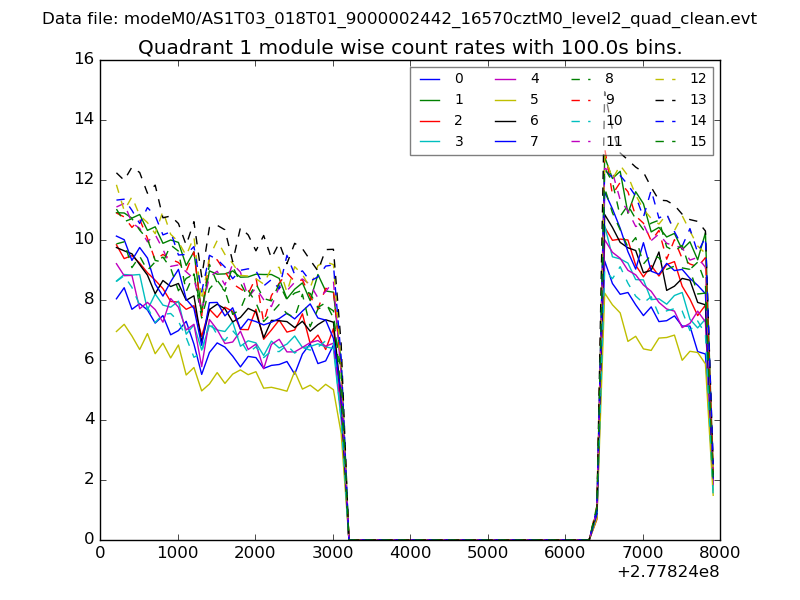
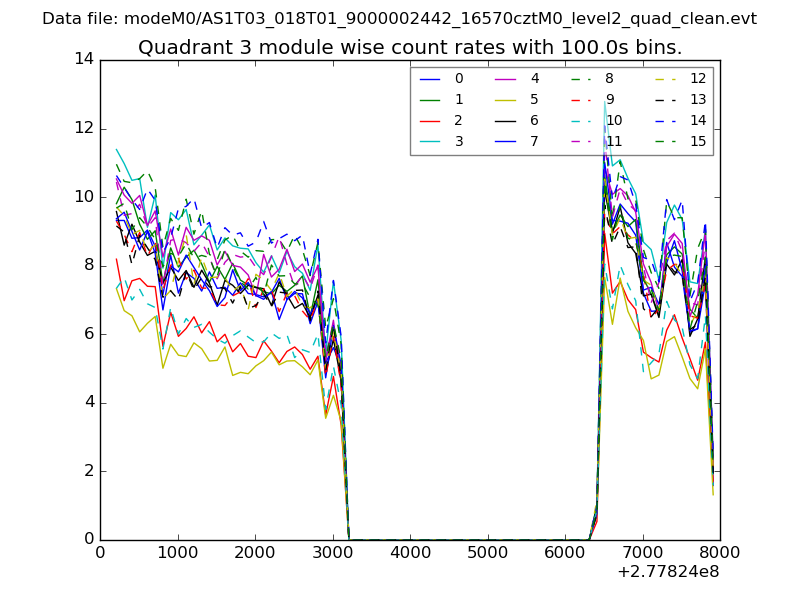
| Module-wise count rates for Quadrant A Data is divided into 100 sec bins |
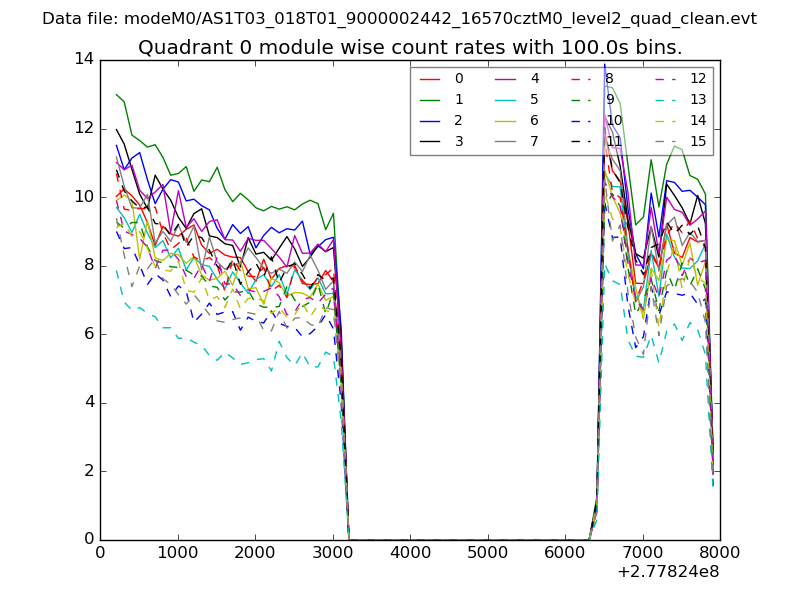 |
 |
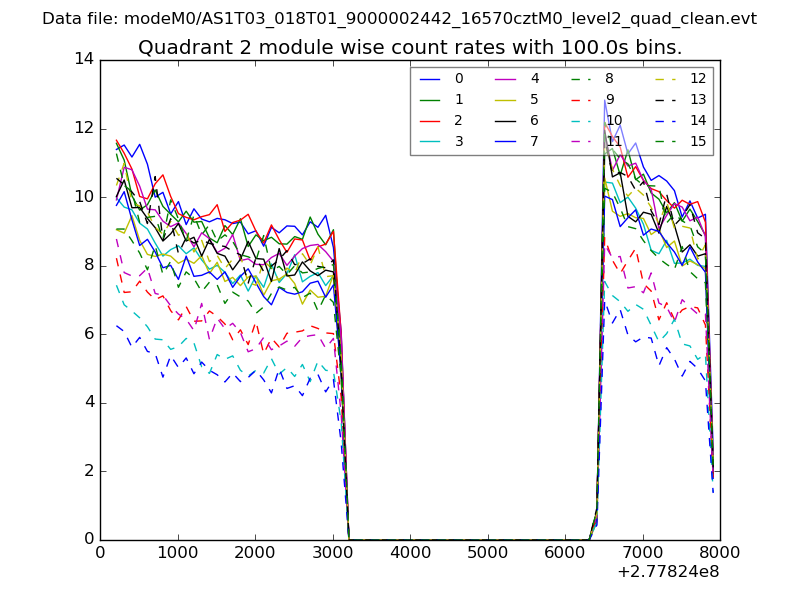
| Module-wise count rates for Quadrant B Data is divided into 100 sec bins |
 |
 |
| Module-wise count rates for Quadrant C Data is divided into 100 sec bins |
 |
 |
| Module-wise count rates for Quadrant D Data is divided into 100 sec bins |
 |
 |
| Parameter | Plot |
|---|---|
| CZT HV Monitor | 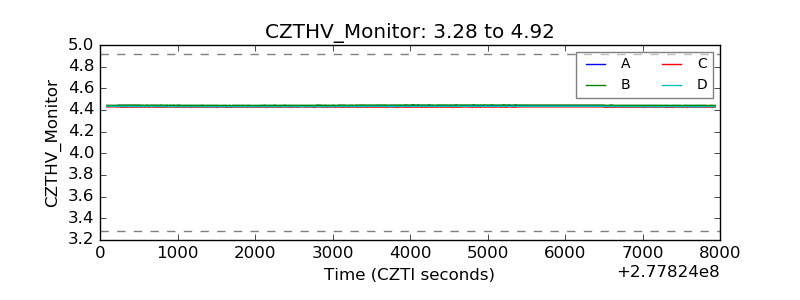 |
| D_VDD | 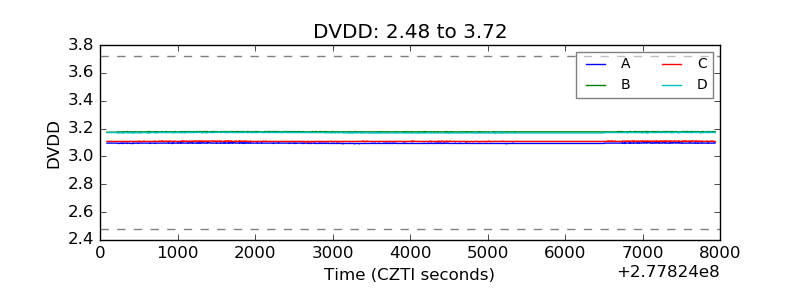 |
| Temperature 1 | 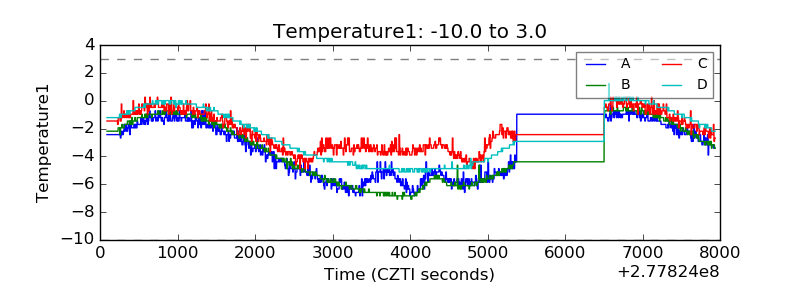 |
| Veto HV Monitor | 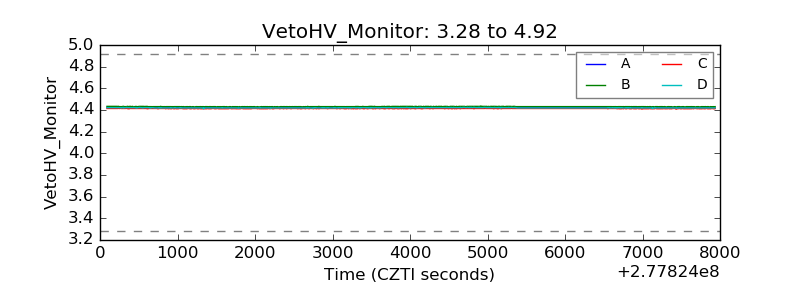 |
| Veto LLD | 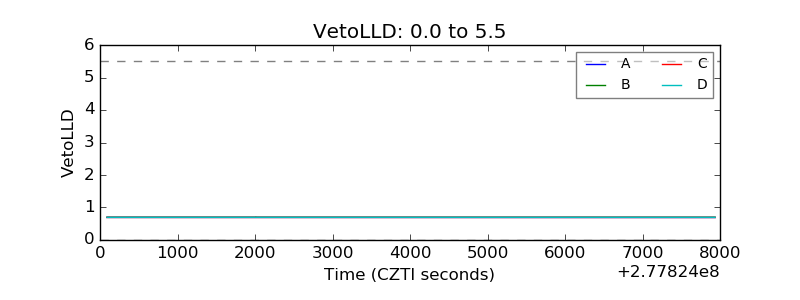 |
| Alpha Counter | 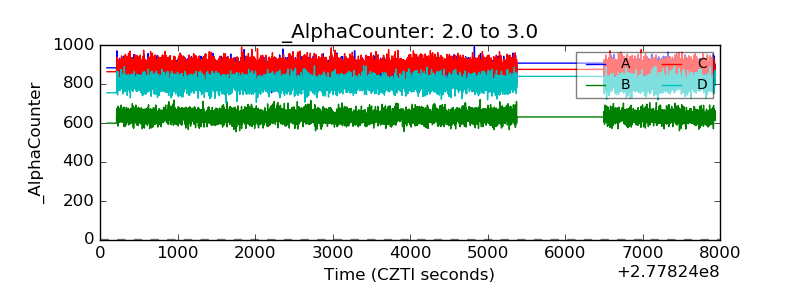 |
| _CPM_Rate | 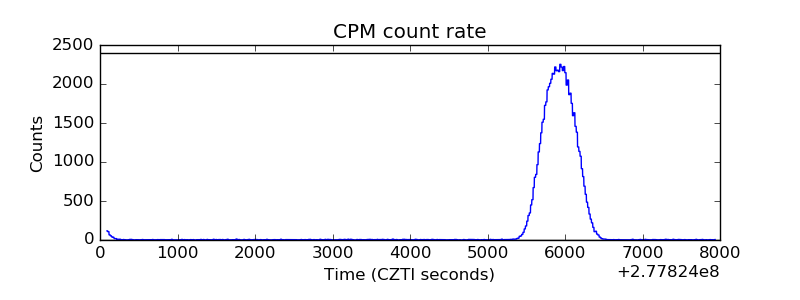 |
| CZT Counter | 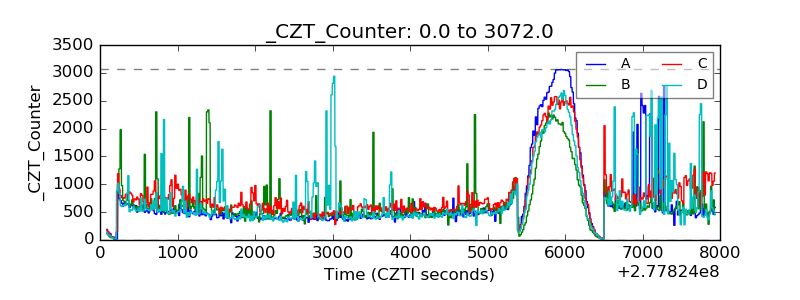 |
| +2.5 Volts monitor |  |
| +5 Volts monitor |  |
| _ROLL_ROT | 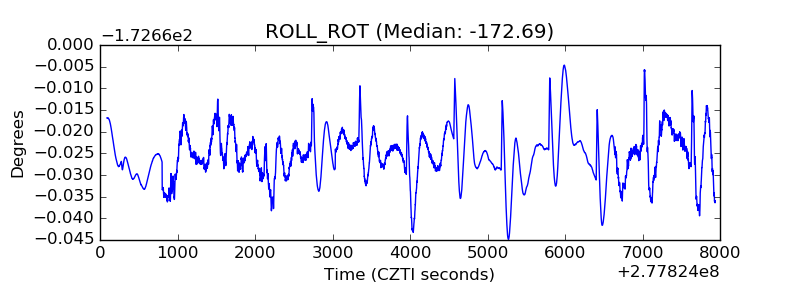 |
| _Roll_DEC |  |
| _Roll_RA | 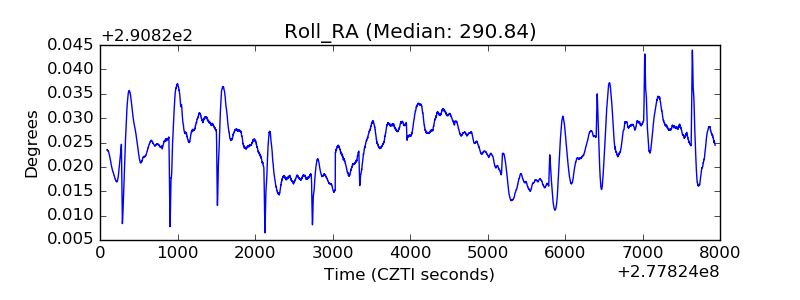 |
| Veto Counter |  |