| Param | Original file | Final file |
|---|---|---|
| Filename | modeM0/AS1T03_018T01_9000002442_16571cztM0_level2.evt | modeM0/AS1T03_018T01_9000002442_16571cztM0_level2_quad_clean.evt |
| Size (bytes) | 588,312,000 | 86,492,160 |
| Size | 561.1 MB | 82.5 MB |
| Events in quadrant A | 3,677,302 | 572,752 |
| Events in quadrant B | 3,776,153 | 602,053 |
| Events in quadrant C | 4,634,741 | 568,210 |
| Events in quadrant D | 5,300,216 | 434,312 |
| Mode M0 | |||
|---|---|---|---|
| Quadrant | BADHDUFLAG | Total packets | Discarded packets |
| A | 0 | 14905 | 3 |
| B | 0 | 15266 | 2 |
| C | 0 | 18249 | 2 |
| D | 0 | 20000 | 2 |
| Mode M9 | |||
|---|---|---|---|
| Quadrant | BADHDUFLAG | Total packets | Discarded packets |
| A | 0 | 16 | 0 |
| B | 0 | 16 | 0 |
| C | 0 | 16 | 0 |
| D | 0 | 17 | 0 |
| Mode SS | |||
|---|---|---|---|
| Quadrant | BADHDUFLAG | Total packets | Discarded packets |
| A | 0 | 128 | 0 |
| B | 0 | 128 | 0 |
| C | 0 | 128 | 0 |
| D | 0 | 128 | 0 |
| Quadrant | Total seconds | Saturated seconds | Saturation percentage |
|---|---|---|---|
| A | 6325 | 238 | 3.762846% |
| B | 6325 | 80 | 1.264822% |
| C | 6325 | 141 | 2.229249% |
| D | 6325 | 1386 | 21.913043% |
Noise dominated data is calculated using 1-second bins in cleaned event files. If a bin has >2000 counts, and if more than 50% of those come from <1% of pixels, then it is considered to be noise-dominated and hence unusable.
| Quadrant | # 1 sec bins | Bins with >0 counts | Bins with >2000 counts | High rate bins dominated by noise | Noise dominated (total time) | Noise dominated (detector-on time) | Marked lightcurve |
|---|---|---|---|---|---|---|---|
| A | 7546 | 6327 | 162 | 162 | 2.15% | 2.56% | 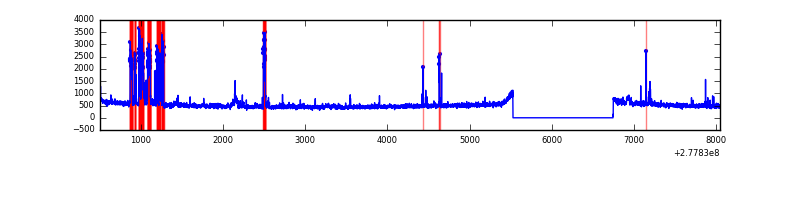 |
| B | 7546 | 6327 | 15 | 15 | 0.20% | 0.24% | 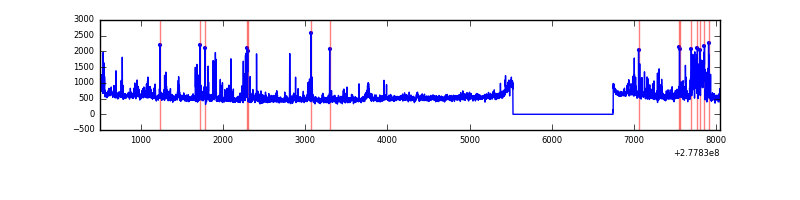 |
| C | 7546 | 6327 | 2 | 2 | 0.03% | 0.03% | 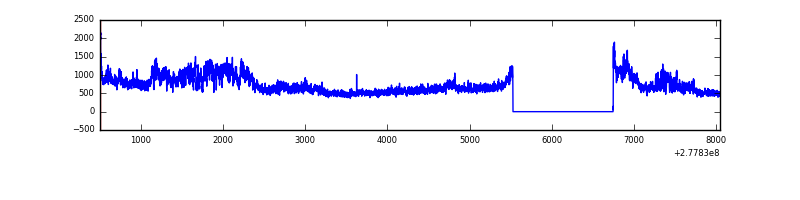 |
| D | 7545 | 6325 | 563 | 563 | 7.46% | 8.90% | 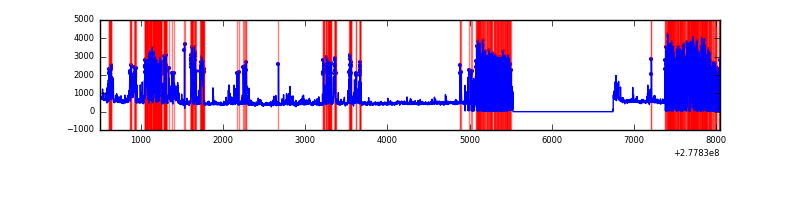 |
Top three noisy pixels from each quadrant. If the there are fewer than three noisy pixels in the level2.evt file, extra rows are filled as -1
| Pixel properties | Quadrant properties | ||||||
|---|---|---|---|---|---|---|---|
| Quadrant | DetID | PixID | Counts | Sigma | Mean | Median | Sigma |
| A | 15 | 174 | 506252 | 3150.77 | 791 | 775 | 160.4 |
| A | 11 | 29 | 93414 | 577.44 | 791 | 775 | 160.4 |
| A | 9 | 143 | 31602 | 192.15 | 791 | 775 | 160.4 |
| B | 15 | 35 | 282966 | 1856.55 | 808 | 791 | 152.0 |
| B | 7 | 220 | 110166 | 719.62 | 808 | 791 | 152.0 |
| B | 0 | 229 | 96498 | 629.7 | 808 | 791 | 152.0 |
| C | 3 | 233 | 1526234 | 8596.57 | 762 | 768 | 177.5 |
| C | 14 | 238 | 117561 | 658.17 | 762 | 768 | 177.5 |
| C | 7 | 247 | 18048 | 97.38 | 762 | 768 | 177.5 |
| D | 1 | 52 | 1588439 | 10140.17 | 634 | 616 | 156.6 |
| D | 10 | 70 | 532681 | 3397.88 | 634 | 616 | 156.6 |
| D | 2 | 33 | 345465 | 2202.28 | 634 | 616 | 156.6 |
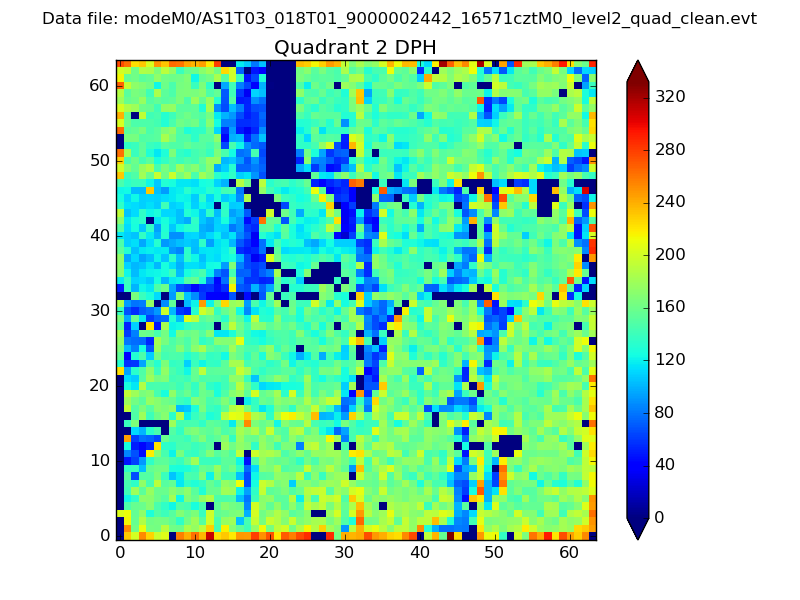
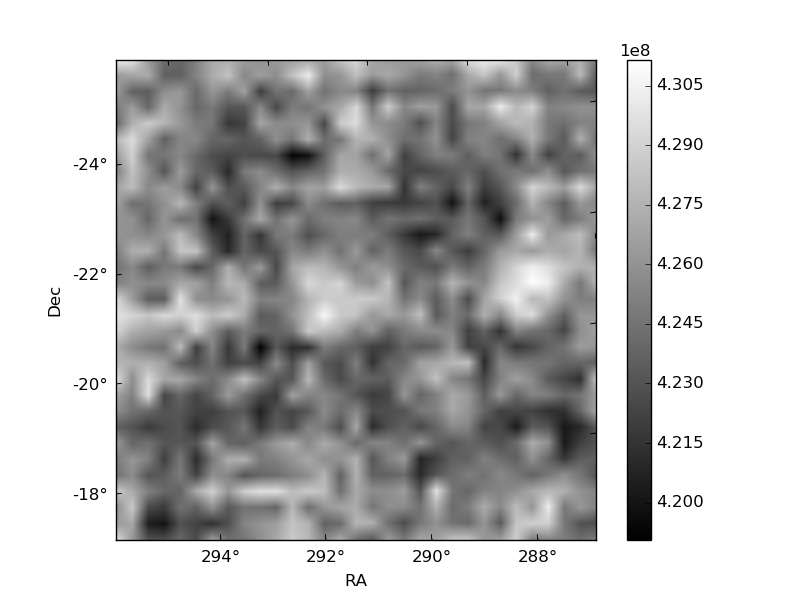
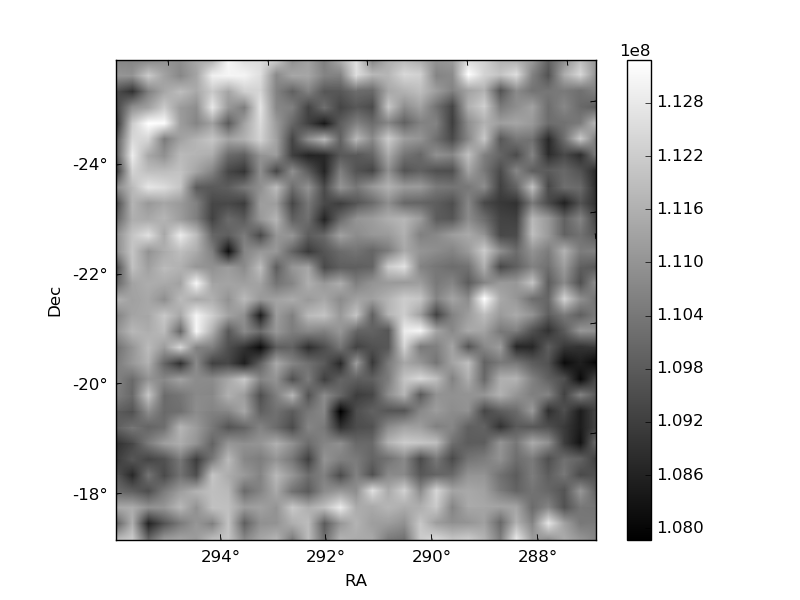
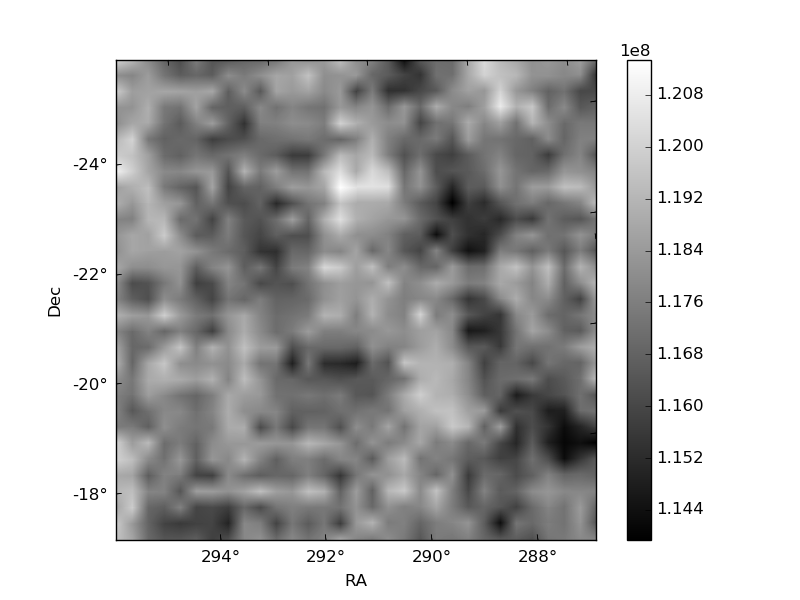
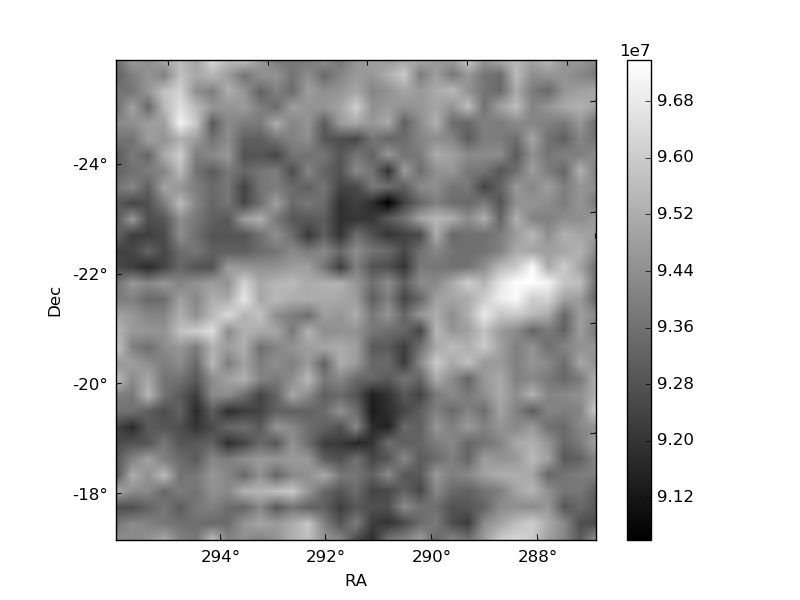
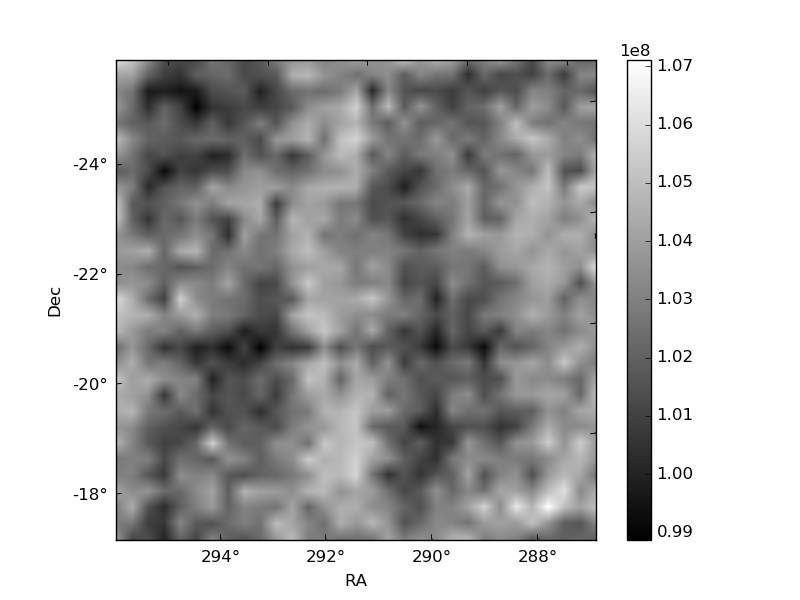
Histogram calculated using DETX and DETY for each event in the final _common_clean file
| Quadrant A | 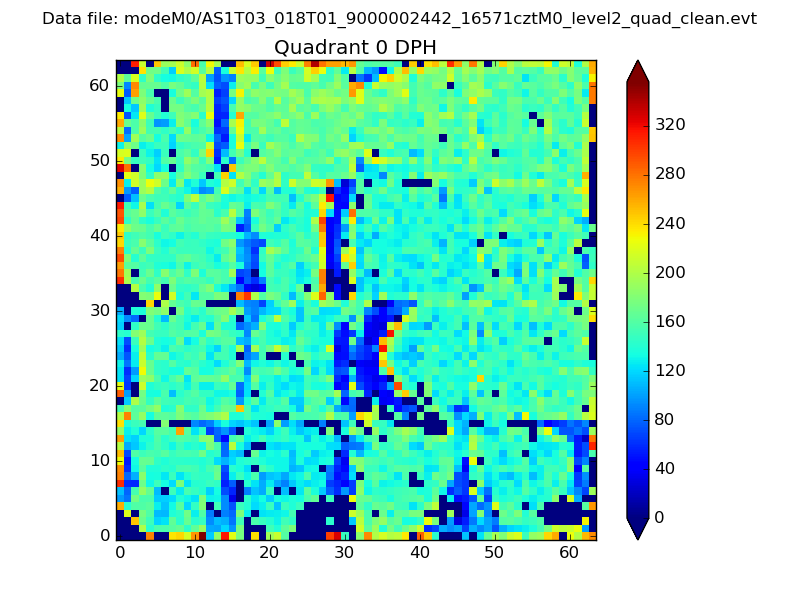 |
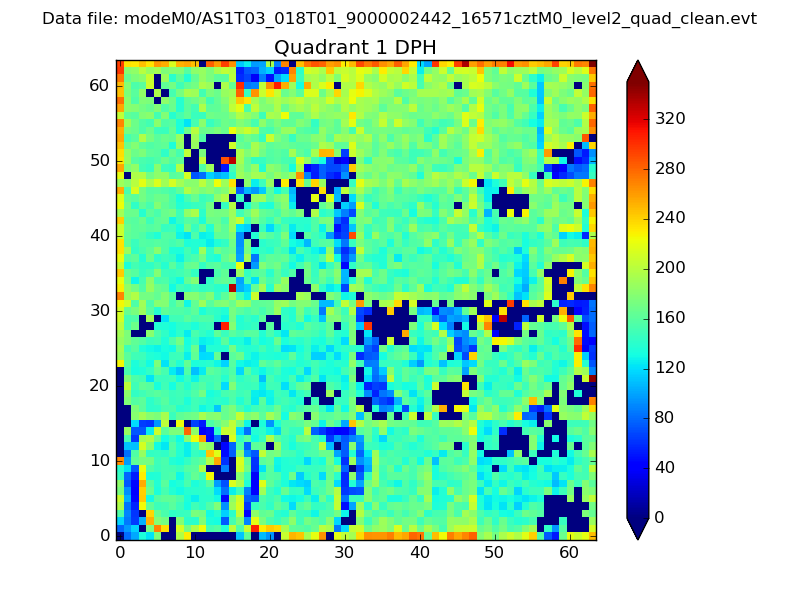 |
Quadrant B |
|---|---|---|---|
| Quadrant D | 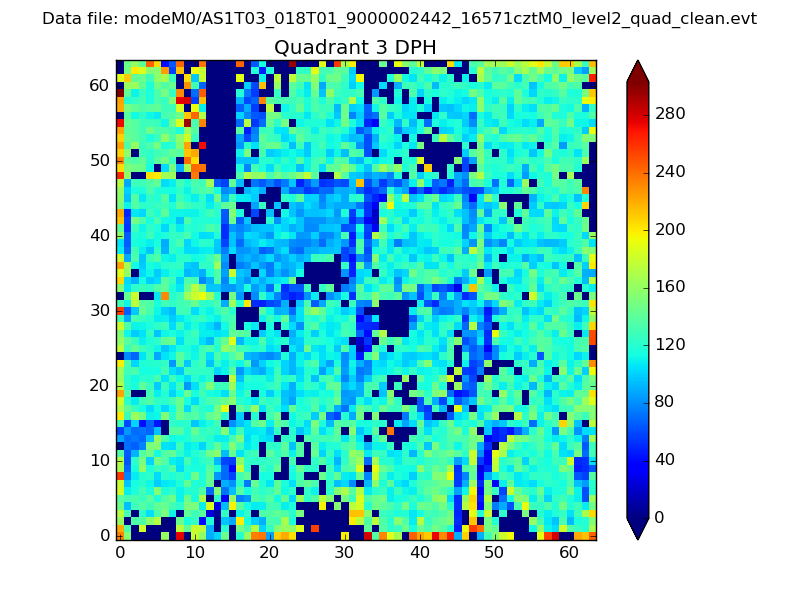 |
 |
Quadrant C |
| Plot type | Count rate plots | Images |
|---|---|---|
| Comparison with Poisson distribution Blue bars denote a histogram of data divided into 1 sec bins. Red curve is a Poisson curve with rate = median count rate of data. |
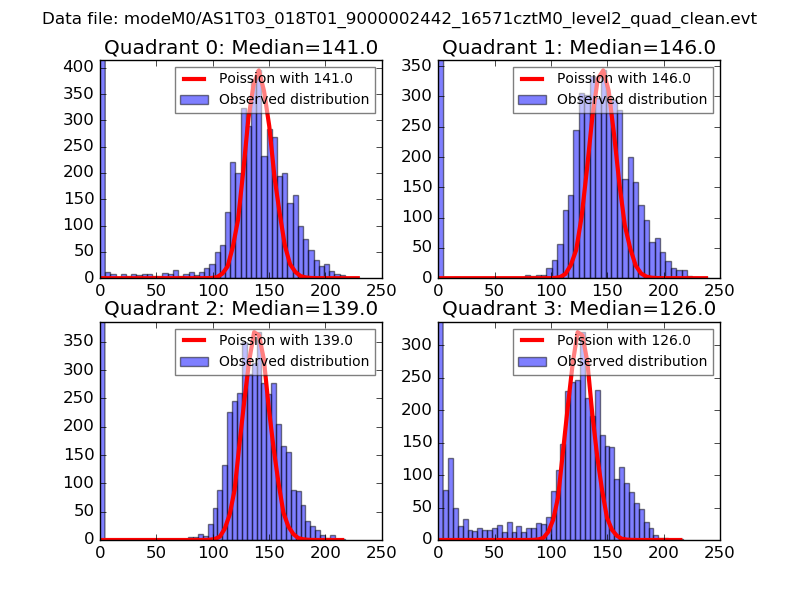 |
 |
| Quadrant-wise count rates Data is divided into 100 sec bins |
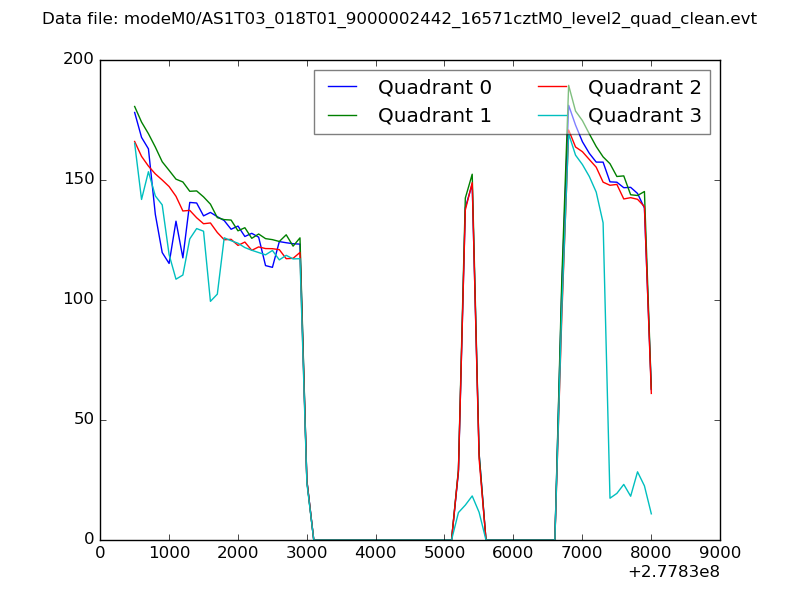 |
|
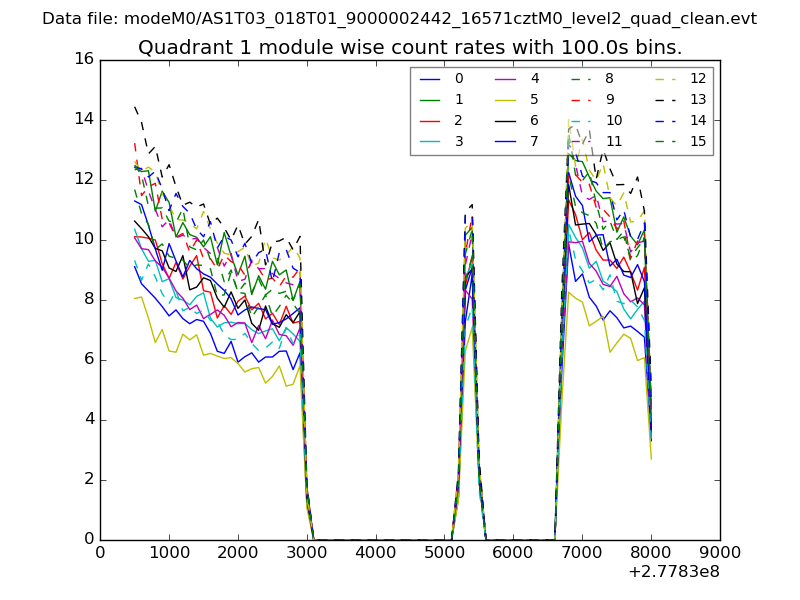
| Module-wise count rates for Quadrant A Data is divided into 100 sec bins |
 |
 |
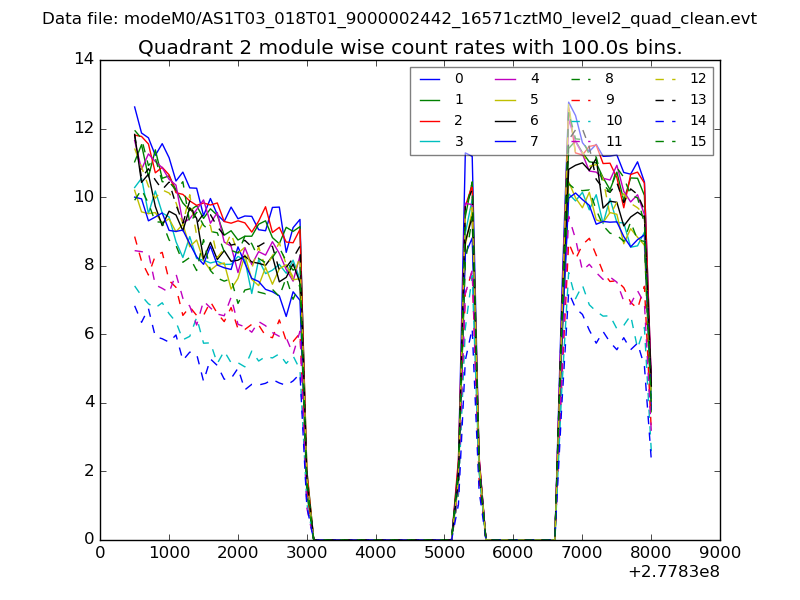
| Module-wise count rates for Quadrant B Data is divided into 100 sec bins |
 |
 |
| Module-wise count rates for Quadrant C Data is divided into 100 sec bins |
 |
 |
| Module-wise count rates for Quadrant D Data is divided into 100 sec bins |
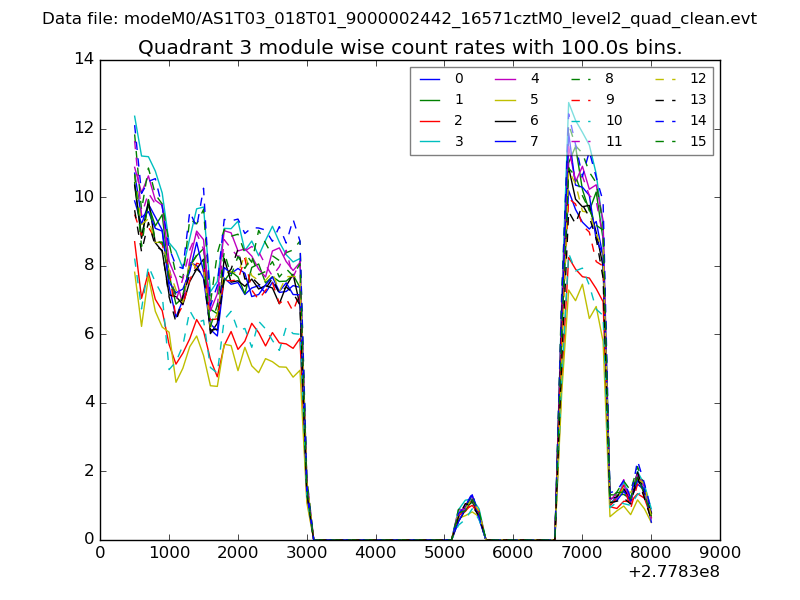 |
 |
| Parameter | Plot |
|---|---|
| CZT HV Monitor | 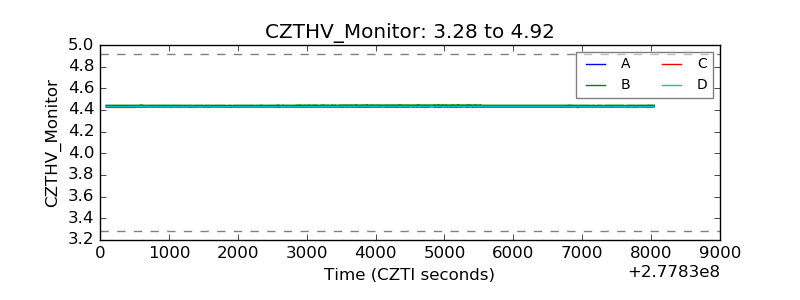 |
| D_VDD | 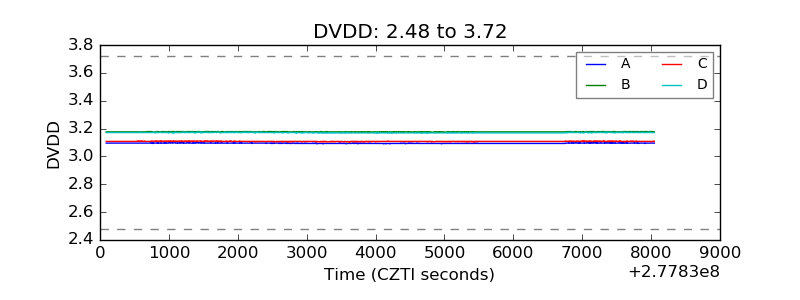 |
| Temperature 1 | 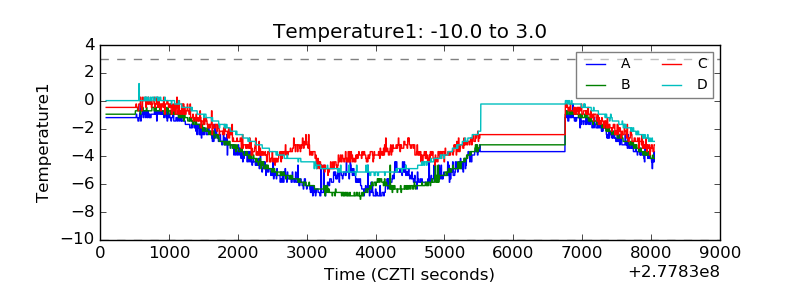 |
| Veto HV Monitor | 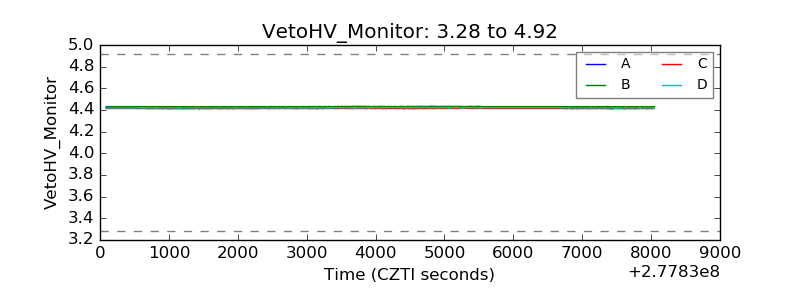 |
| Veto LLD |  |
| Alpha Counter | 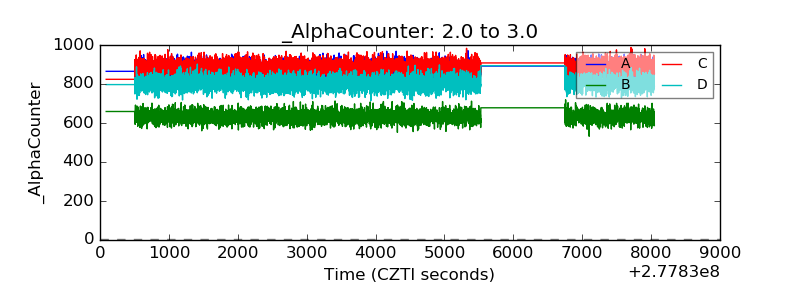 |
| _CPM_Rate | 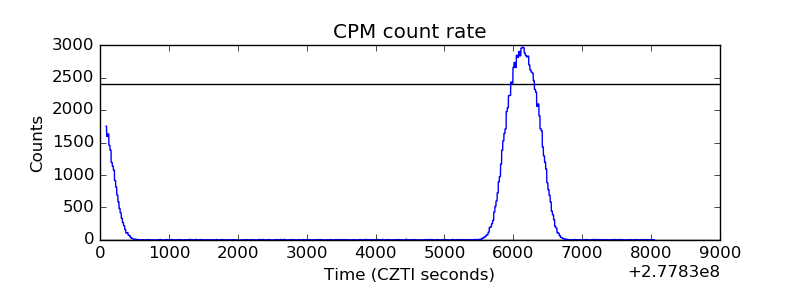 |
| CZT Counter | 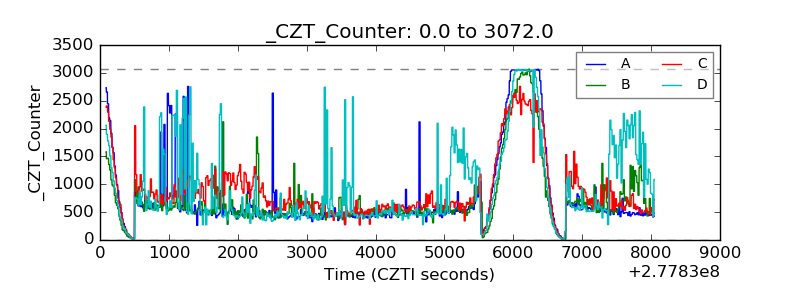 |
| +2.5 Volts monitor |  |
| +5 Volts monitor |  |
| _ROLL_ROT | 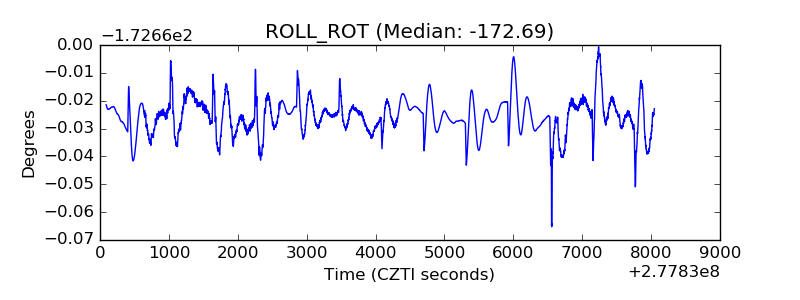 |
| _Roll_DEC | 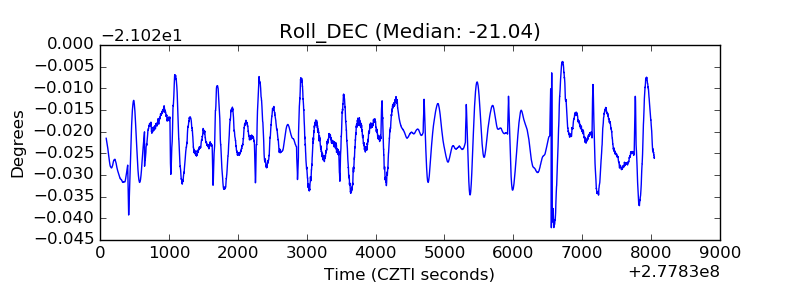 |
| _Roll_RA | 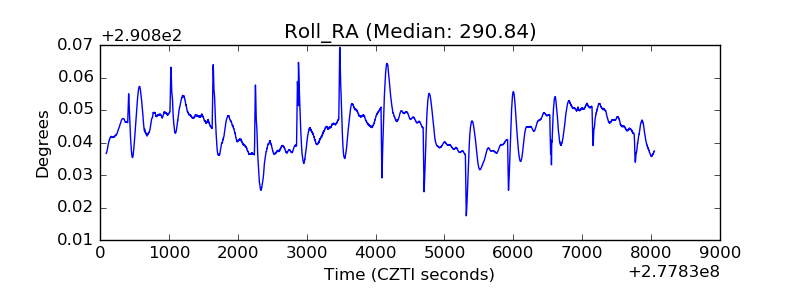 |
| Veto Counter |  |