| Param | Original file | Final file |
|---|---|---|
| Filename | modeM0/AS1T03_020T01_9000002444cztM0_level2.fits | modeM0/AS1T03_020T01_9000002444cztM0_level2_quad_clean.evt |
| Size (bytes) | 471,640,320 | 518,713,920 |
| Size | 449.8 MB | 494.7 MB |
| Events in quadrant A | 2,933,994 | 3,302,173 |
| Events in quadrant B | 2,854,668 | 3,384,956 |
| Events in quadrant C | 2,807,778 | 3,065,447 |
| Events in quadrant D | 2,147,966 | 2,423,886 |
| Mode M9 | |||
|---|---|---|---|
| Quadrant | BADHDUFLAG | Total packets | Discarded packets |
| A | 0 | 82 | 0 |
| B | 0 | 82 | 0 |
| C | 0 | 82 | 0 |
| D | 0 | 82 | 0 |
| Mode SS | |||
|---|---|---|---|
| Quadrant | BADHDUFLAG | Total packets | Discarded packets |
| A | 0 | 1044 | 0 |
| B | 0 | 1044 | 0 |
| C | 0 | 1044 | 0 |
| D | 0 | 1044 | 0 |
| Mode M0 | |||
|---|---|---|---|
| Quadrant | BADHDUFLAG | Total packets | Discarded packets |
| A | 0 | 113581 | 0 |
| B | 0 | 115339 | 0 |
| C | 0 | 165475 | 0 |
| D | 0 | 129040 | 0 |
| Quadrant | Total seconds | Saturated seconds | Saturation percentage |
|---|---|---|---|
| A | 51498 | 1113 | 2.161249% |
| B | 51498 | 797 | 1.547633% |
| C | 51498 | 3499 | 6.794439% |
| D | 51498 | 10430 | 20.253214% |
Noise dominated data is calculated using 1-second bins in cleaned event files. If a bin has >2000 counts, and if more than 50% of those come from <1% of pixels, then it is considered to be noise-dominated and hence unusable.
| Quadrant | # 1 sec bins | Bins with >0 counts | Bins with >2000 counts | High rate bins dominated by noise | Noise dominated (total time) | Noise dominated (detector-on time) | Marked lightcurve |
|---|---|---|---|---|---|---|---|
| A | 71310 | 51500 | 0 | 0 | 0.00% | 0.00% |  |
| B | 71310 | 51499 | 0 | 0 | 0.00% | 0.00% |  |
| C | 71310 | 51499 | 0 | 0 | 0.00% | 0.00% |  |
| D | 71310 | 48956 | 0 | 0 | 0.00% | 0.00% |  |
Top three noisy pixels from each quadrant. If the there are fewer than three noisy pixels in the level2.evt file, extra rows are filled as -1
| Pixel properties | Quadrant properties | ||||||
|---|---|---|---|---|---|---|---|
| Quadrant | DetID | PixID | Counts | Sigma | Mean | Median | Sigma |
| A | 0 | 29 | 2815 | 11.07 | 763 | 718 | 189.4 |
| A | 7 | 110 | 2330 | 8.51 | 763 | 718 | 189.4 |
| A | 9 | 19 | 2230 | 7.98 | 763 | 718 | 189.4 |
| B | 2 | 9 | 2316 | 10.92 | 755 | 722 | 146.0 |
| B | 2 | 8 | 1949 | 8.4 | 755 | 722 | 146.0 |
| B | 14 | 254 | 1884 | 7.96 | 755 | 722 | 146.0 |
| C | 12 | 241 | 2008 | 6.87 | 741 | 690 | 192.0 |
| C | 2 | 191 | 1921 | 6.41 | 741 | 690 | 192.0 |
| C | 7 | 111 | 1892 | 6.26 | 741 | 690 | 192.0 |
| D | 3 | 14 | 1631 | 6.51 | 611 | 553 | 165.5 |
| D | 6 | 231 | 1558 | 6.07 | 611 | 553 | 165.5 |
| D | 10 | 189 | 1534 | 5.93 | 611 | 553 | 165.5 |
Histogram calculated using DETX and DETY for each event in the final _common_clean file
| Quadrant A |  |
 |
Quadrant B |
|---|---|---|---|
| Quadrant D | 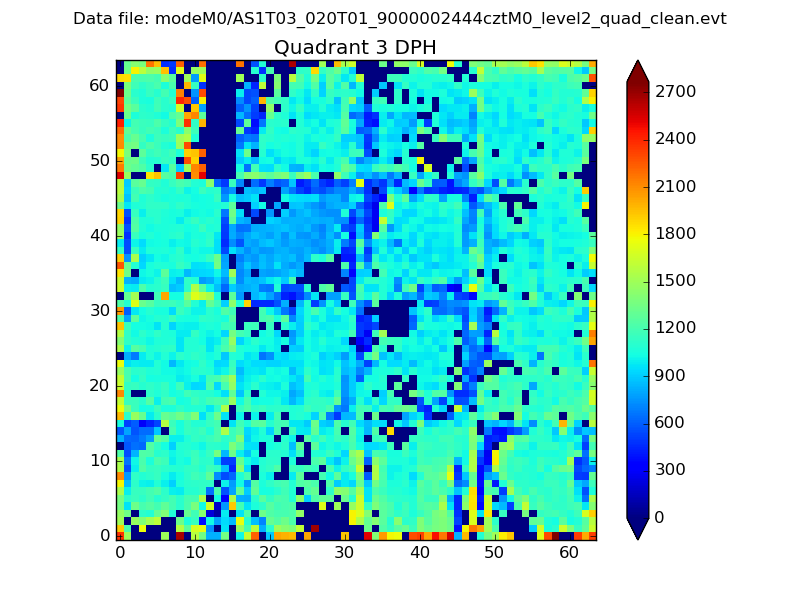 |
 |
Quadrant C |
| Plot type | Count rate plots | Images |
|---|---|---|
| Comparison with Poisson distribution Blue bars denote a histogram of data divided into 1 sec bins. Red curve is a Poisson curve with rate = median count rate of data. |
 |
 |
| Quadrant-wise count rates Data is divided into 100 sec bins |
 |
|
| Module-wise count rates for Quadrant A Data is divided into 100 sec bins |
 |
 |
| Module-wise count rates for Quadrant B Data is divided into 100 sec bins |
 |
 |
| Module-wise count rates for Quadrant C Data is divided into 100 sec bins |
 |
 |
| Module-wise count rates for Quadrant D Data is divided into 100 sec bins |
 |
 |
| Parameter | Plot |
|---|---|
| CZT HV Monitor |  |
| D_VDD |  |
| Temperature 1 |  |
| Veto HV Monitor | 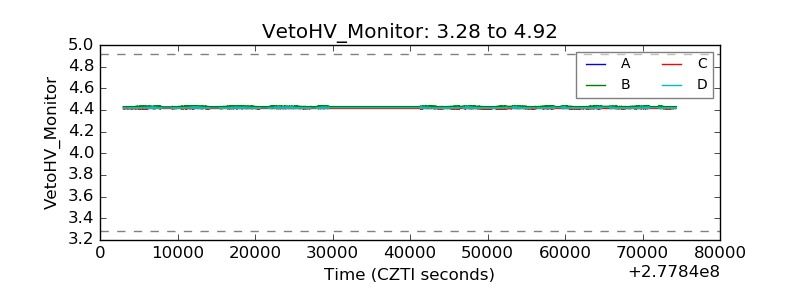 |
| Veto LLD |  |
| Alpha Counter |  |
| _CPM_Rate |  |
| CZT Counter |  |
| +2.5 Volts monitor |  |
| +5 Volts monitor |  |
| _ROLL_ROT |  |
| _Roll_DEC | 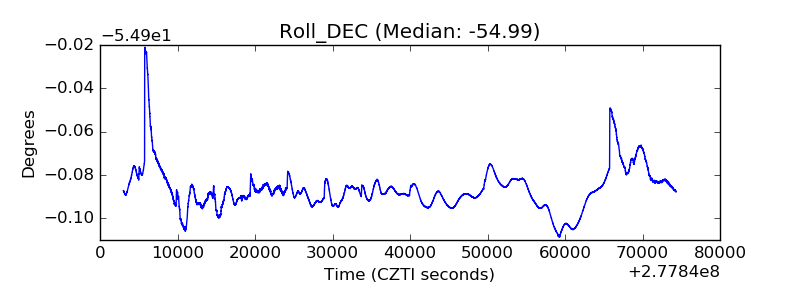 |
| _Roll_RA |  |
| Veto Counter |  |