| Param | Original file | Final file |
|---|---|---|
| Filename | modeM0/AS1T03_020T01_9000002444_16573cztM0_level2.evt | modeM0/AS1T03_020T01_9000002444_16573cztM0_level2_quad_clean.evt |
| Size (bytes) | 499,484,160 | 110,589,120 |
| Size | 476.3 MB | 105.5 MB |
| Events in quadrant A | 2,981,402 | 778,582 |
| Events in quadrant B | 3,440,884 | 801,588 |
| Events in quadrant C | 4,042,324 | 747,053 |
| Events in quadrant D | 4,248,805 | 597,071 |
| Mode M9 | |||
|---|---|---|---|
| Quadrant | BADHDUFLAG | Total packets | Discarded packets |
| A | 0 | 13 | 0 |
| B | 0 | 13 | 0 |
| C | 0 | 13 | 0 |
| D | 0 | 13 | 0 |
| Mode SS | |||
|---|---|---|---|
| Quadrant | BADHDUFLAG | Total packets | Discarded packets |
| A | 0 | 124 | 0 |
| B | 0 | 124 | 0 |
| C | 0 | 124 | 0 |
| D | 0 | 124 | 0 |
| Mode M0 | |||
|---|---|---|---|
| Quadrant | BADHDUFLAG | Total packets | Discarded packets |
| A | 0 | 12842 | 3 |
| B | 0 | 14177 | 2 |
| C | 0 | 16274 | 2 |
| D | 0 | 16852 | 2 |
| Quadrant | Total seconds | Saturated seconds | Saturation percentage |
|---|---|---|---|
| A | 6079 | 52 | 0.855404% |
| B | 6079 | 118 | 1.941109% |
| C | 6079 | 141 | 2.319460% |
| D | 6079 | 1446 | 23.786807% |
Noise dominated data is calculated using 1-second bins in cleaned event files. If a bin has >2000 counts, and if more than 50% of those come from <1% of pixels, then it is considered to be noise-dominated and hence unusable.
| Quadrant | # 1 sec bins | Bins with >0 counts | Bins with >2000 counts | High rate bins dominated by noise | Noise dominated (total time) | Noise dominated (detector-on time) | Marked lightcurve |
|---|---|---|---|---|---|---|---|
| A | 7410 | 6081 | 0 | 0 | 0.00% | 0.00% | 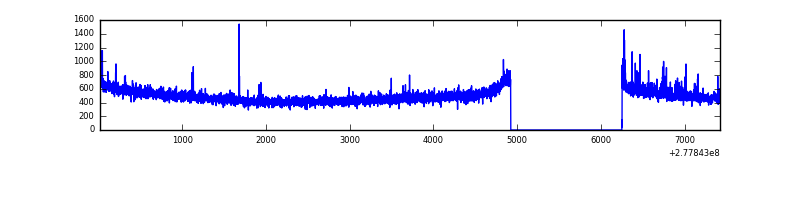 |
| B | 7410 | 6081 | 11 | 11 | 0.15% | 0.18% | 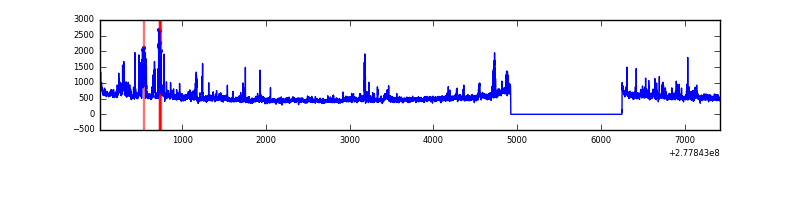 |
| C | 7410 | 6081 | 1 | 1 | 0.01% | 0.02% | 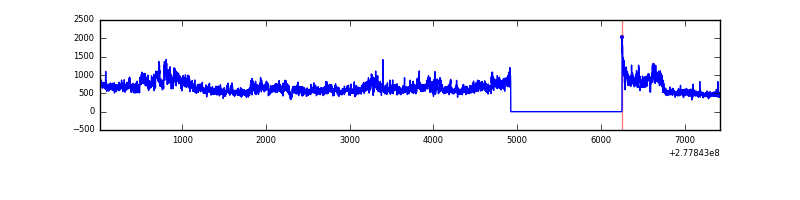 |
| D | 7410 | 6079 | 353 | 353 | 4.76% | 5.81% | 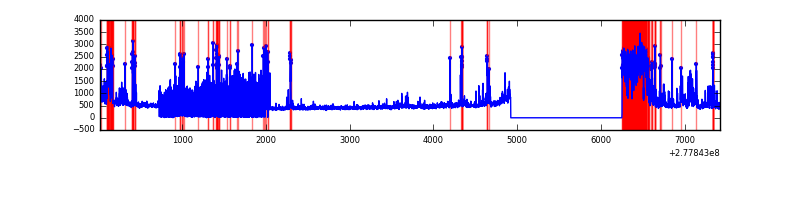 |
Top three noisy pixels from each quadrant. If the there are fewer than three noisy pixels in the level2.evt file, extra rows are filled as -1
| Pixel properties | Quadrant properties | ||||||
|---|---|---|---|---|---|---|---|
| Quadrant | DetID | PixID | Counts | Sigma | Mean | Median | Sigma |
| A | 2 | 79 | 30485 | 193.07 | 763 | 749 | 154.0 |
| A | 9 | 143 | 12893 | 78.85 | 763 | 749 | 154.0 |
| A | 0 | 226 | 6764 | 39.05 | 763 | 749 | 154.0 |
| B | 15 | 35 | 227133 | 1598.86 | 772 | 756 | 141.6 |
| B | 0 | 197 | 55777 | 388.6 | 772 | 756 | 141.6 |
| B | 0 | 85 | 32020 | 220.81 | 772 | 756 | 141.6 |
| C | 3 | 233 | 1059920 | 6293.19 | 730 | 736 | 168.3 |
| C | 14 | 238 | 116721 | 689.13 | 730 | 736 | 168.3 |
| C | 7 | 247 | 15702 | 88.92 | 730 | 736 | 168.3 |
| D | 2 | 33 | 823060 | 5433.64 | 624 | 606 | 151.4 |
| D | 1 | 52 | 584394 | 3856.86 | 624 | 606 | 151.4 |
| D | 10 | 70 | 277778 | 1831.17 | 624 | 606 | 151.4 |
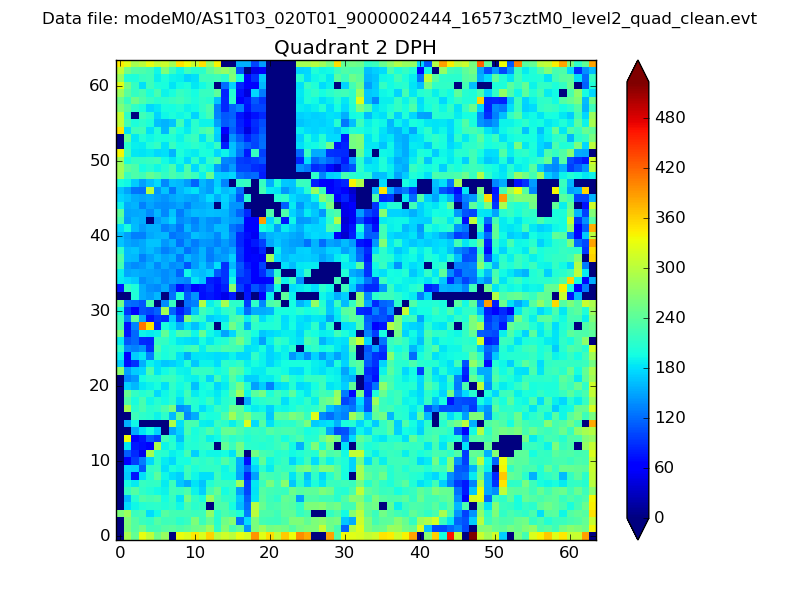
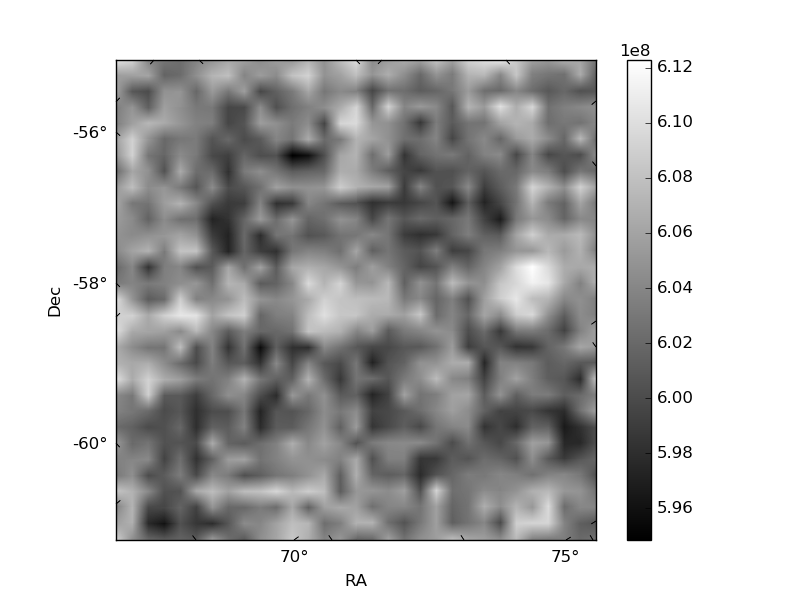
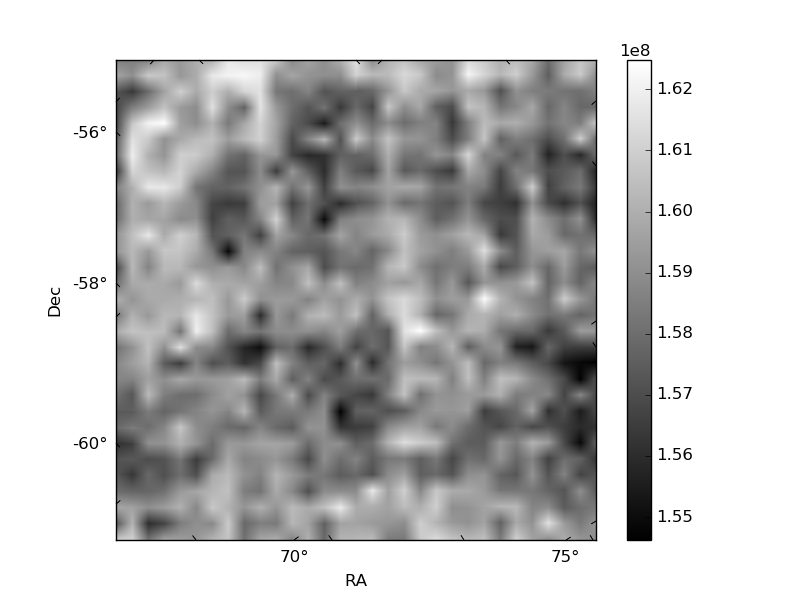
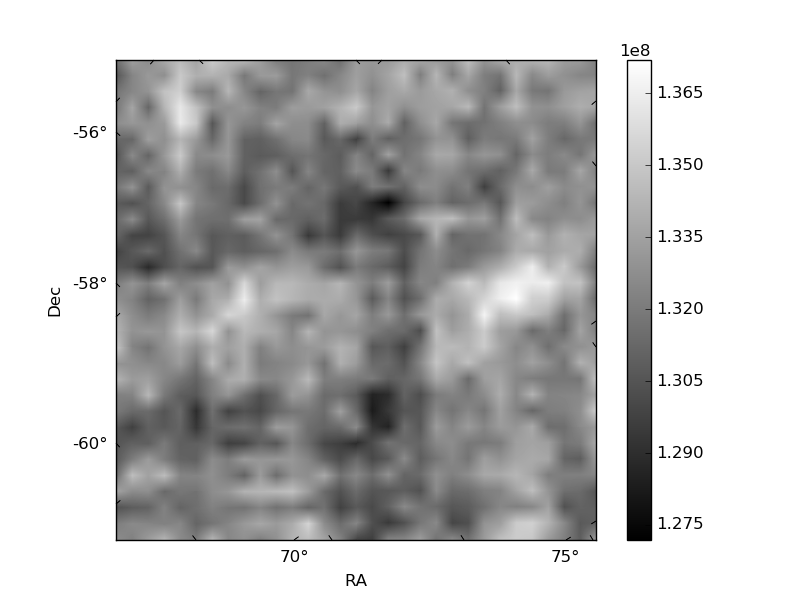
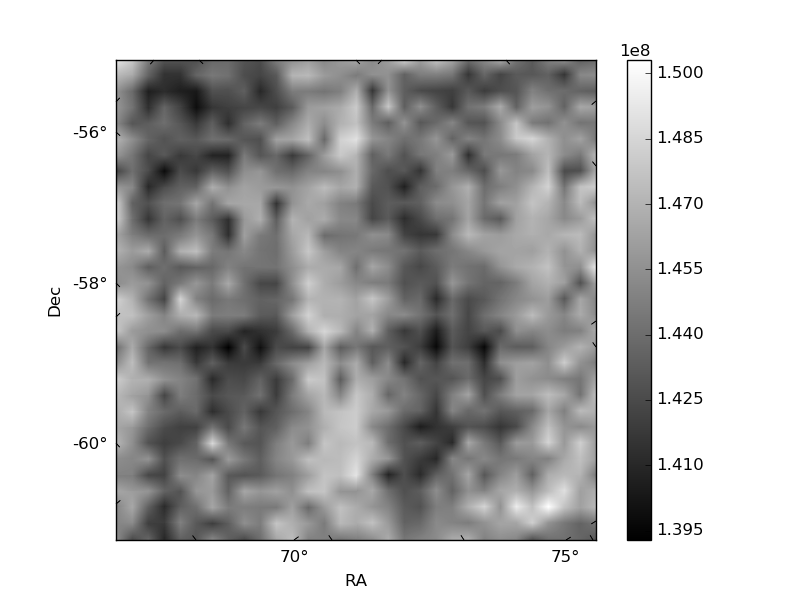
Histogram calculated using DETX and DETY for each event in the final _common_clean file
| Quadrant A | 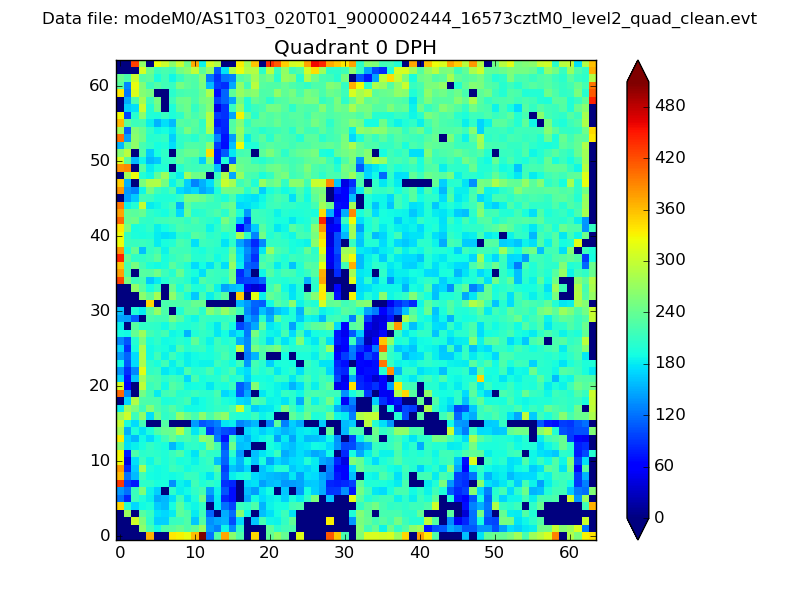 |
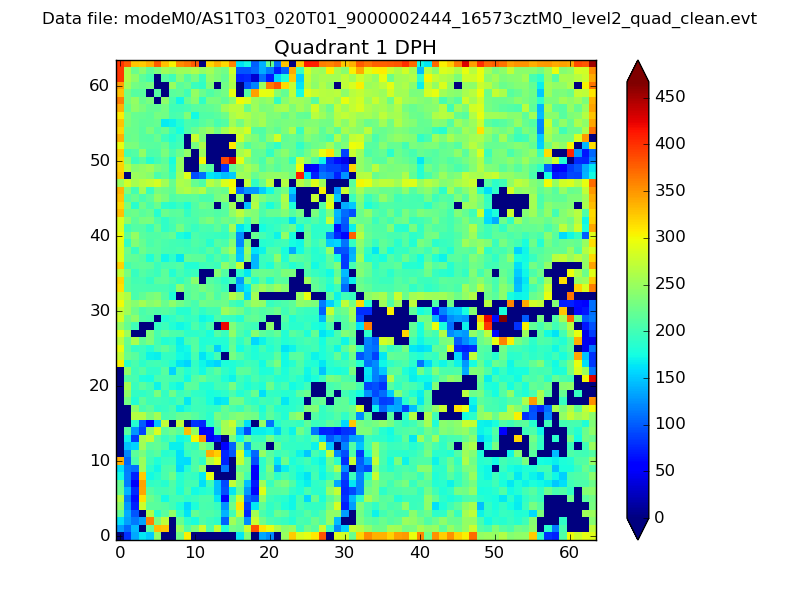 |
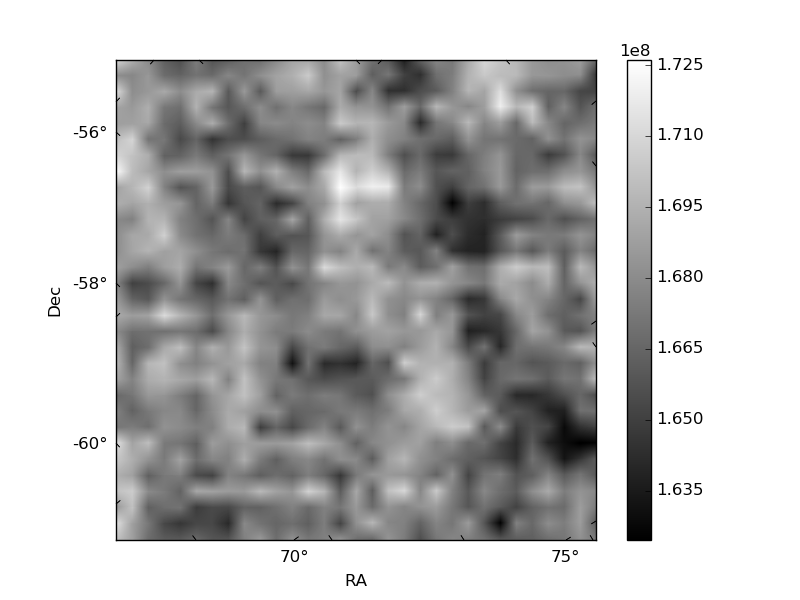
Quadrant B |
|---|---|---|---|
| Quadrant D | 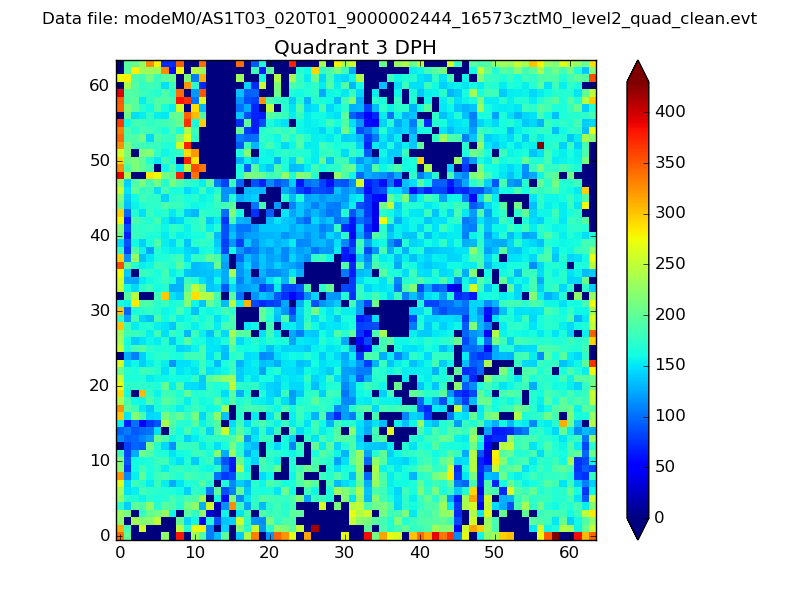 |
 |
Quadrant C |
| Plot type | Count rate plots | Images |
|---|---|---|
| Comparison with Poisson distribution Blue bars denote a histogram of data divided into 1 sec bins. Red curve is a Poisson curve with rate = median count rate of data. |
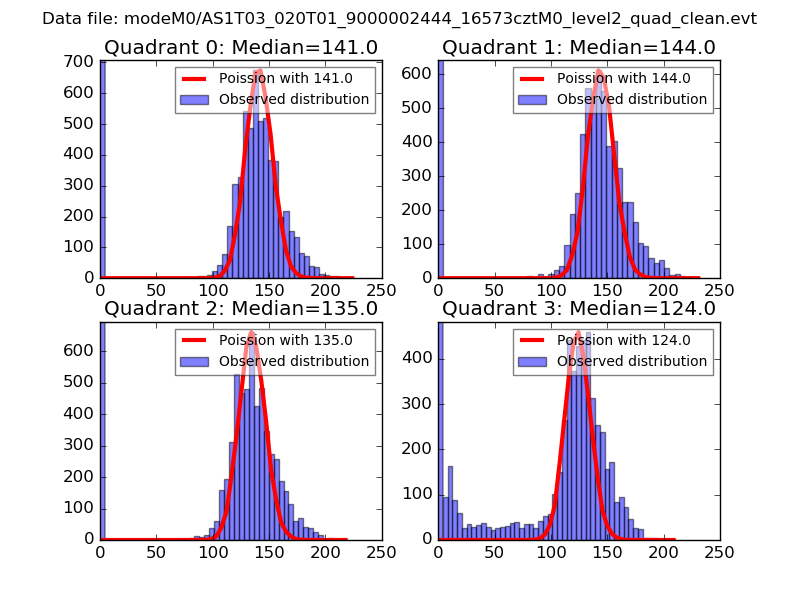 |
 |
| Quadrant-wise count rates Data is divided into 100 sec bins |
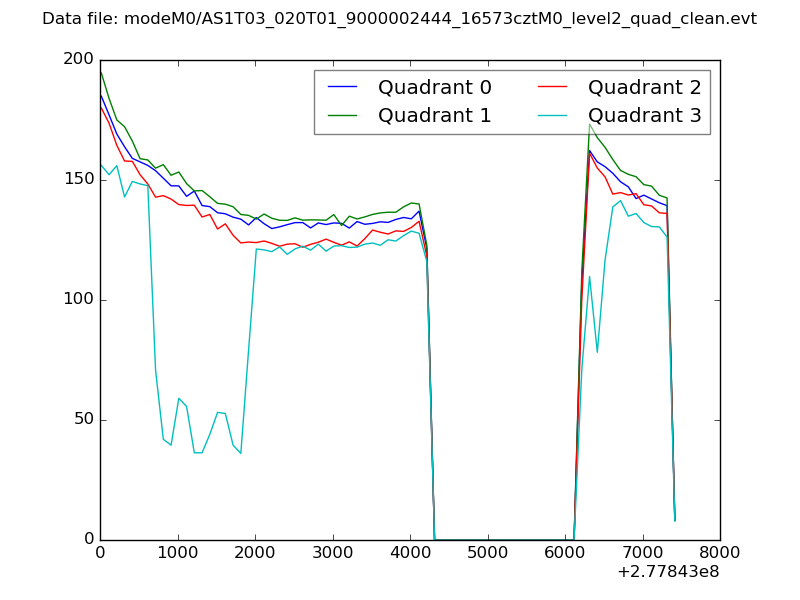 |
|
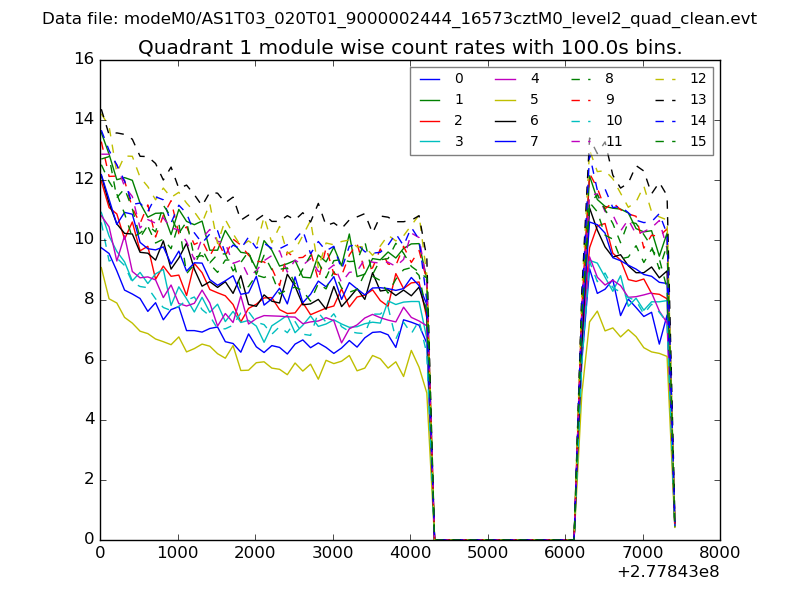
| Module-wise count rates for Quadrant A Data is divided into 100 sec bins |
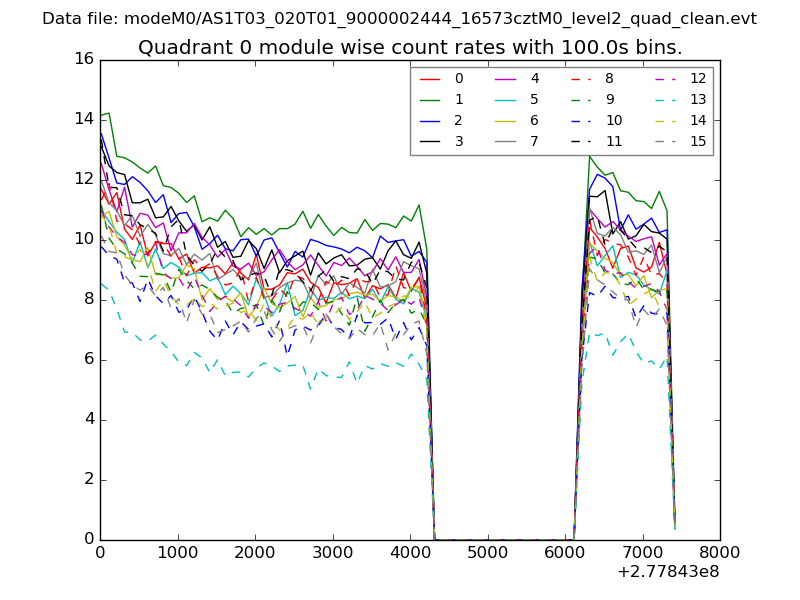 |
 |
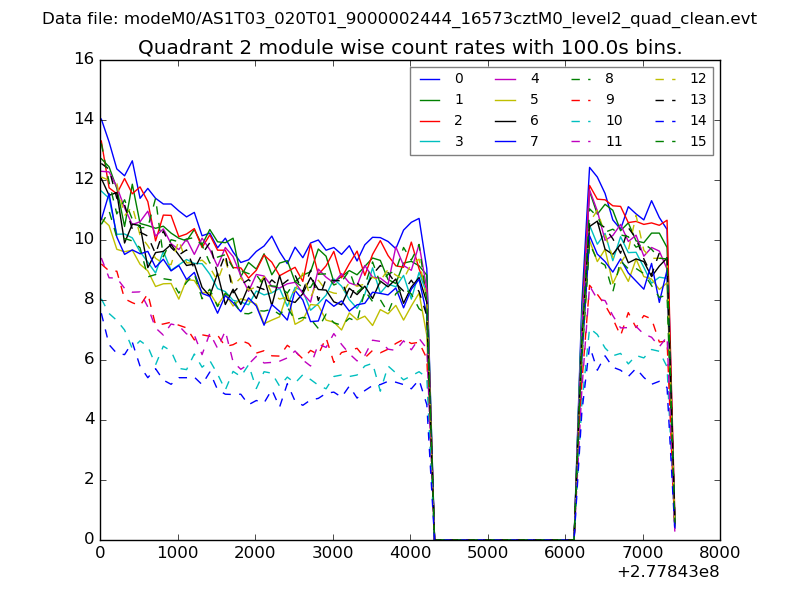
| Module-wise count rates for Quadrant B Data is divided into 100 sec bins |
 |
 |
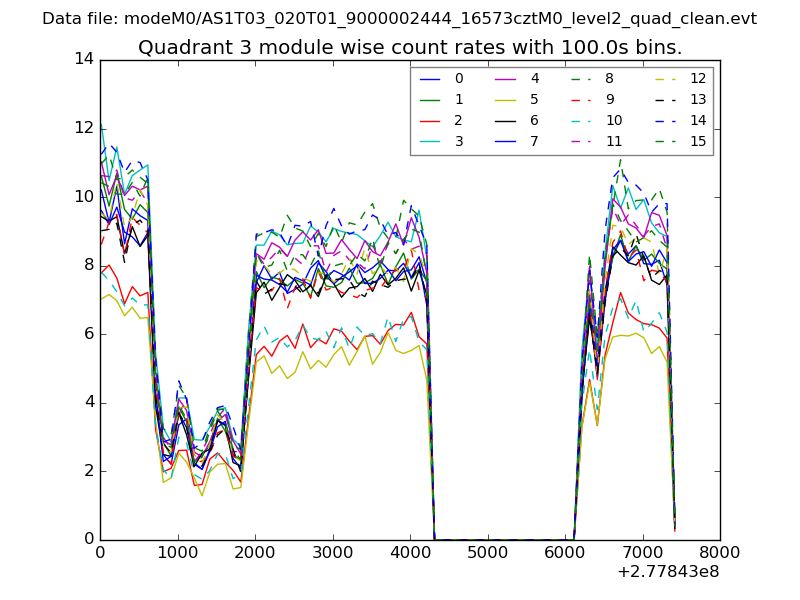
| Module-wise count rates for Quadrant C Data is divided into 100 sec bins |
 |
 |
| Module-wise count rates for Quadrant D Data is divided into 100 sec bins |
 |
 |
| Parameter | Plot |
|---|---|
| CZT HV Monitor | 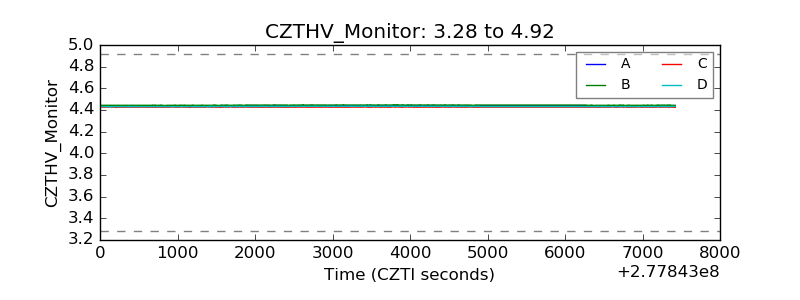 |
| D_VDD | 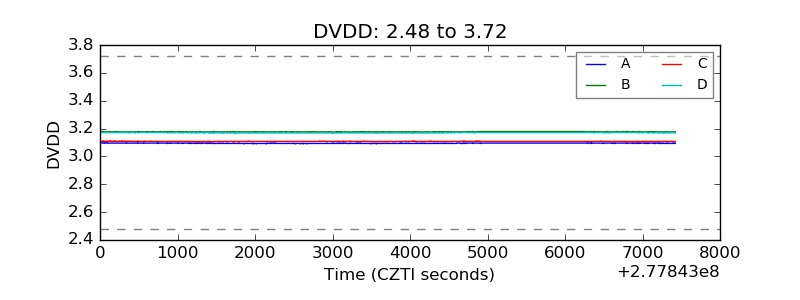 |
| Temperature 1 | 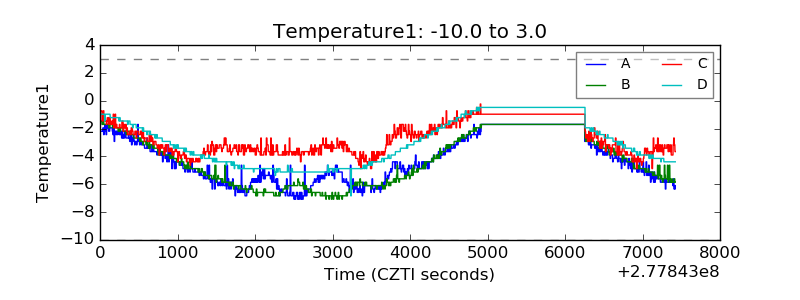 |
| Veto HV Monitor | 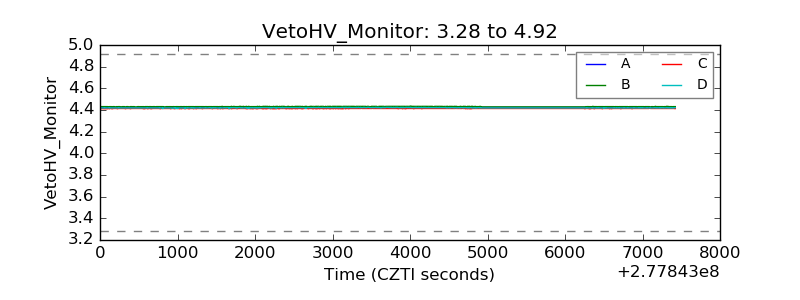 |
| Veto LLD | 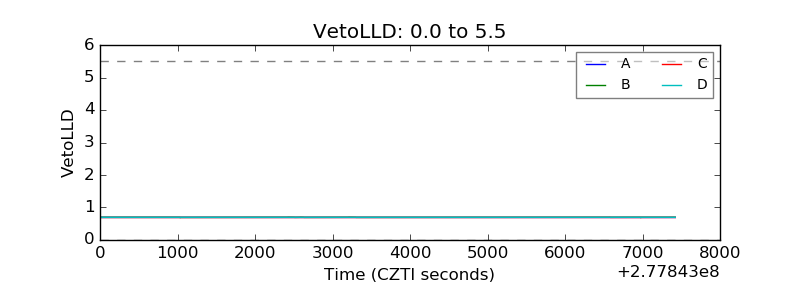 |
| Alpha Counter | 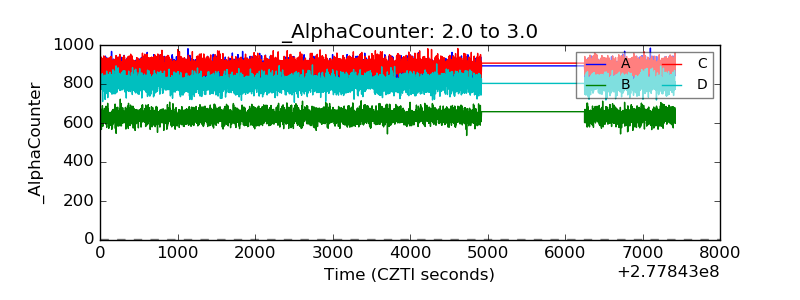 |
| _CPM_Rate | 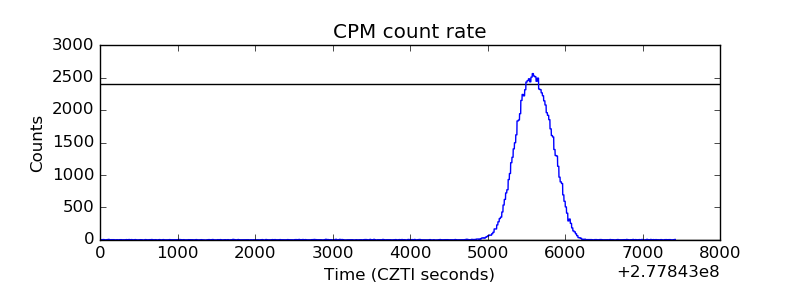 |
| CZT Counter | 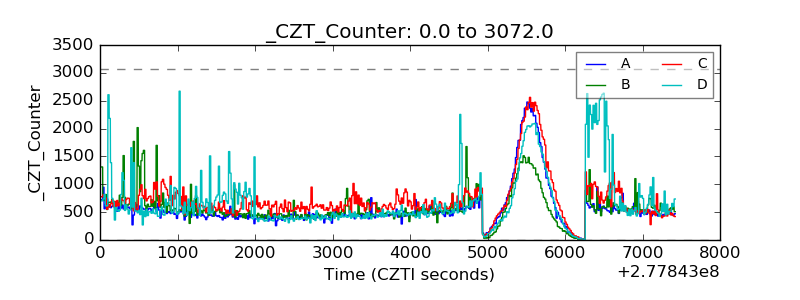 |
| +2.5 Volts monitor |  |
| +5 Volts monitor | 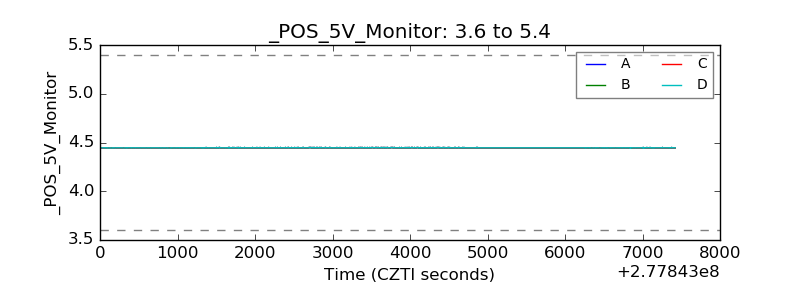 |
| _ROLL_ROT | 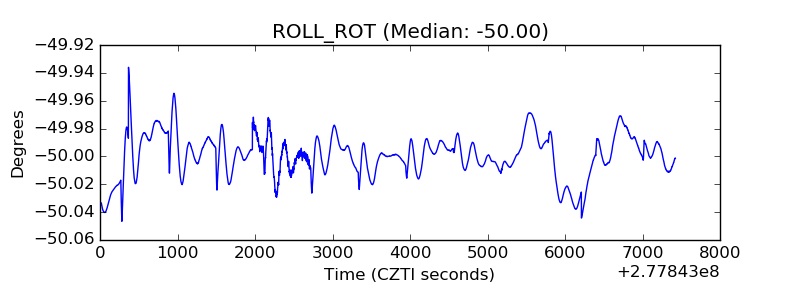 |
| _Roll_DEC | 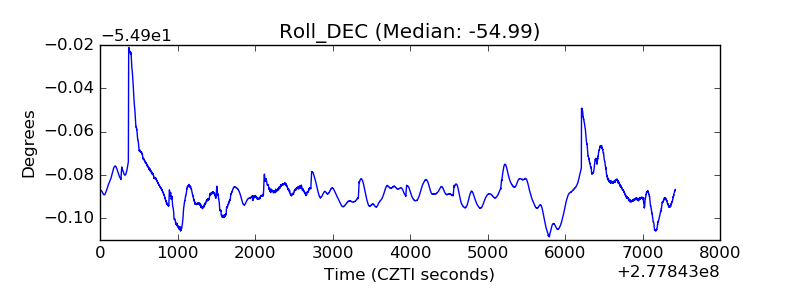 |
| _Roll_RA | 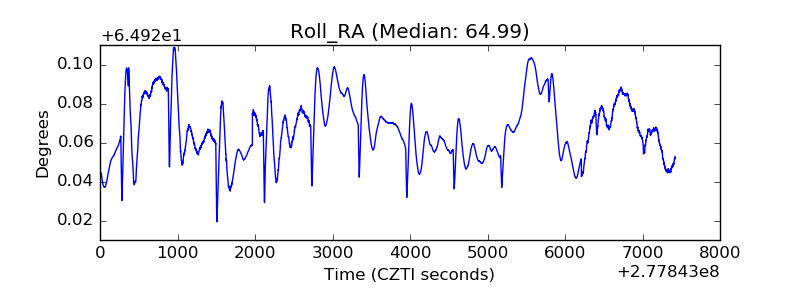 |
| Veto Counter | 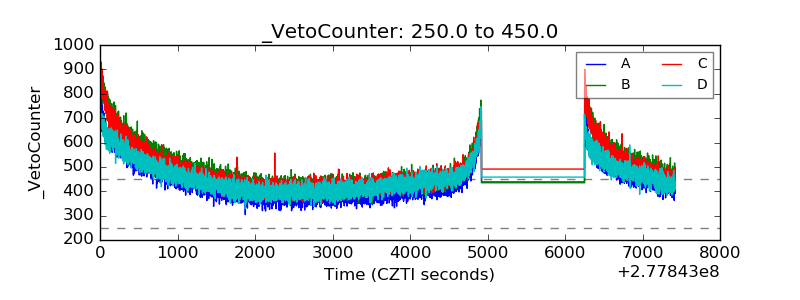 |