| Param | Original file | Final file |
|---|---|---|
| Filename | modeM0/AS1T03_020T01_9000002444_16574cztM0_level2.evt | modeM0/AS1T03_020T01_9000002444_16574cztM0_level2_quad_clean.evt |
| Size (bytes) | 623,041,920 | 107,516,160 |
| Size | 594.2 MB | 102.5 MB |
| Events in quadrant A | 3,707,269 | 746,350 |
| Events in quadrant B | 3,882,200 | 774,660 |
| Events in quadrant C | 4,647,713 | 726,591 |
| Events in quadrant D | 6,146,451 | 510,857 |
| Mode M9 | |||
|---|---|---|---|
| Quadrant | BADHDUFLAG | Total packets | Discarded packets |
| A | 0 | 26 | 0 |
| B | 0 | 26 | 0 |
| C | 0 | 26 | 0 |
| D | 0 | 26 | 0 |
| Mode SS | |||
|---|---|---|---|
| Quadrant | BADHDUFLAG | Total packets | Discarded packets |
| A | 0 | 148 | 0 |
| B | 0 | 148 | 0 |
| C | 0 | 148 | 0 |
| D | 0 | 148 | 0 |
| Mode M0 | |||
|---|---|---|---|
| Quadrant | BADHDUFLAG | Total packets | Discarded packets |
| A | 0 | 15736 | 3 |
| B | 0 | 16173 | 2 |
| C | 0 | 18616 | 2 |
| D | 0 | 23363 | 2 |
| Quadrant | Total seconds | Saturated seconds | Saturation percentage |
|---|---|---|---|
| A | 7130 | 111 | 1.556802% |
| B | 7130 | 143 | 2.005610% |
| C | 7130 | 230 | 3.225806% |
| D | 7130 | 2896 | 40.617111% |
Noise dominated data is calculated using 1-second bins in cleaned event files. If a bin has >2000 counts, and if more than 50% of those come from <1% of pixels, then it is considered to be noise-dominated and hence unusable.
| Quadrant | # 1 sec bins | Bins with >0 counts | Bins with >2000 counts | High rate bins dominated by noise | Noise dominated (total time) | Noise dominated (detector-on time) | Marked lightcurve |
|---|---|---|---|---|---|---|---|
| A | 9766 | 7133 | 42 | 42 | 0.43% | 0.59% | 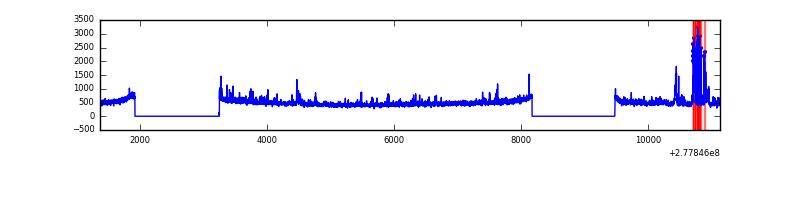 |
| B | 9766 | 7133 | 8 | 8 | 0.08% | 0.11% | 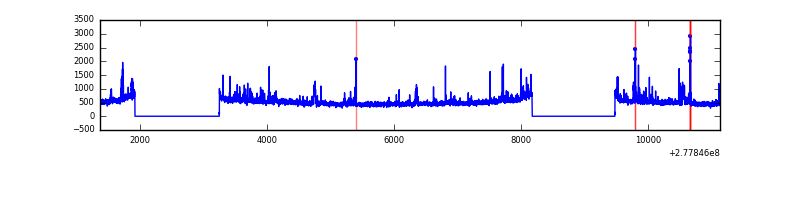 |
| C | 9766 | 7133 | 1 | 1 | 0.01% | 0.01% | 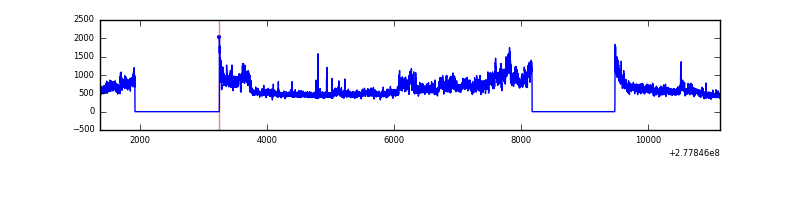 |
| D | 9766 | 7130 | 695 | 695 | 7.12% | 9.75% | 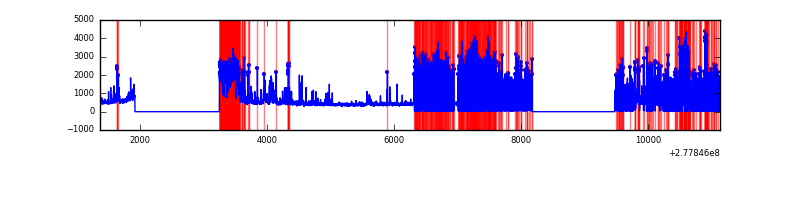 |
Top three noisy pixels from each quadrant. If the there are fewer than three noisy pixels in the level2.evt file, extra rows are filled as -1
| Pixel properties | Quadrant properties | ||||||
|---|---|---|---|---|---|---|---|
| Quadrant | DetID | PixID | Counts | Sigma | Mean | Median | Sigma |
| A | 9 | 143 | 265914 | 1508.14 | 869 | 848 | 175.8 |
| A | 2 | 79 | 61465 | 344.89 | 869 | 848 | 175.8 |
| A | 15 | 174 | 35367 | 196.4 | 869 | 848 | 175.8 |
| B | 15 | 35 | 163502 | 1001.12 | 885 | 863 | 162.5 |
| B | 0 | 85 | 64862 | 393.95 | 885 | 863 | 162.5 |
| B | 0 | 229 | 45645 | 275.66 | 885 | 863 | 162.5 |
| C | 3 | 233 | 1226064 | 6305.59 | 840 | 845 | 194.3 |
| C | 14 | 238 | 133292 | 681.64 | 840 | 845 | 194.3 |
| C | 7 | 247 | 9278 | 43.4 | 840 | 845 | 194.3 |
| D | 1 | 52 | 2822818 | 20051.72 | 581 | 563 | 140.7 |
| D | 2 | 33 | 895315 | 6357.09 | 581 | 563 | 140.7 |
| D | 10 | 70 | 88742 | 626.5 | 581 | 563 | 140.7 |
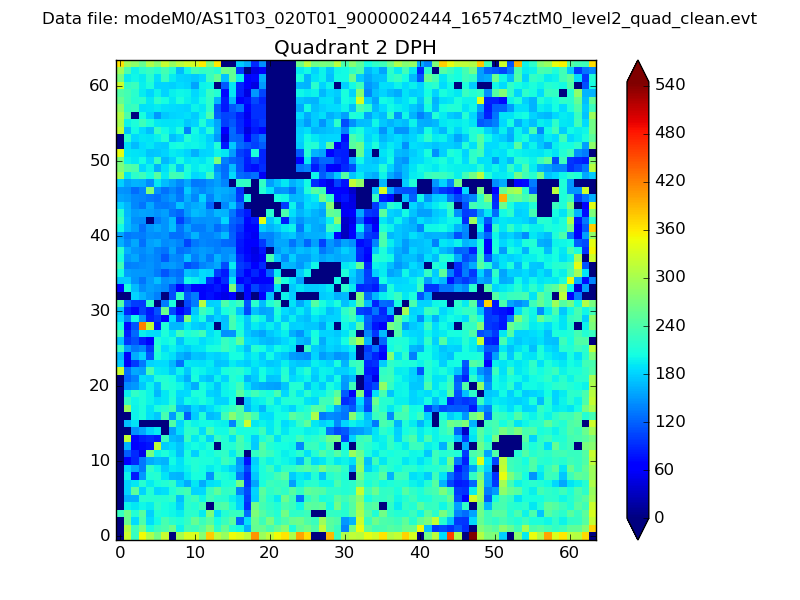
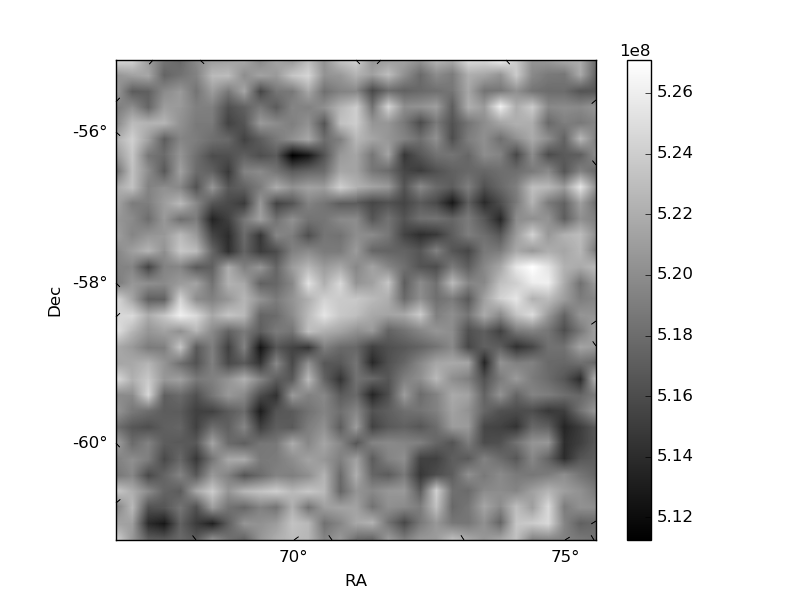
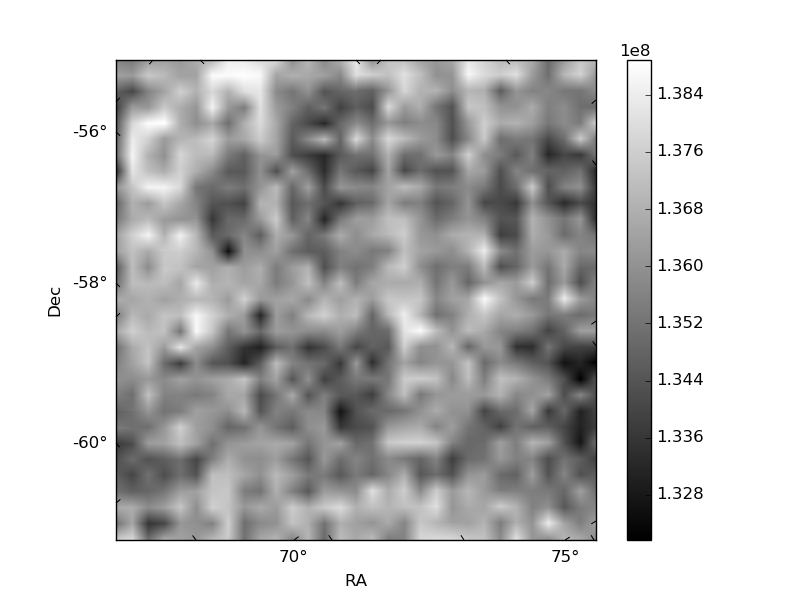
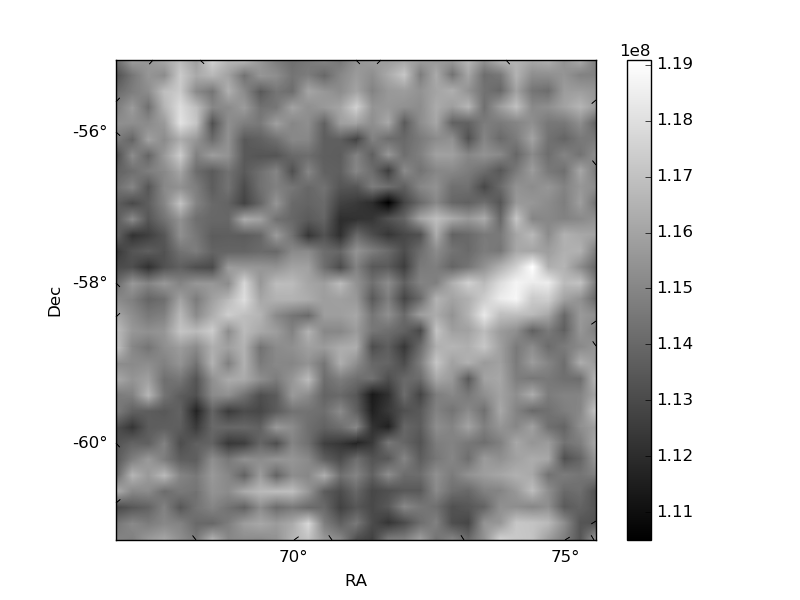
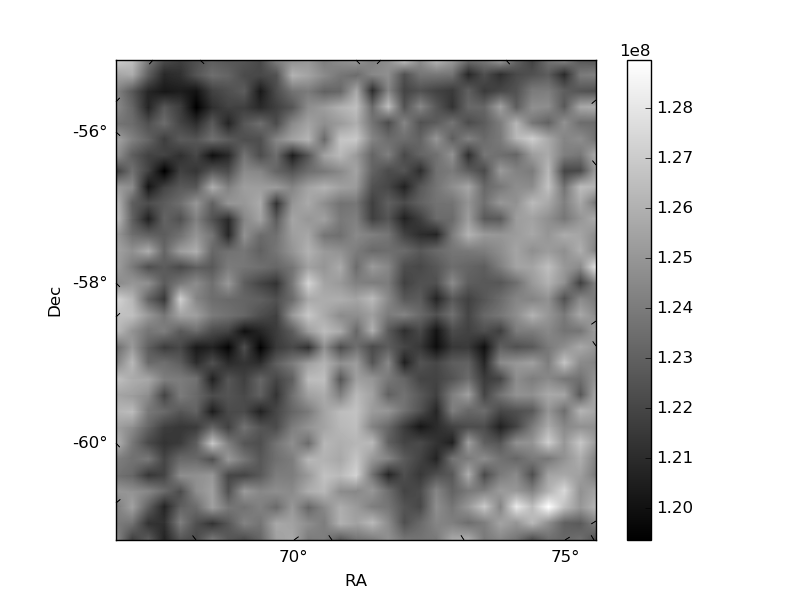
Histogram calculated using DETX and DETY for each event in the final _common_clean file
| Quadrant A | 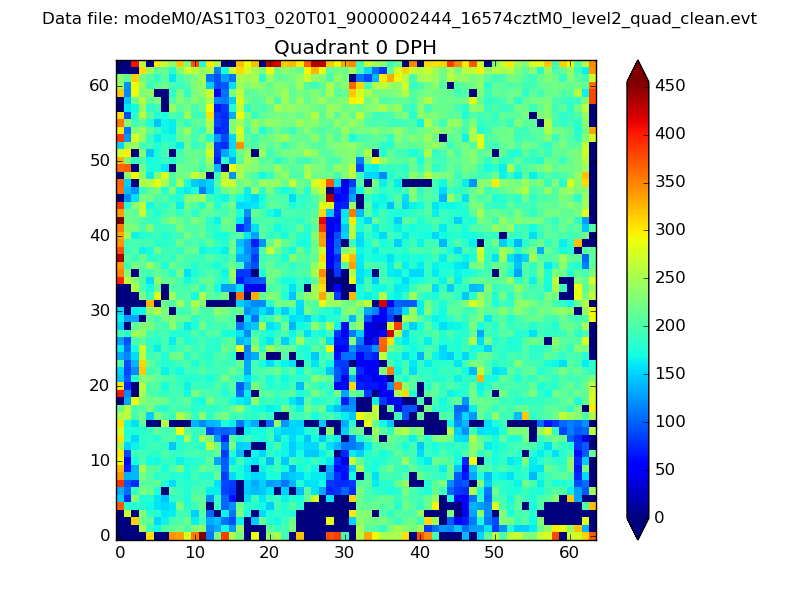 |
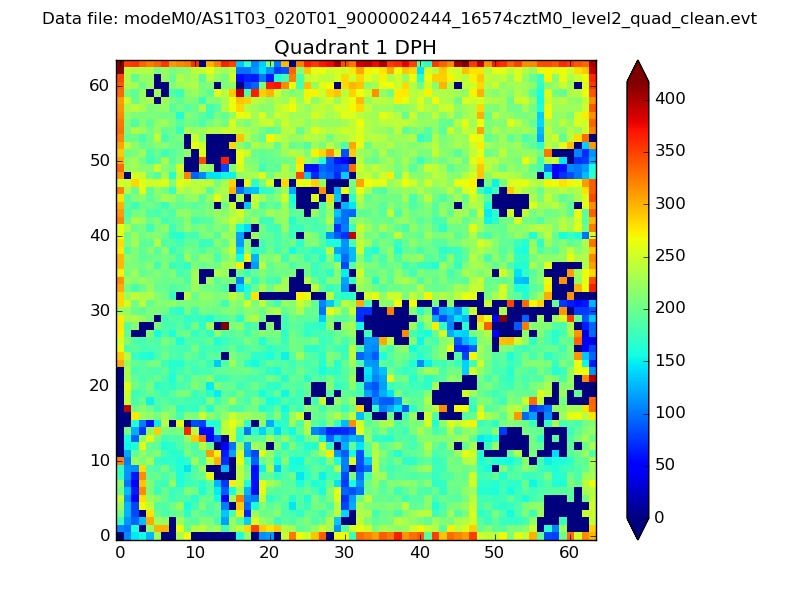 |
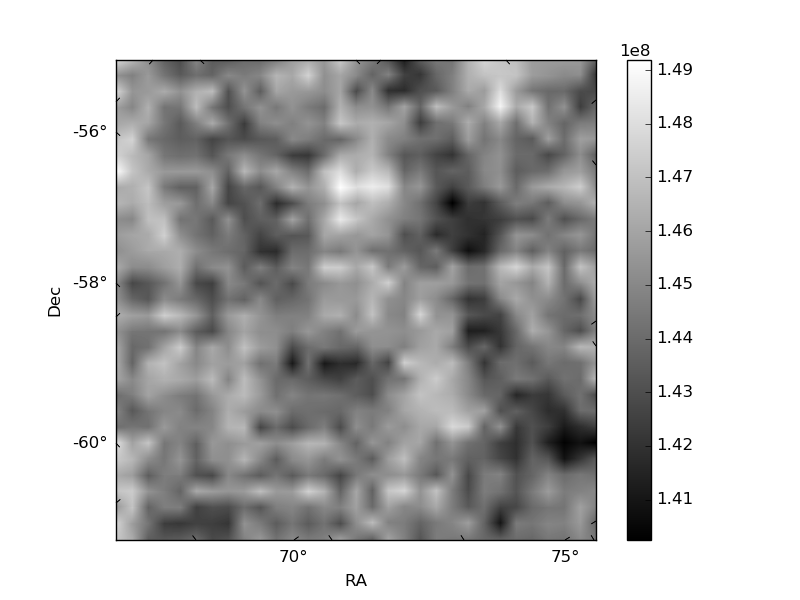
Quadrant B |
|---|---|---|---|
| Quadrant D | 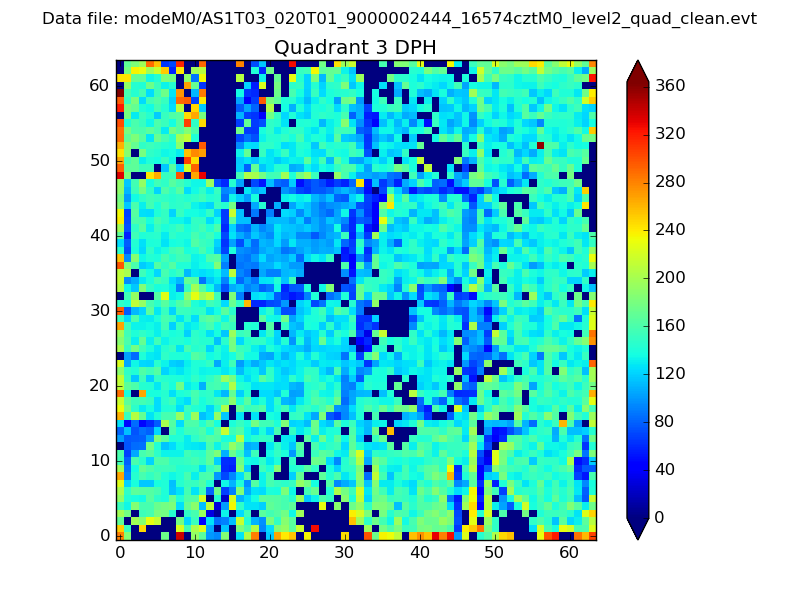 |
 |
Quadrant C |
| Plot type | Count rate plots | Images |
|---|---|---|
| Comparison with Poisson distribution Blue bars denote a histogram of data divided into 1 sec bins. Red curve is a Poisson curve with rate = median count rate of data. |
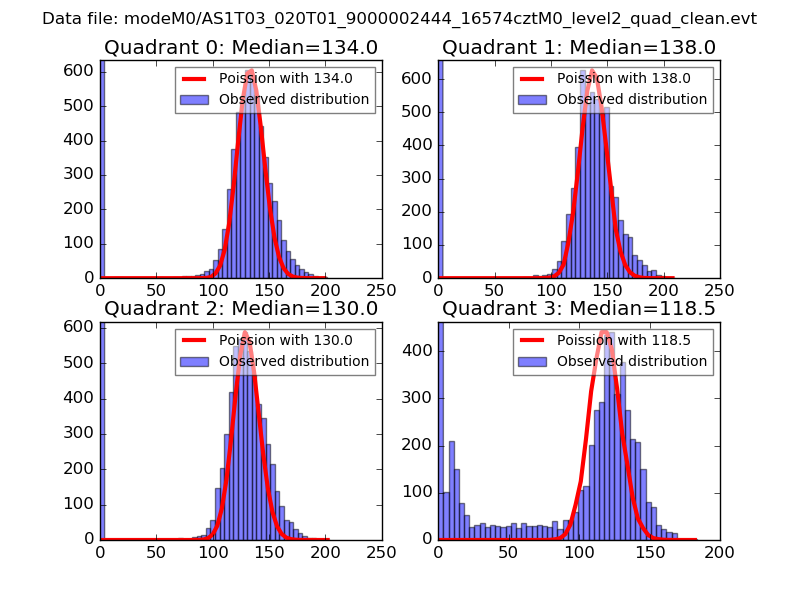 |
 |
| Quadrant-wise count rates Data is divided into 100 sec bins |
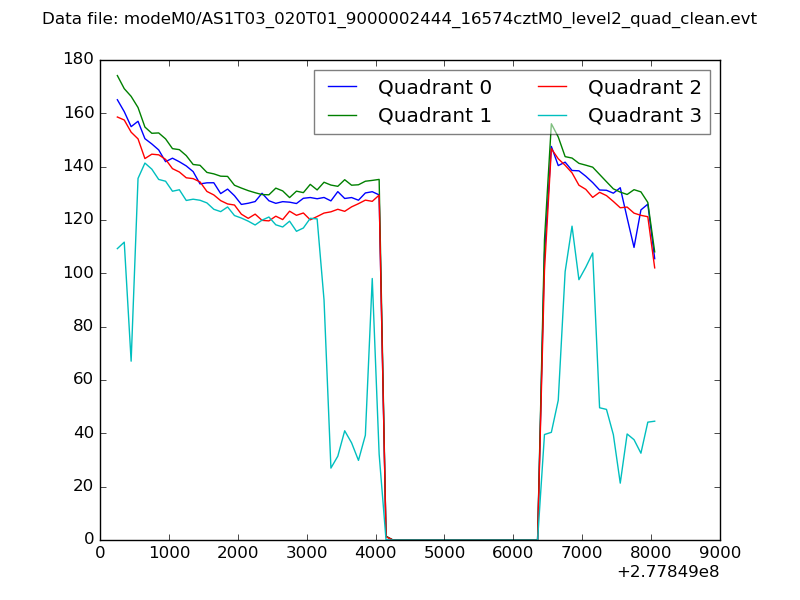 |
|
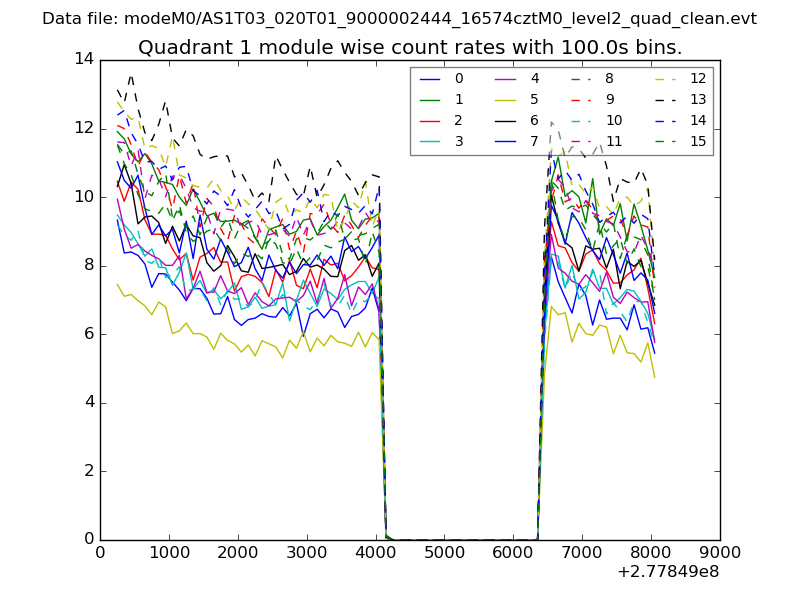
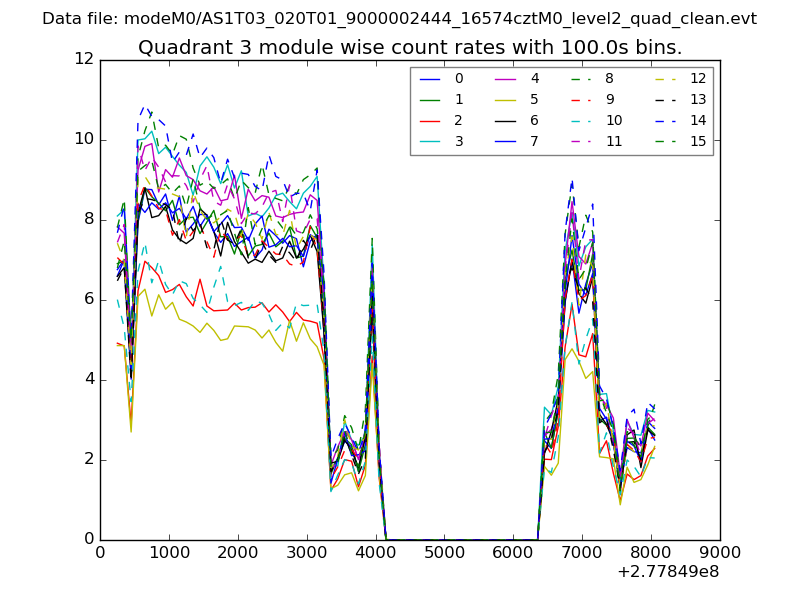
| Module-wise count rates for Quadrant A Data is divided into 100 sec bins |
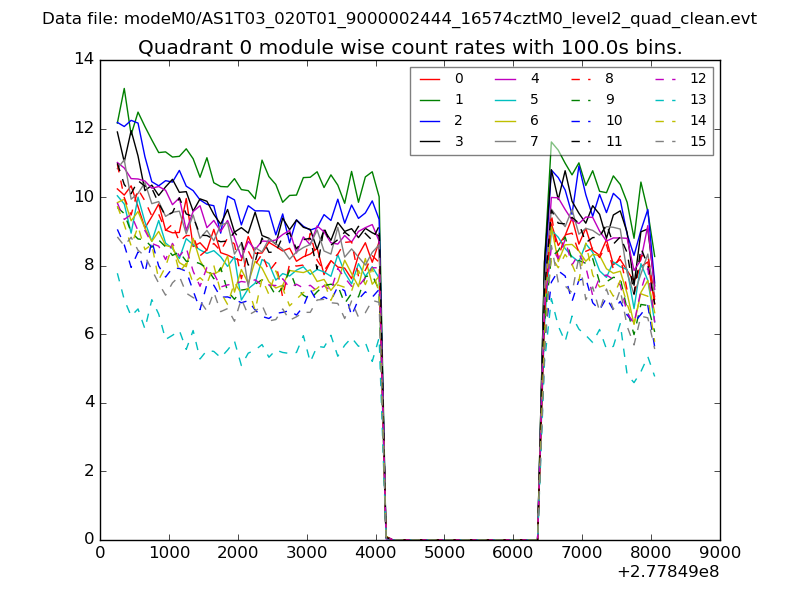 |
 |
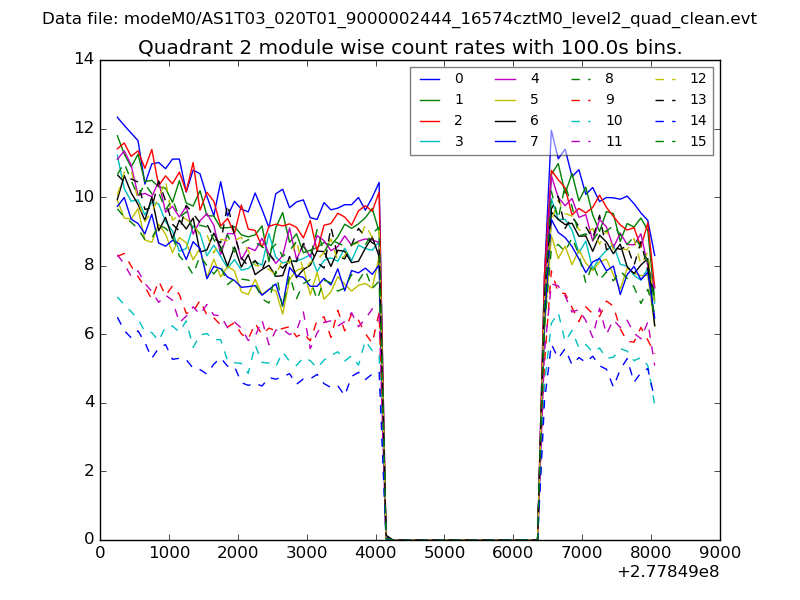
| Module-wise count rates for Quadrant B Data is divided into 100 sec bins |
 |
 |
| Module-wise count rates for Quadrant C Data is divided into 100 sec bins |
 |
 |
| Module-wise count rates for Quadrant D Data is divided into 100 sec bins |
 |
 |
| Parameter | Plot |
|---|---|
| CZT HV Monitor | 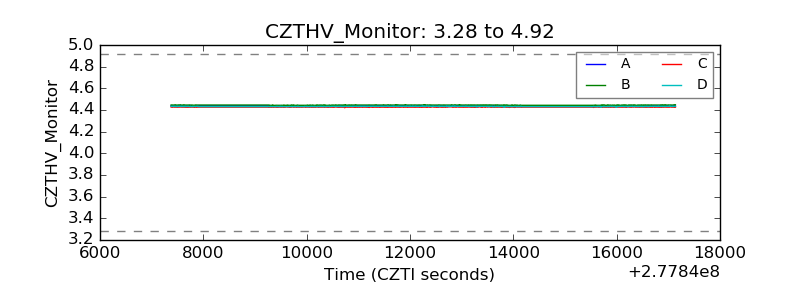 |
| D_VDD | 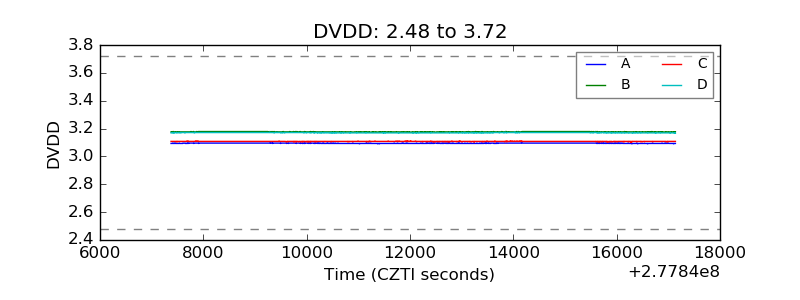 |
| Temperature 1 | 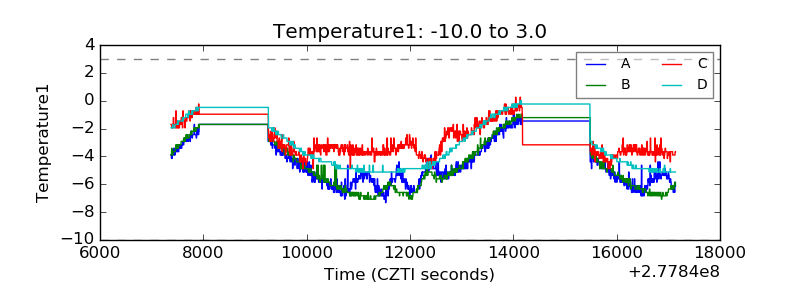 |
| Veto HV Monitor | 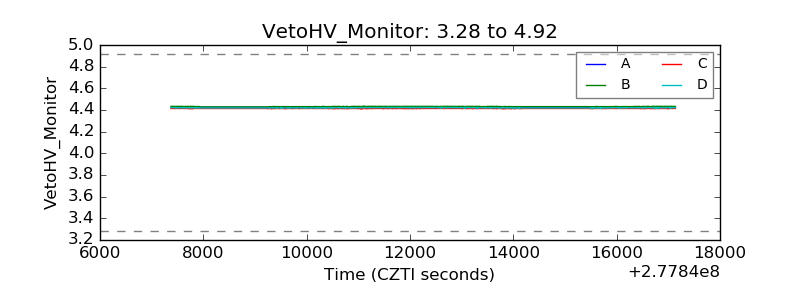 |
| Veto LLD | 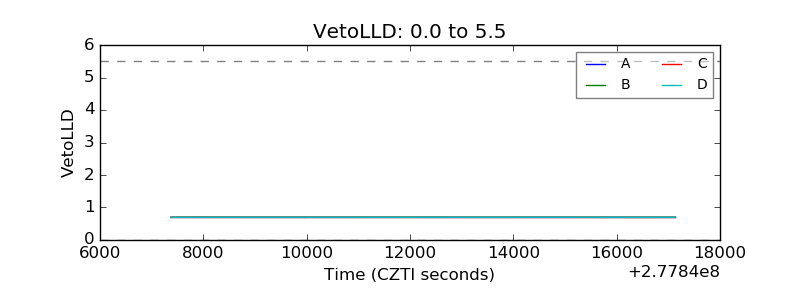 |
| Alpha Counter | 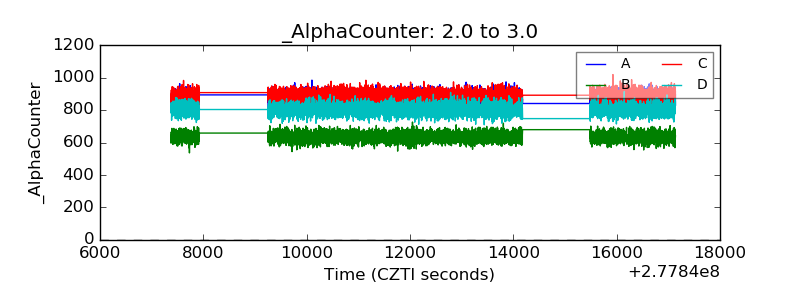 |
| _CPM_Rate | 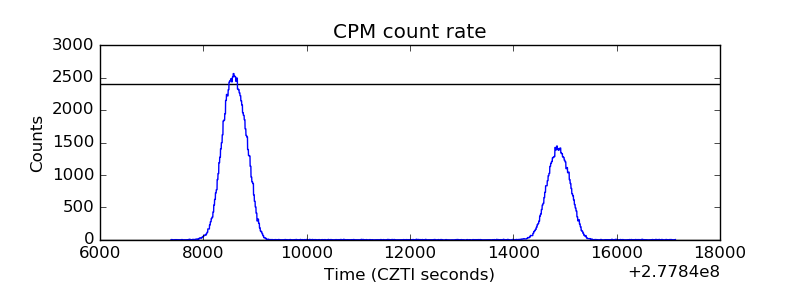 |
| CZT Counter | 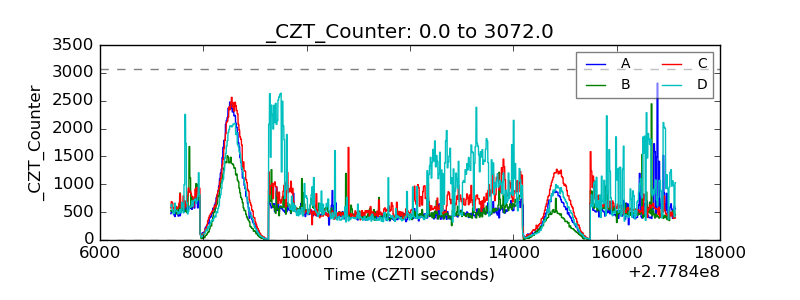 |
| +2.5 Volts monitor | 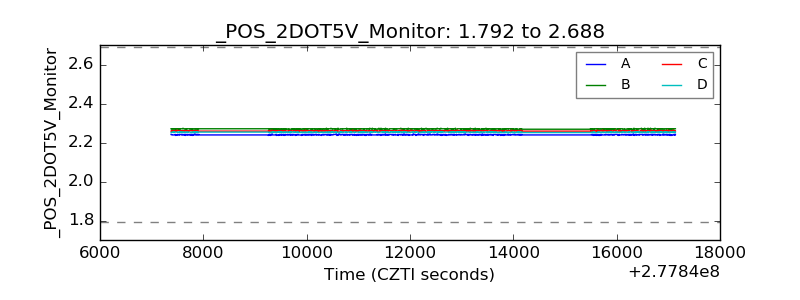 |
| +5 Volts monitor | 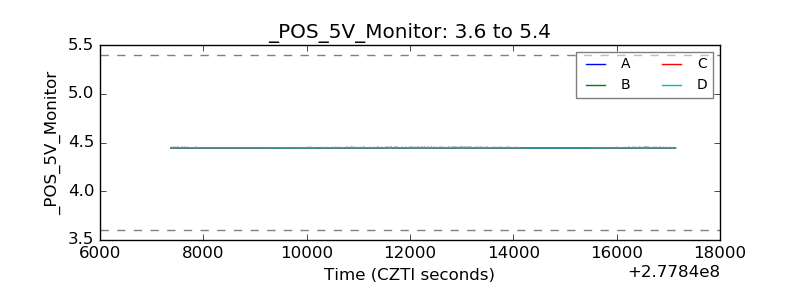 |
| _ROLL_ROT | 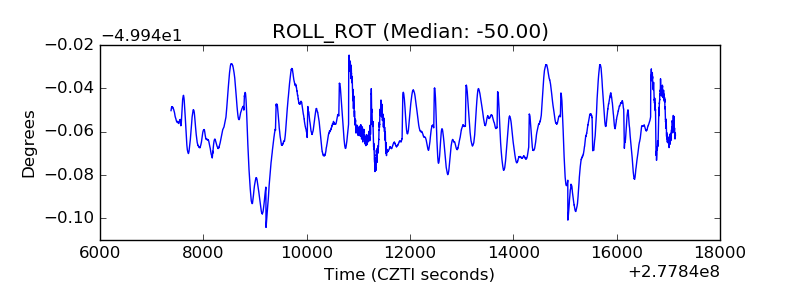 |
| _Roll_DEC | 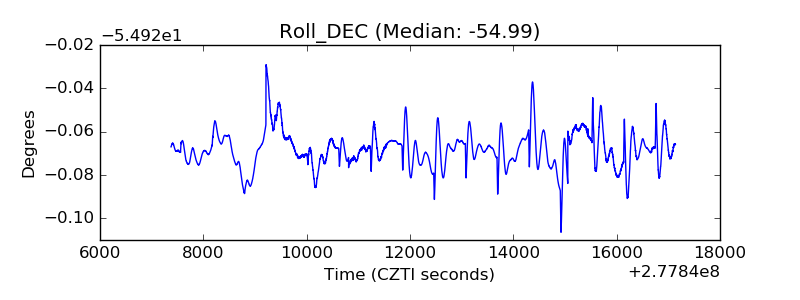 |
| _Roll_RA | 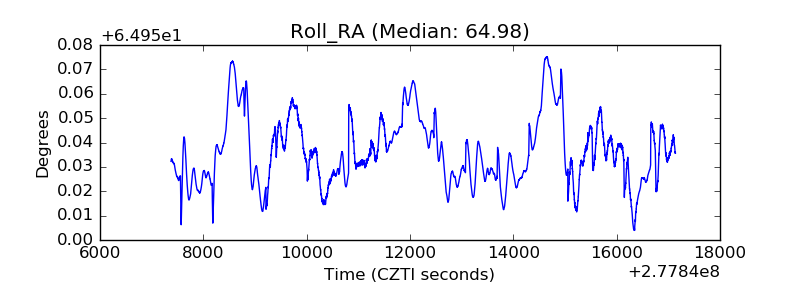 |
| Veto Counter | 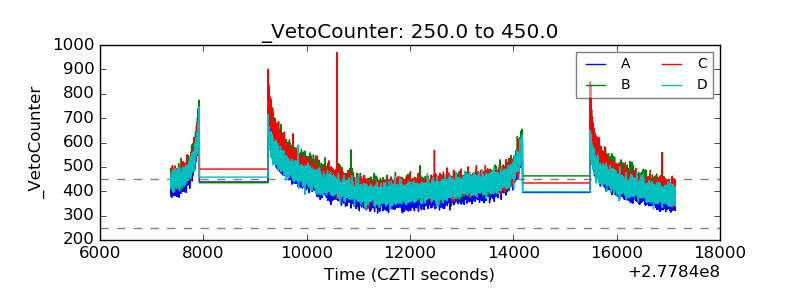 |