| Param | Original file | Final file |
|---|---|---|
| Filename | modeM0/AS1T03_020T01_9000002444_16575cztM0_level2.evt | modeM0/AS1T03_020T01_9000002444_16575cztM0_level2_quad_clean.evt |
| Size (bytes) | 513,360,000 | 99,728,640 |
| Size | 489.6 MB | 95.1 MB |
| Events in quadrant A | 3,674,779 | 670,170 |
| Events in quadrant B | 3,623,293 | 694,671 |
| Events in quadrant C | 3,659,073 | 658,477 |
| Events in quadrant D | 4,129,308 | 523,885 |
| Mode M9 | |||
|---|---|---|---|
| Quadrant | BADHDUFLAG | Total packets | Discarded packets |
| A | 0 | 13 | 0 |
| B | 0 | 13 | 0 |
| C | 0 | 13 | 0 |
| D | 0 | 14 | 0 |
| Mode SS | |||
|---|---|---|---|
| Quadrant | BADHDUFLAG | Total packets | Discarded packets |
| A | 0 | 138 | 0 |
| B | 0 | 138 | 0 |
| C | 0 | 138 | 0 |
| D | 0 | 138 | 0 |
| Mode M0 | |||
|---|---|---|---|
| Quadrant | BADHDUFLAG | Total packets | Discarded packets |
| A | 0 | 15304 | 3 |
| B | 0 | 15217 | 2 |
| C | 0 | 15366 | 2 |
| D | 0 | 17127 | 2 |
| Quadrant | Total seconds | Saturated seconds | Saturation percentage |
|---|---|---|---|
| A | 6779 | 56 | 0.826081% |
| B | 6779 | 75 | 1.106358% |
| C | 6779 | 72 | 1.062104% |
| D | 6779 | 1184 | 17.465703% |
Noise dominated data is calculated using 1-second bins in cleaned event files. If a bin has >2000 counts, and if more than 50% of those come from <1% of pixels, then it is considered to be noise-dominated and hence unusable.
| Quadrant | # 1 sec bins | Bins with >0 counts | Bins with >2000 counts | High rate bins dominated by noise | Noise dominated (total time) | Noise dominated (detector-on time) | Marked lightcurve |
|---|---|---|---|---|---|---|---|
| A | 7845 | 6781 | 44 | 44 | 0.56% | 0.65% | 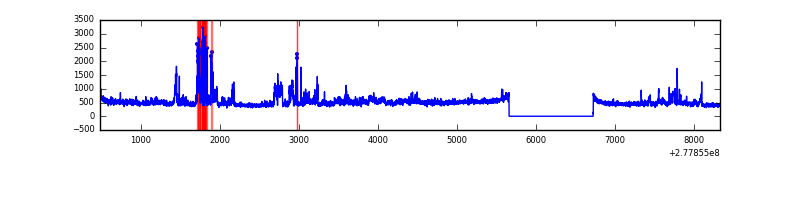 |
| B | 7845 | 6781 | 14 | 14 | 0.18% | 0.21% | 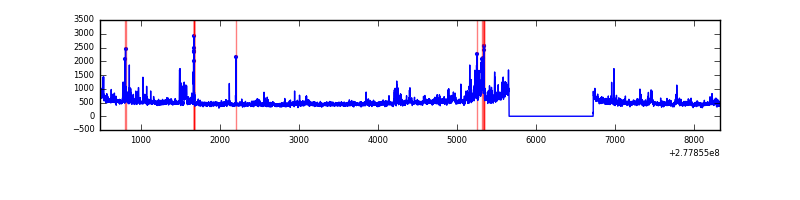 |
| C | 7845 | 6781 | 0 | 0 | 0.00% | 0.00% | 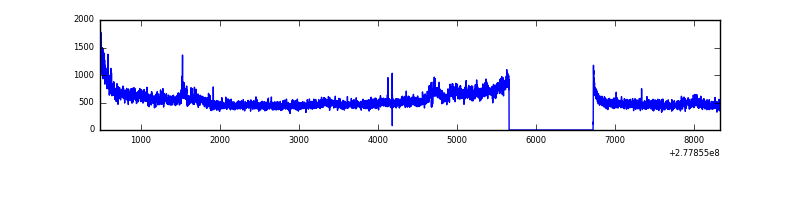 |
| D | 7845 | 6779 | 233 | 233 | 2.97% | 3.44% | 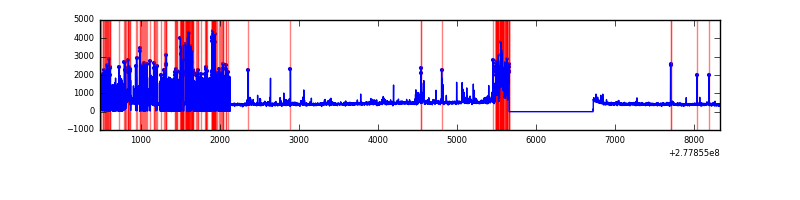 |
Top three noisy pixels from each quadrant. If the there are fewer than three noisy pixels in the level2.evt file, extra rows are filled as -1
| Pixel properties | Quadrant properties | ||||||
|---|---|---|---|---|---|---|---|
| Quadrant | DetID | PixID | Counts | Sigma | Mean | Median | Sigma |
| A | 9 | 143 | 412412 | 2587.74 | 790 | 771 | 159.1 |
| A | 15 | 174 | 206992 | 1296.39 | 790 | 771 | 159.1 |
| A | 2 | 79 | 13722 | 81.42 | 790 | 771 | 159.1 |
| B | 0 | 85 | 154619 | 1020.6 | 804 | 785 | 150.7 |
| B | 15 | 35 | 147228 | 971.57 | 804 | 785 | 150.7 |
| B | 0 | 229 | 32214 | 208.51 | 804 | 785 | 150.7 |
| C | 3 | 233 | 522720 | 2914.34 | 772 | 774 | 179.1 |
| C | 14 | 238 | 120627 | 669.21 | 772 | 774 | 179.1 |
| C | 7 | 247 | 6811 | 33.71 | 772 | 774 | 179.1 |
| D | 1 | 52 | 1090462 | 6746.44 | 666 | 647 | 161.5 |
| D | 10 | 70 | 244140 | 1507.33 | 666 | 647 | 161.5 |
| D | 2 | 33 | 118580 | 730.06 | 666 | 647 | 161.5 |
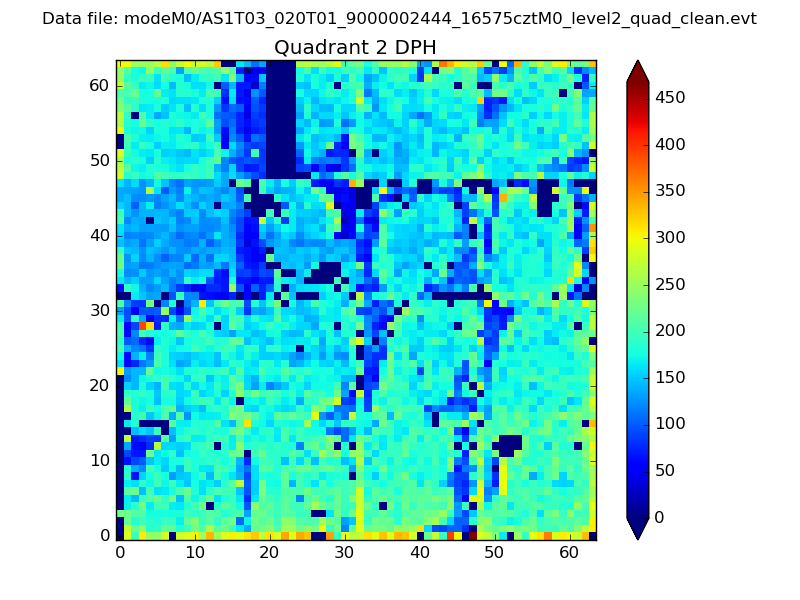
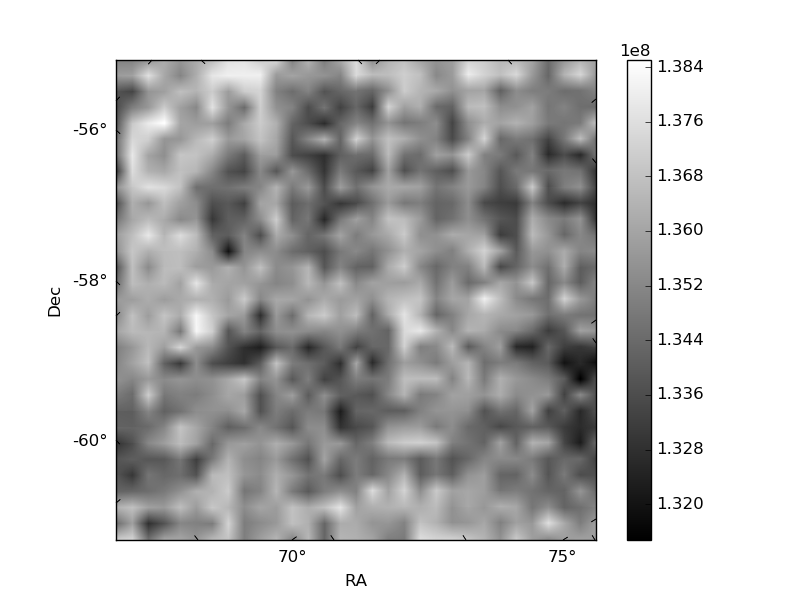
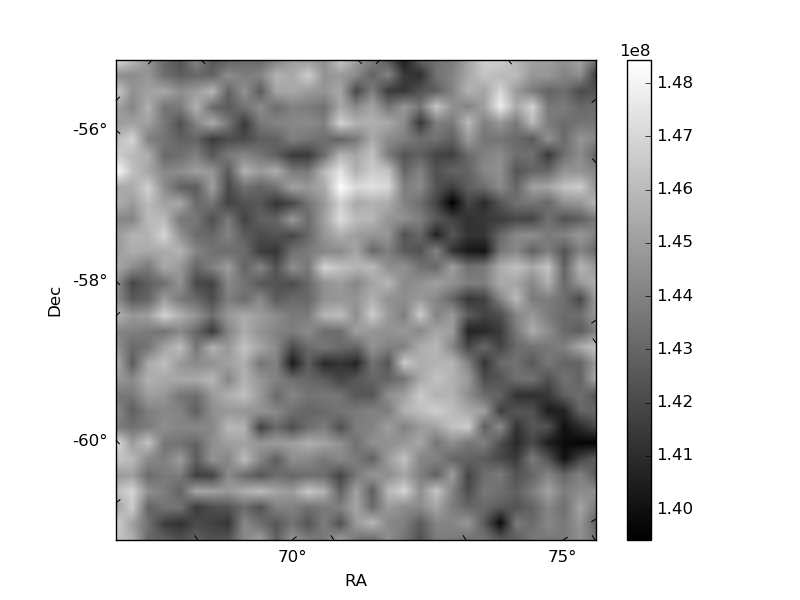
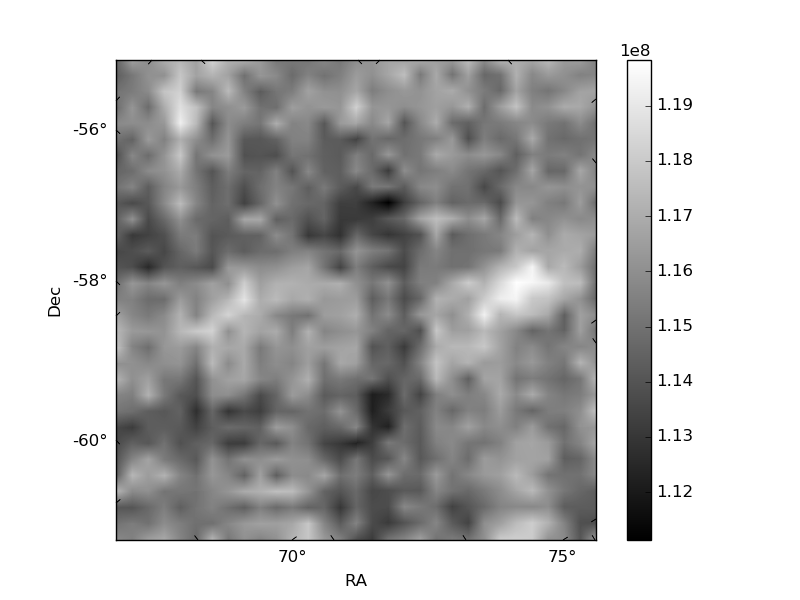
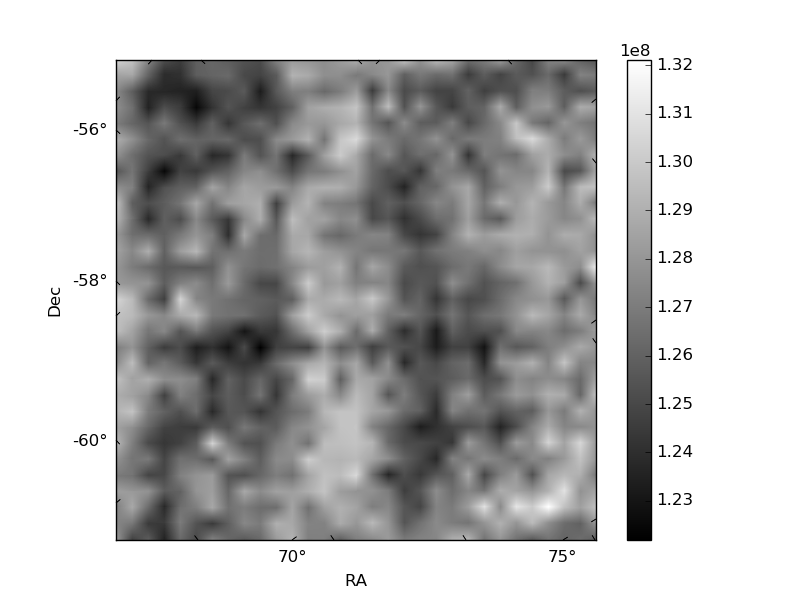
Histogram calculated using DETX and DETY for each event in the final _common_clean file
| Quadrant A | 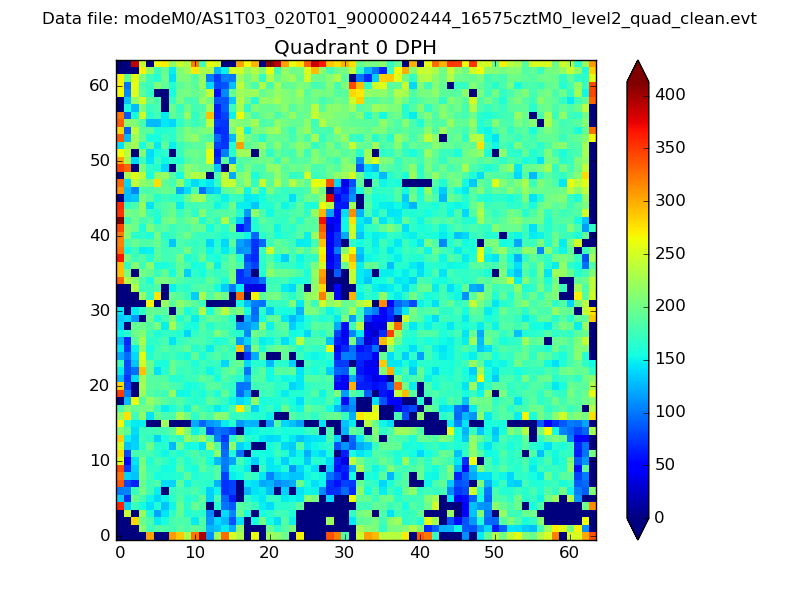 |
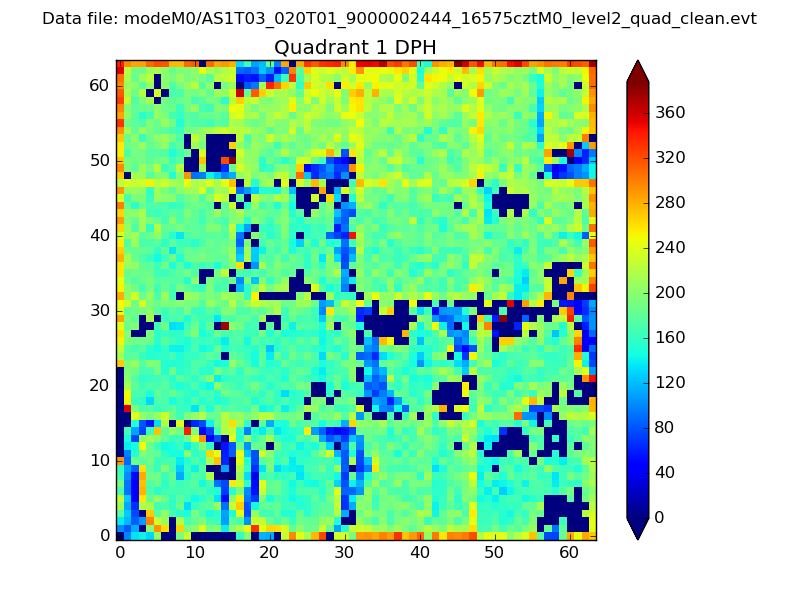 |
Quadrant B |
|---|---|---|---|
| Quadrant D | 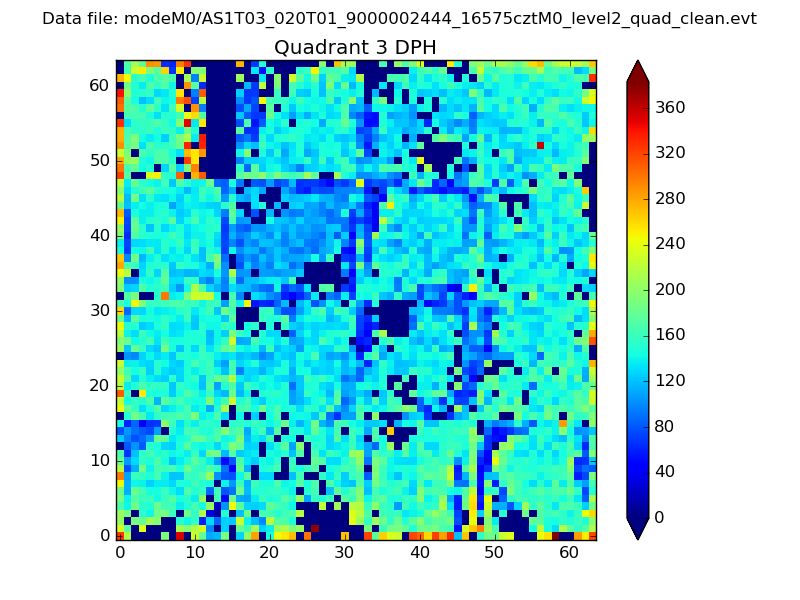 |
 |
Quadrant C |
| Plot type | Count rate plots | Images |
|---|---|---|
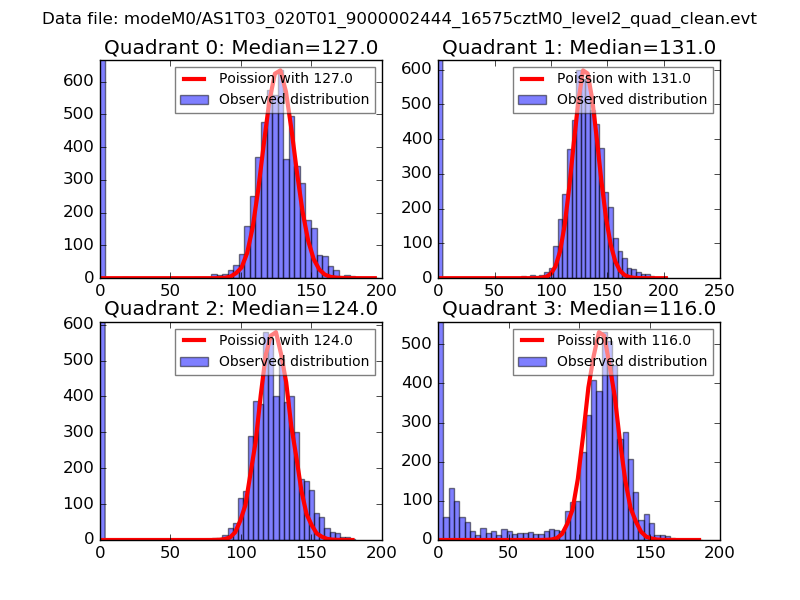
| Comparison with Poisson distribution Blue bars denote a histogram of data divided into 1 sec bins. Red curve is a Poisson curve with rate = median count rate of data. |
 |
 |
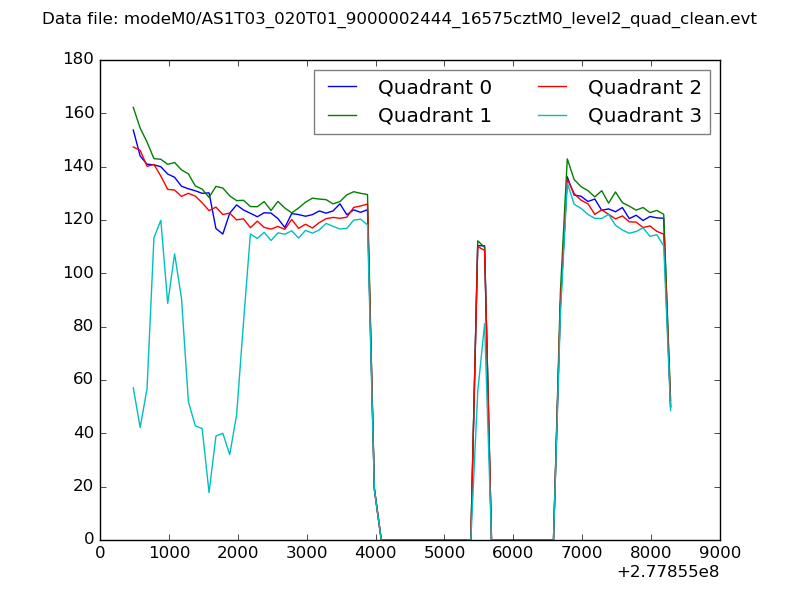
| Quadrant-wise count rates Data is divided into 100 sec bins |
 |
|
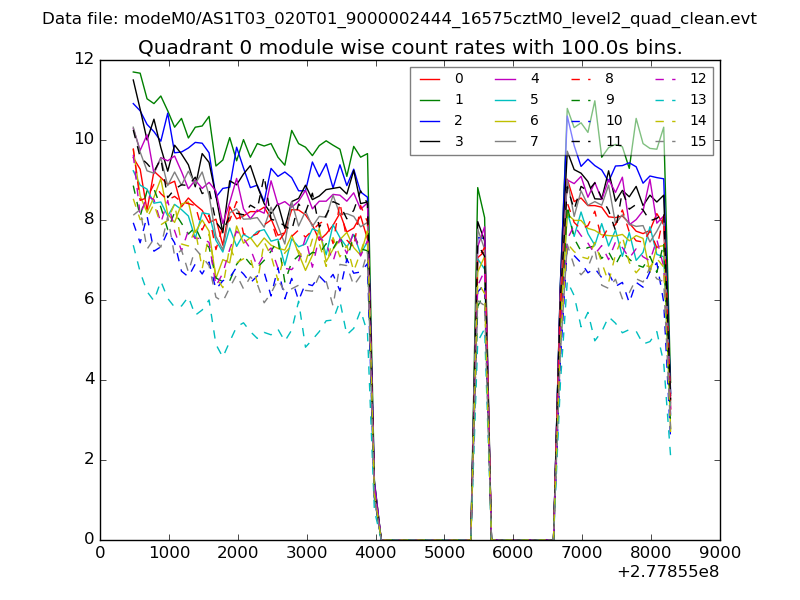
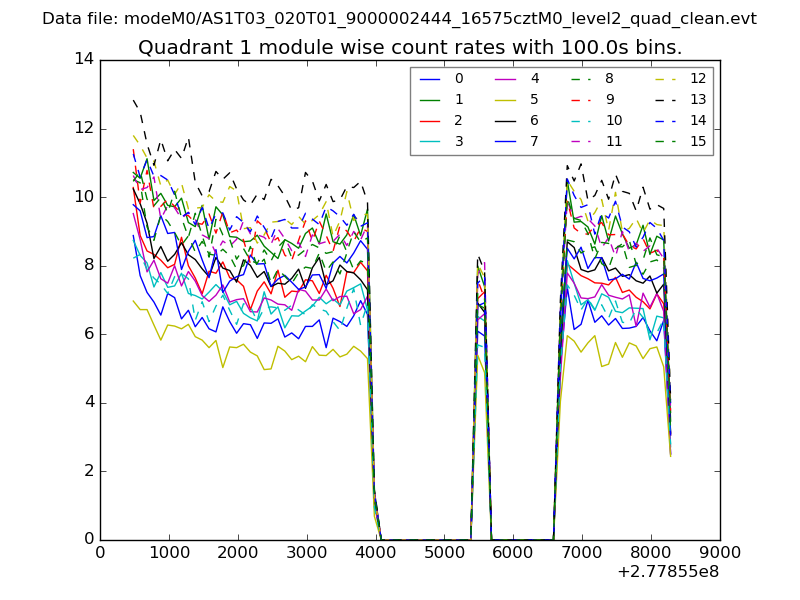
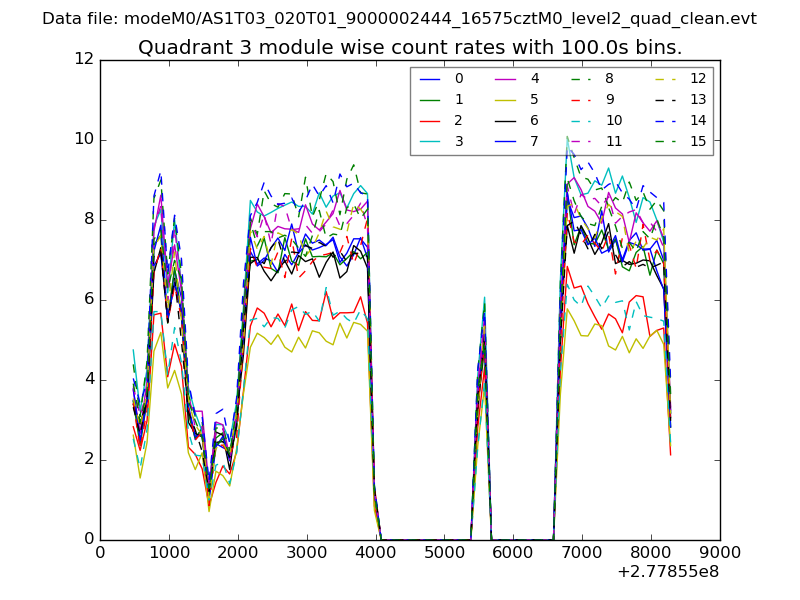
| Module-wise count rates for Quadrant A Data is divided into 100 sec bins |
 |
 |
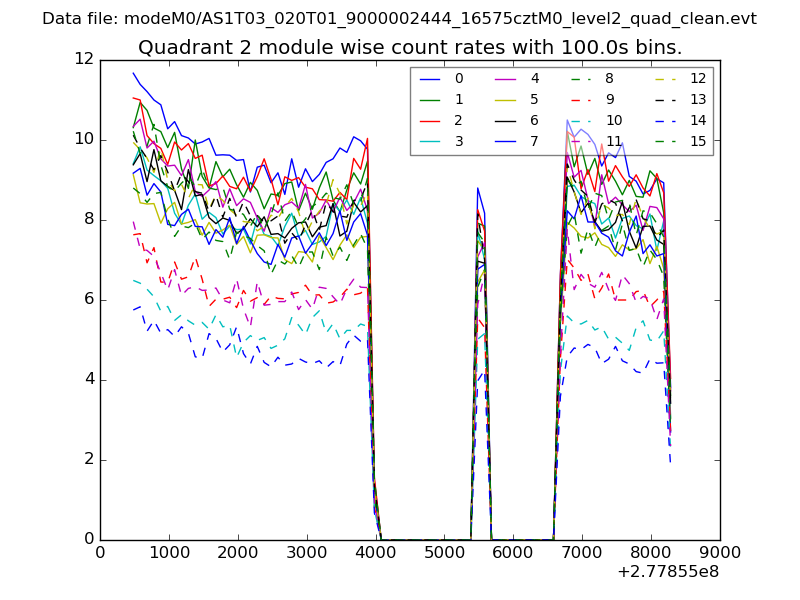
| Module-wise count rates for Quadrant B Data is divided into 100 sec bins |
 |
 |
| Module-wise count rates for Quadrant C Data is divided into 100 sec bins |
 |
 |
| Module-wise count rates for Quadrant D Data is divided into 100 sec bins |
 |
 |
| Parameter | Plot |
|---|---|
| CZT HV Monitor | 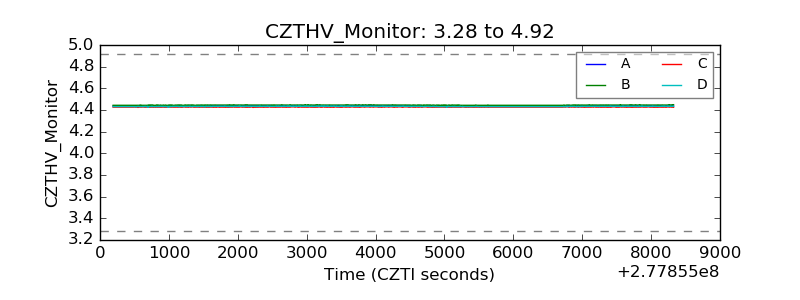 |
| D_VDD | 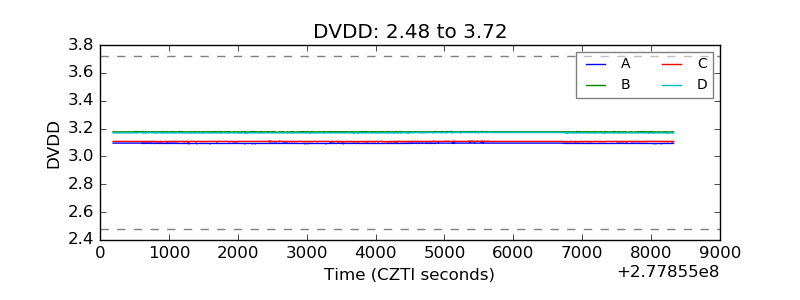 |
| Temperature 1 | 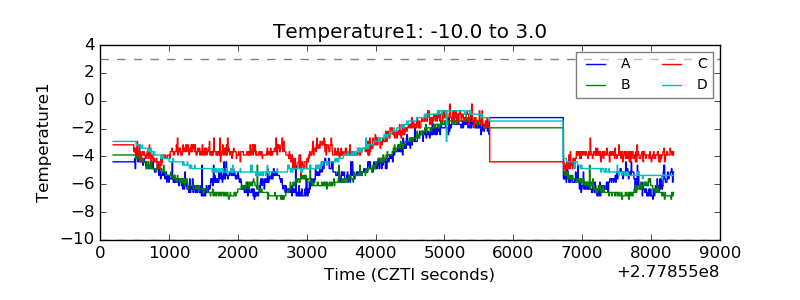 |
| Veto HV Monitor | 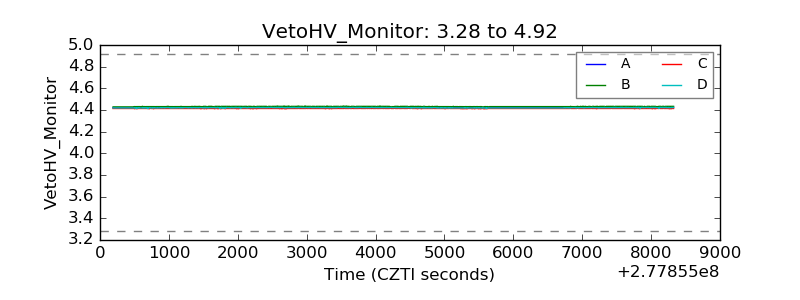 |
| Veto LLD | 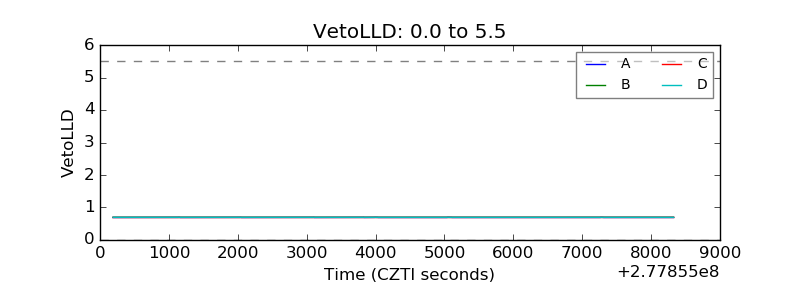 |
| Alpha Counter | 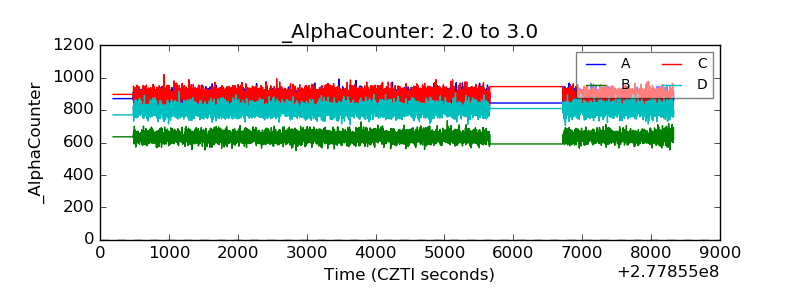 |
| _CPM_Rate | 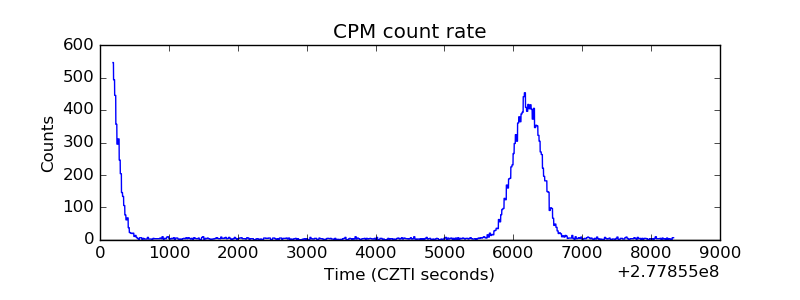 |
| CZT Counter | 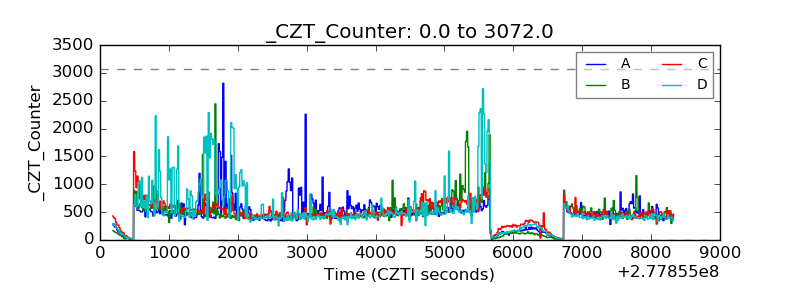 |
| +2.5 Volts monitor |  |
| +5 Volts monitor | 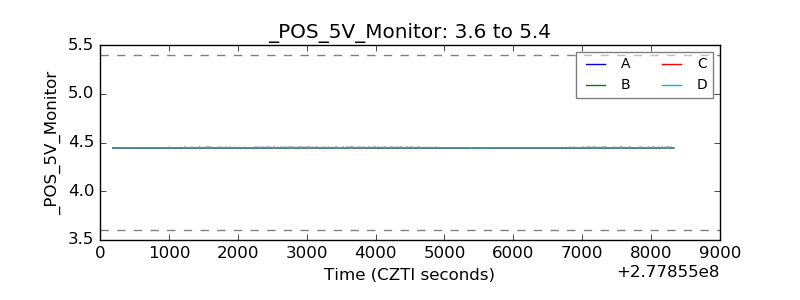 |
| _ROLL_ROT | 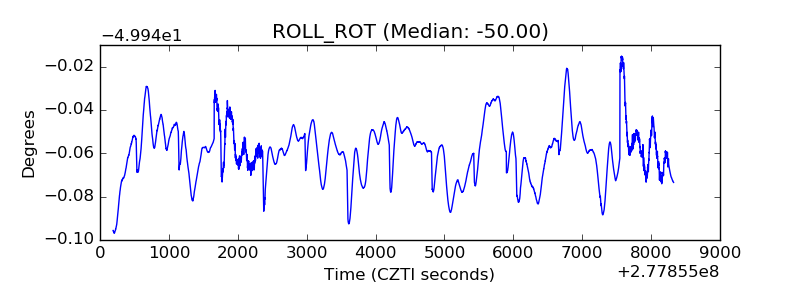 |
| _Roll_DEC | 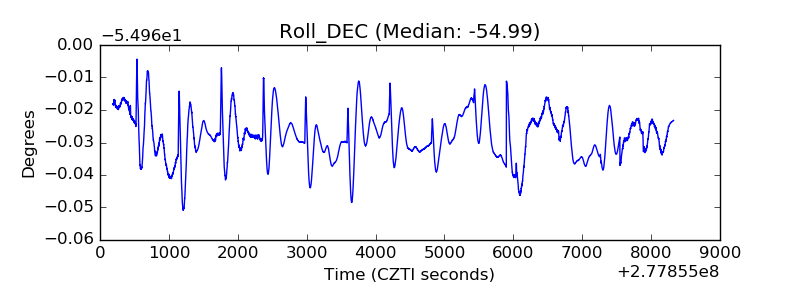 |
| _Roll_RA | 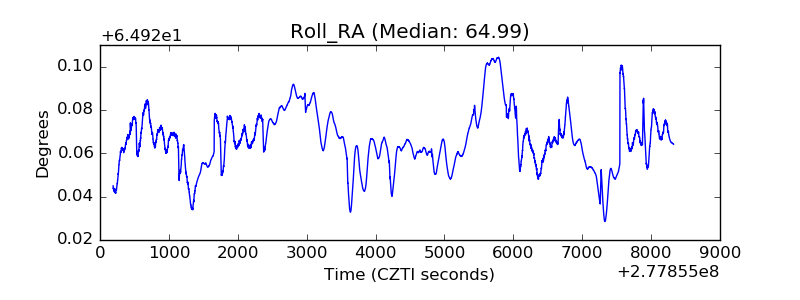 |
| Veto Counter | 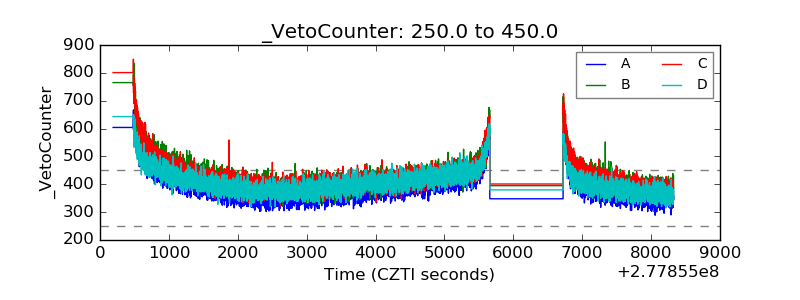 |