| Param | Original file | Final file |
|---|---|---|
| Filename | modeM0/AS1T03_020T01_9000002444_16576cztM0_level2.evt | modeM0/AS1T03_020T01_9000002444_16576cztM0_level2_quad_clean.evt |
| Size (bytes) | 535,014,720 | 106,536,960 |
| Size | 510.2 MB | 101.6 MB |
| Events in quadrant A | 3,302,740 | 696,171 |
| Events in quadrant B | 3,755,143 | 714,376 |
| Events in quadrant C | 5,208,588 | 663,788 |
| Events in quadrant D | 3,451,998 | 654,747 |
| Mode M9 | |||
|---|---|---|---|
| Quadrant | BADHDUFLAG | Total packets | Discarded packets |
| A | 0 | 11 | 0 |
| B | 0 | 11 | 0 |
| C | 0 | 11 | 0 |
| D | 0 | 12 | 0 |
| Mode SS | |||
|---|---|---|---|
| Quadrant | BADHDUFLAG | Total packets | Discarded packets |
| A | 0 | 144 | 0 |
| B | 0 | 144 | 0 |
| C | 0 | 144 | 0 |
| D | 0 | 144 | 0 |
| Mode M0 | |||
|---|---|---|---|
| Quadrant | BADHDUFLAG | Total packets | Discarded packets |
| A | 0 | 14808 | 3 |
| B | 0 | 16129 | 2 |
| C | 0 | 20204 | 2 |
| D | 0 | 15609 | 2 |
| Quadrant | Total seconds | Saturated seconds | Saturation percentage |
|---|---|---|---|
| A | 7146 | 19 | 0.265883% |
| B | 7146 | 59 | 0.825637% |
| C | 7146 | 248 | 3.470473% |
| D | 7146 | 137 | 1.917156% |
Noise dominated data is calculated using 1-second bins in cleaned event files. If a bin has >2000 counts, and if more than 50% of those come from <1% of pixels, then it is considered to be noise-dominated and hence unusable.
| Quadrant | # 1 sec bins | Bins with >0 counts | Bins with >2000 counts | High rate bins dominated by noise | Noise dominated (total time) | Noise dominated (detector-on time) | Marked lightcurve |
|---|---|---|---|---|---|---|---|
| A | 7837 | 7148 | 1 | 1 | 0.01% | 0.01% | 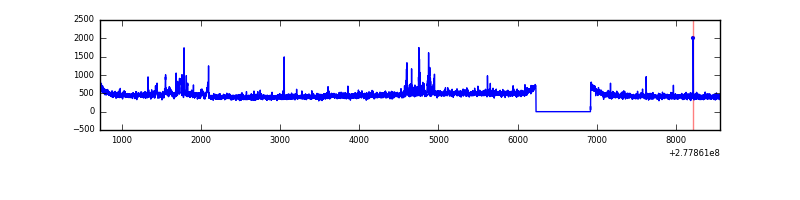 |
| B | 7837 | 7148 | 0 | 0 | 0.00% | 0.00% | 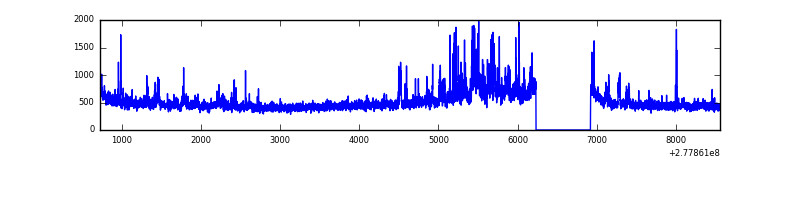 |
| C | 7837 | 7148 | 23 | 23 | 0.29% | 0.32% | 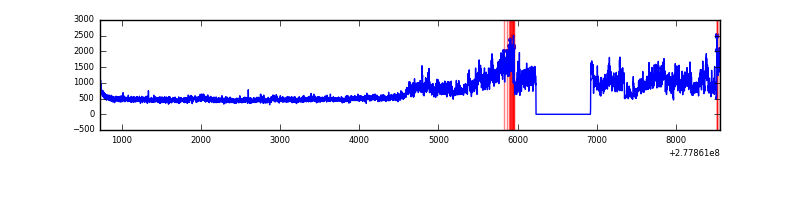 |
| D | 7837 | 7148 | 107 | 107 | 1.37% | 1.50% | 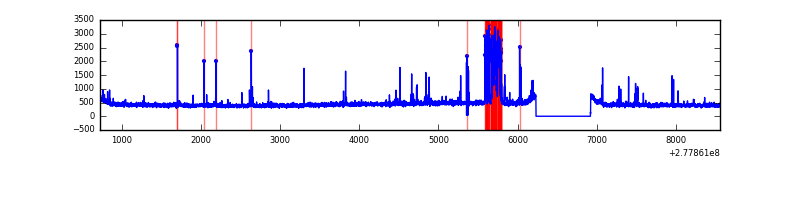 |
Top three noisy pixels from each quadrant. If the there are fewer than three noisy pixels in the level2.evt file, extra rows are filled as -1
| Pixel properties | Quadrant properties | ||||||
|---|---|---|---|---|---|---|---|
| Quadrant | DetID | PixID | Counts | Sigma | Mean | Median | Sigma |
| A | 15 | 174 | 127218 | 758.07 | 820 | 801 | 166.8 |
| A | 9 | 143 | 11063 | 61.54 | 820 | 801 | 166.8 |
| A | 0 | 226 | 7284 | 38.88 | 820 | 801 | 166.8 |
| B | 0 | 85 | 204302 | 1286.95 | 830 | 808 | 158.1 |
| B | 15 | 35 | 152466 | 959.12 | 830 | 808 | 158.1 |
| B | 0 | 229 | 51672 | 321.68 | 830 | 808 | 158.1 |
| C | 3 | 233 | 1984247 | 10808.61 | 791 | 796 | 183.5 |
| C | 14 | 238 | 122181 | 661.47 | 791 | 796 | 183.5 |
| C | 7 | 247 | 10236 | 51.44 | 791 | 796 | 183.5 |
| D | 10 | 70 | 332387 | 1739.32 | 794 | 772 | 190.7 |
| D | 2 | 14 | 53076 | 274.33 | 794 | 772 | 190.7 |
| D | 2 | 234 | 30347 | 155.12 | 794 | 772 | 190.7 |
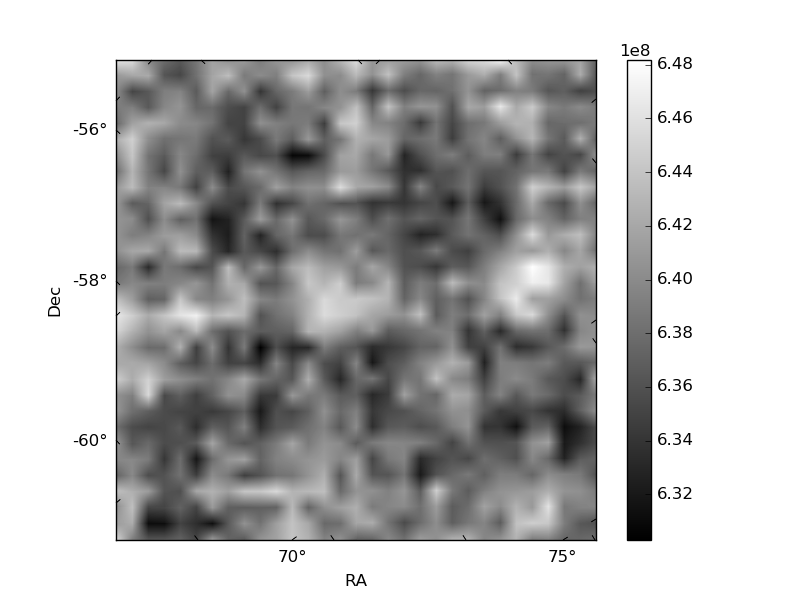
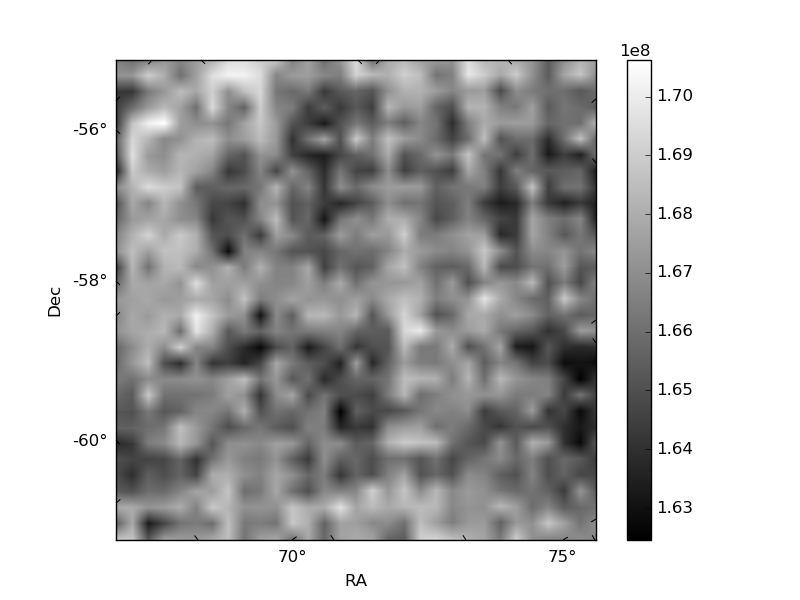
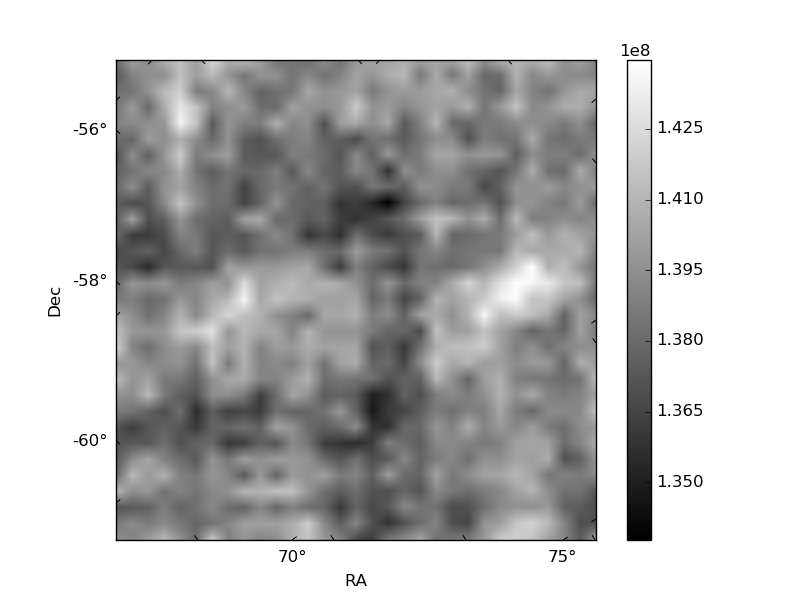
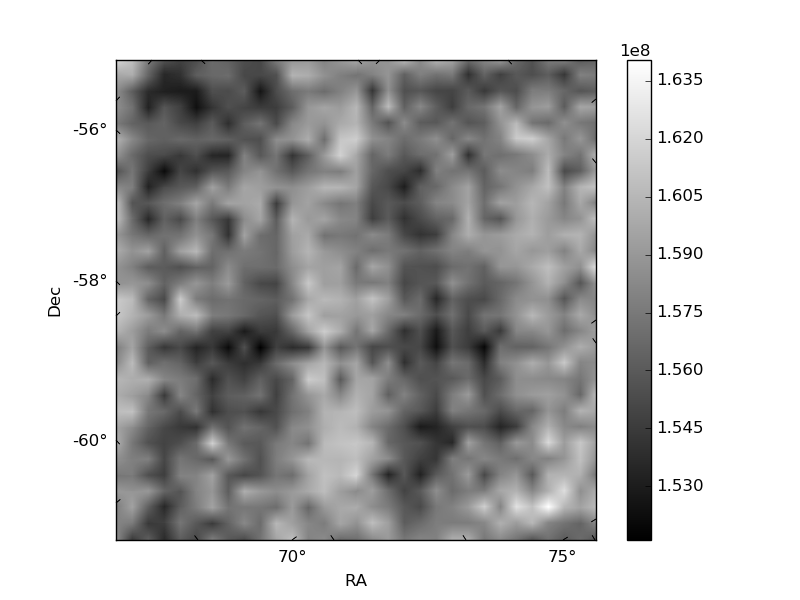
Histogram calculated using DETX and DETY for each event in the final _common_clean file
| Quadrant A | 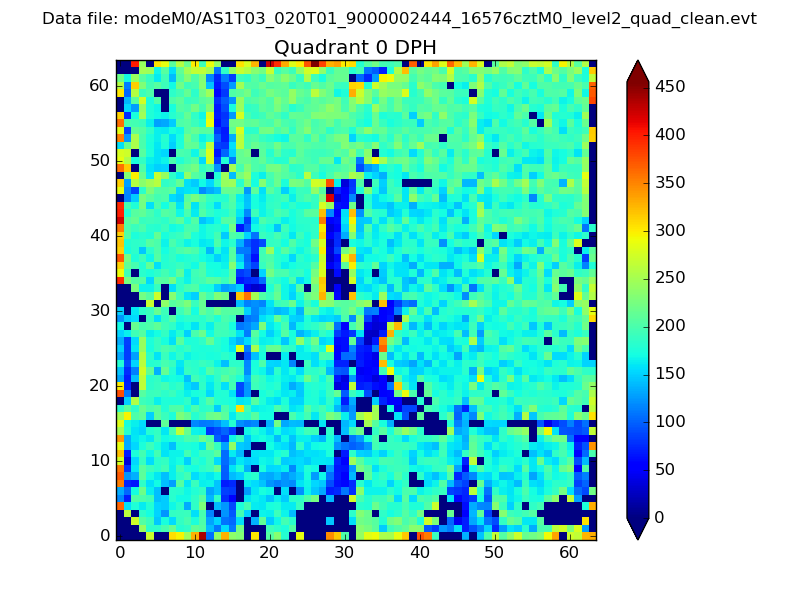 |
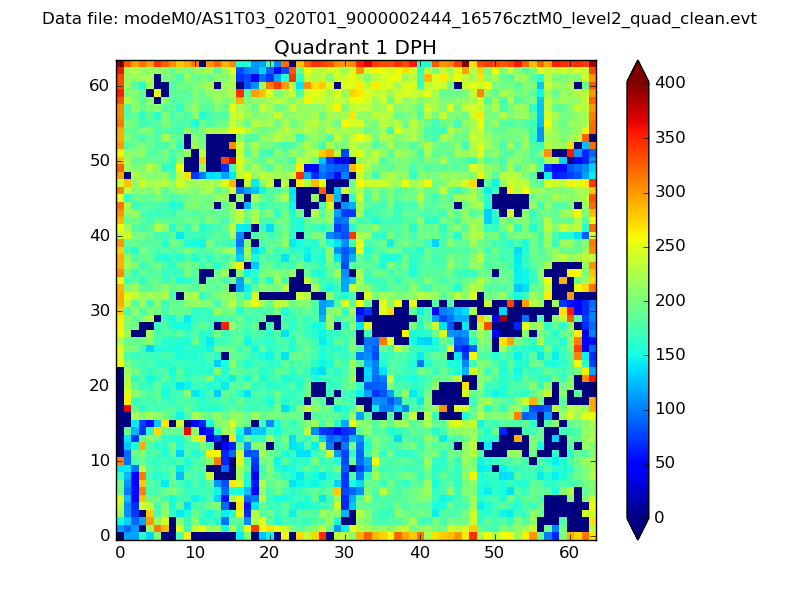 |
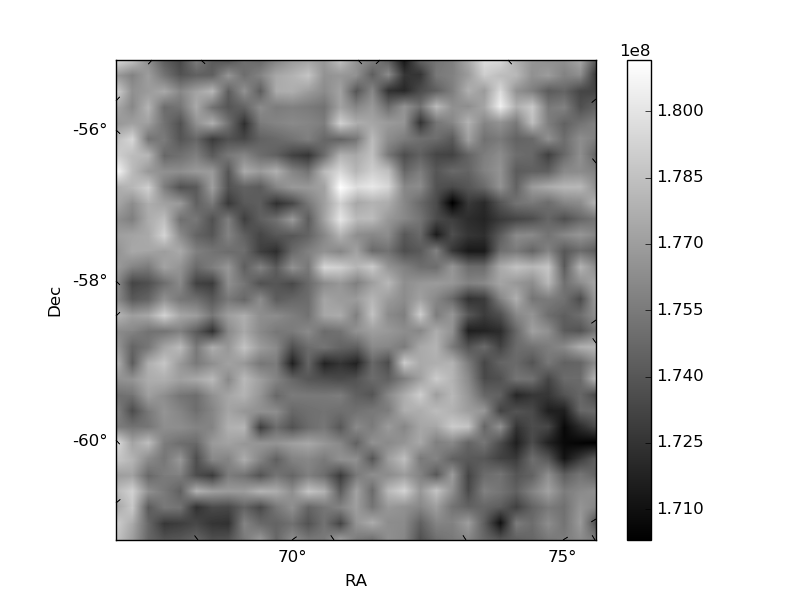
Quadrant B |
|---|---|---|---|
| Quadrant D | 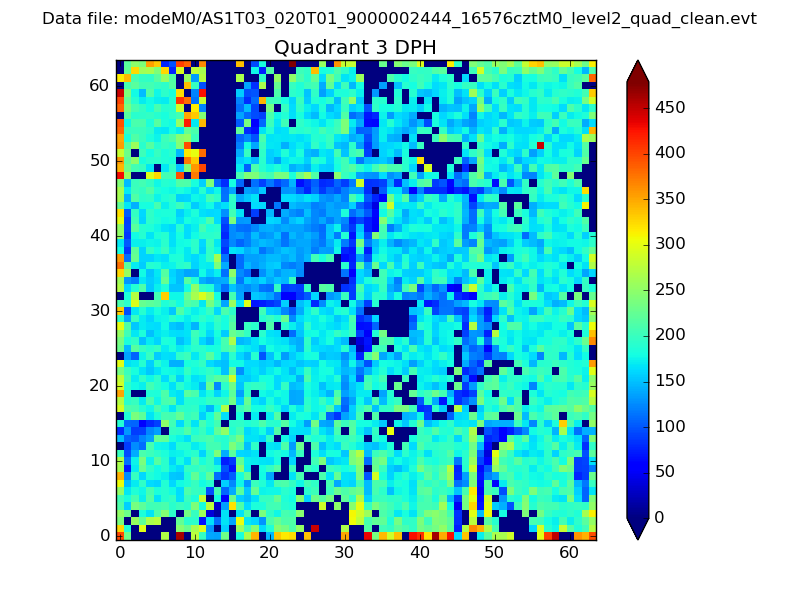 |
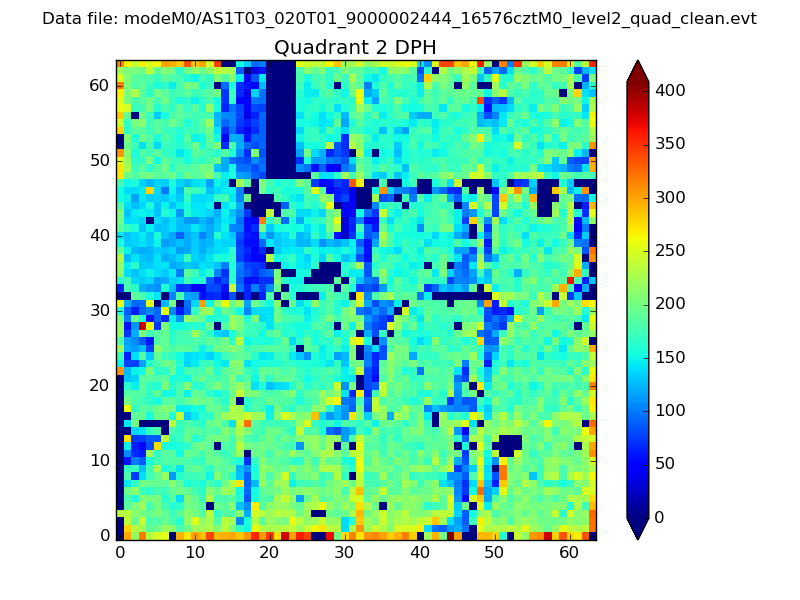 |
Quadrant C |
| Plot type | Count rate plots | Images |
|---|---|---|
| Comparison with Poisson distribution Blue bars denote a histogram of data divided into 1 sec bins. Red curve is a Poisson curve with rate = median count rate of data. |
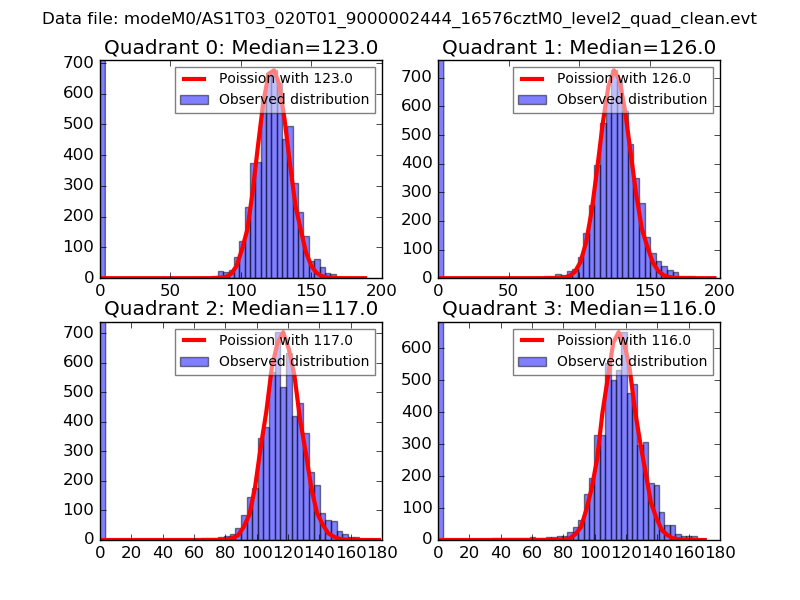 |
 |
| Quadrant-wise count rates Data is divided into 100 sec bins |
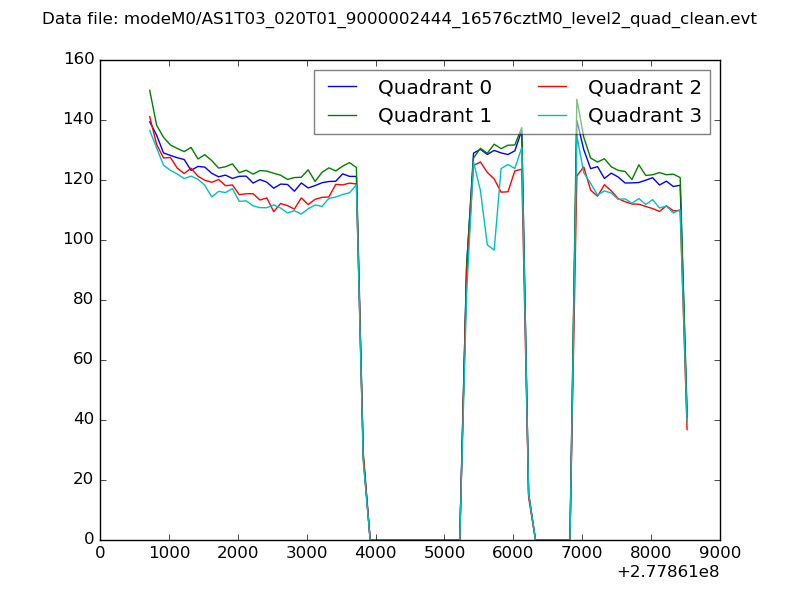 |
|
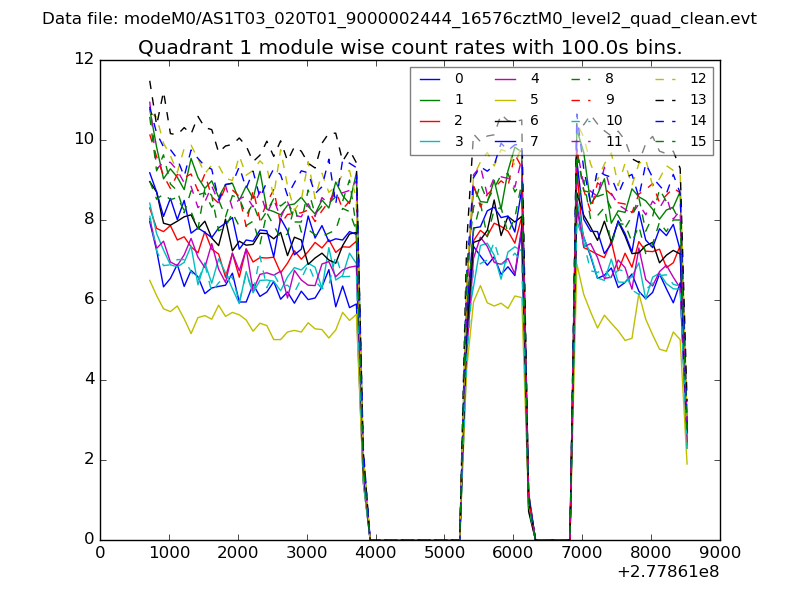
| Module-wise count rates for Quadrant A Data is divided into 100 sec bins |
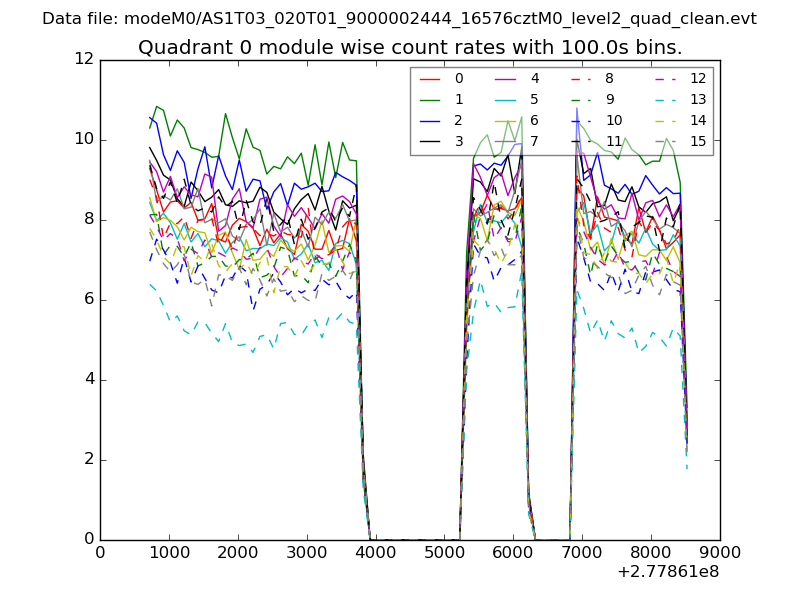 |
 |
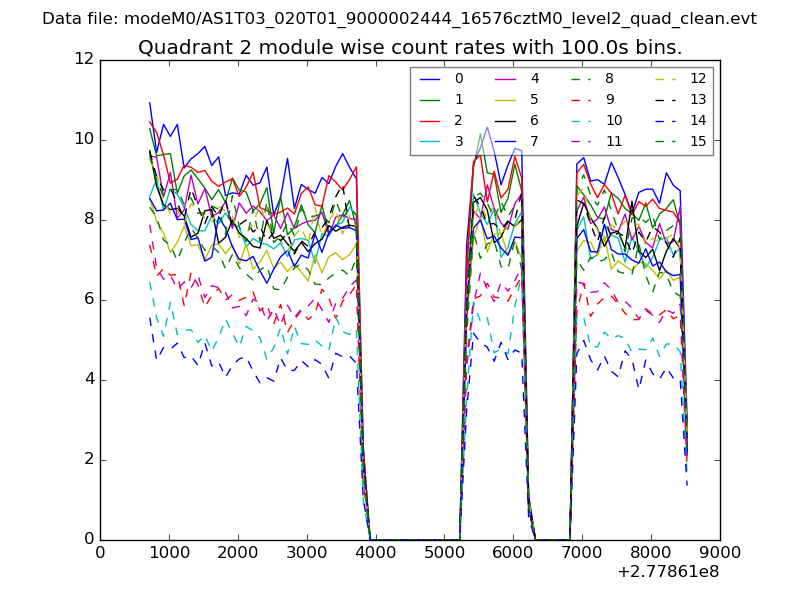
| Module-wise count rates for Quadrant B Data is divided into 100 sec bins |
 |
 |
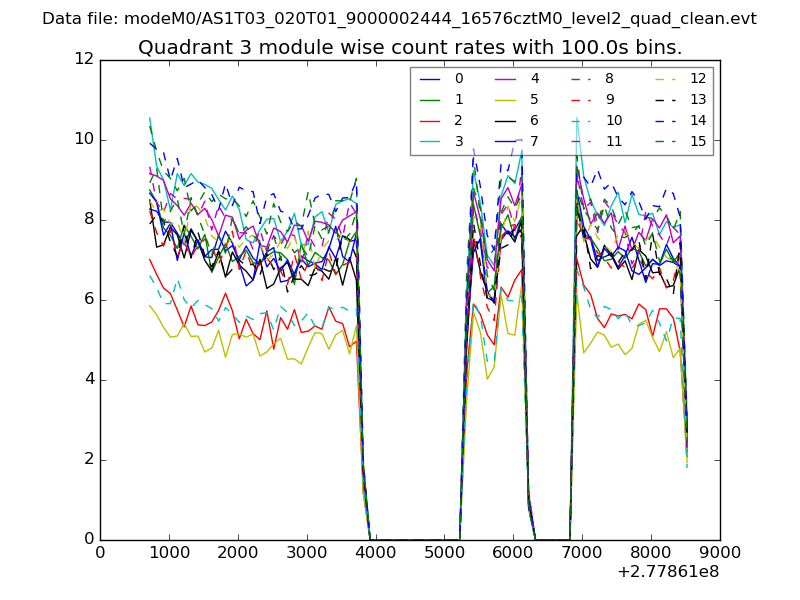
| Module-wise count rates for Quadrant C Data is divided into 100 sec bins |
 |
 |
| Module-wise count rates for Quadrant D Data is divided into 100 sec bins |
 |
 |
| Parameter | Plot |
|---|---|
| CZT HV Monitor | 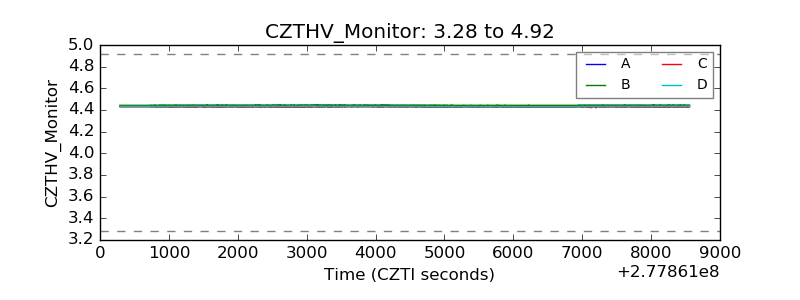 |
| D_VDD | 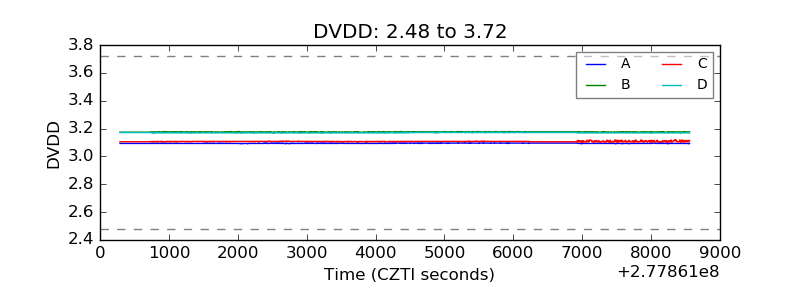 |
| Temperature 1 | 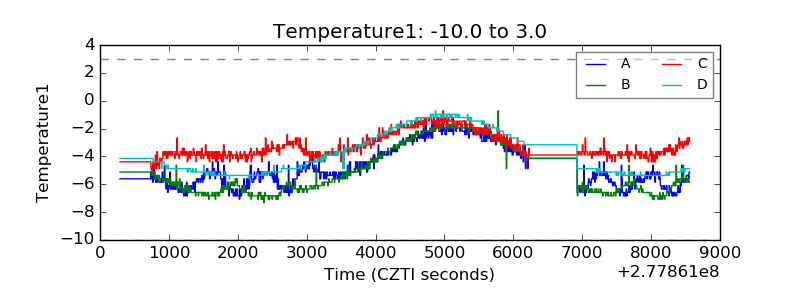 |
| Veto HV Monitor | 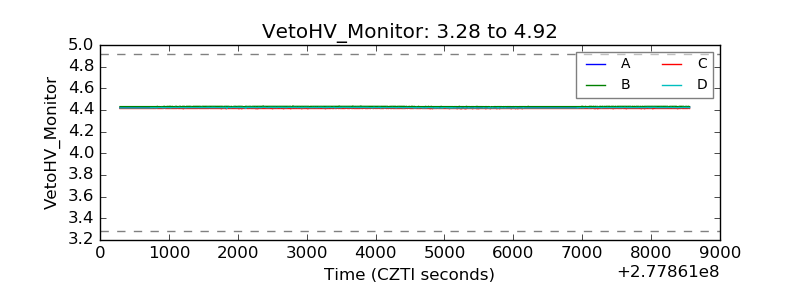 |
| Veto LLD | 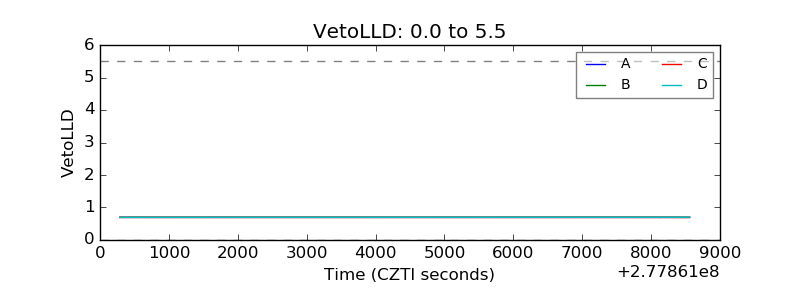 |
| Alpha Counter | 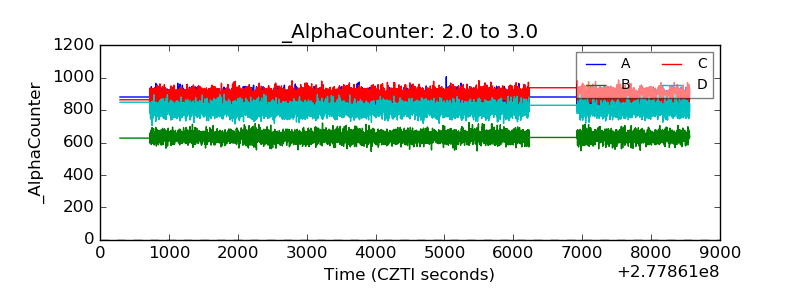 |
| _CPM_Rate | 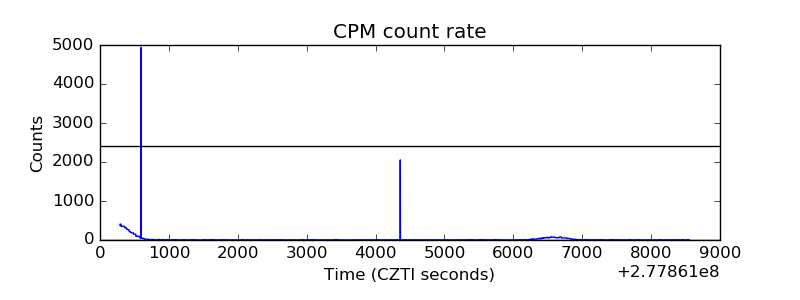 |
| CZT Counter | 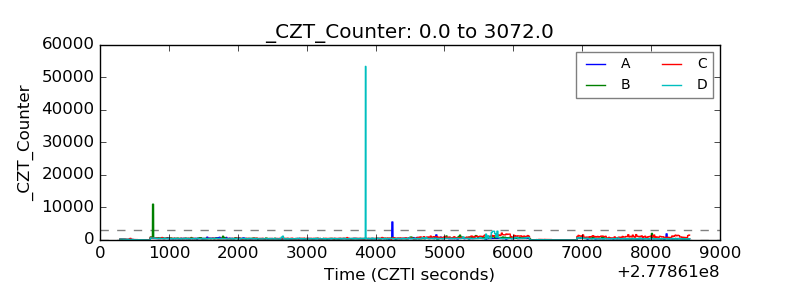 |
| +2.5 Volts monitor | 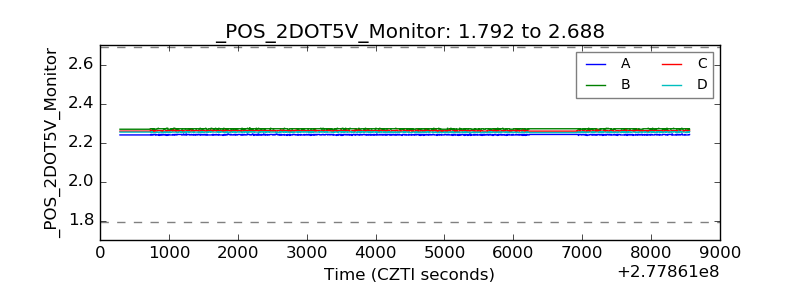 |
| +5 Volts monitor | 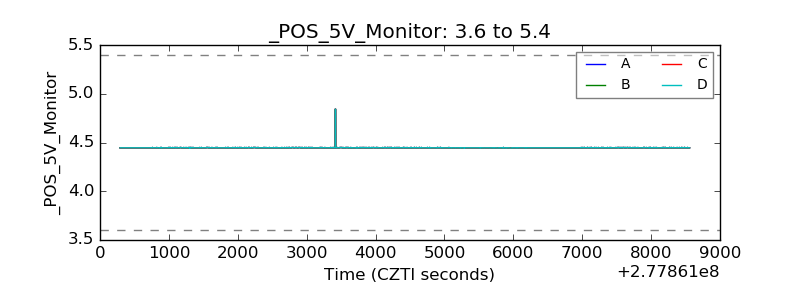 |
| _ROLL_ROT | 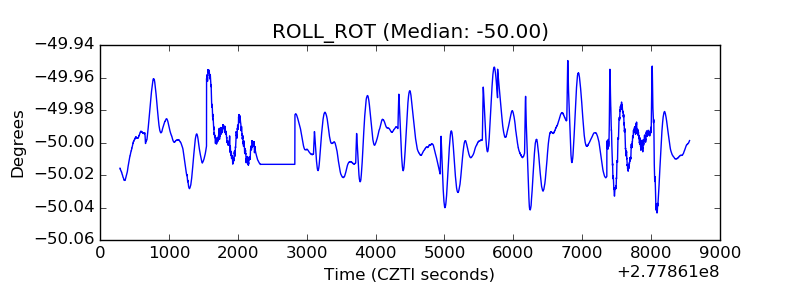 |
| _Roll_DEC | 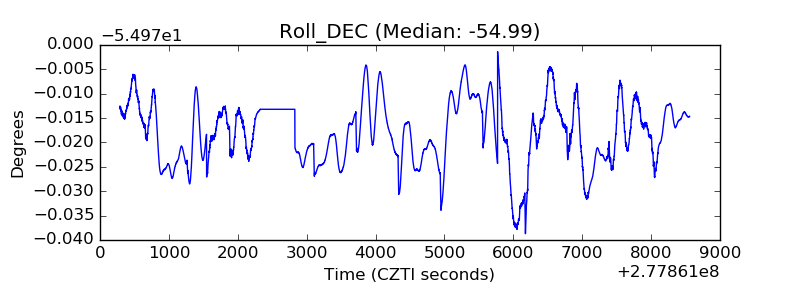 |
| _Roll_RA | 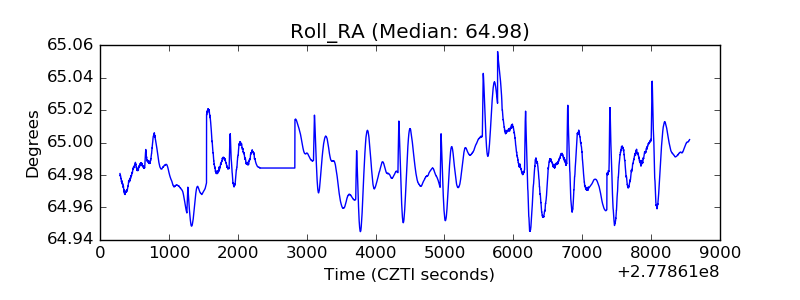 |
| Veto Counter | 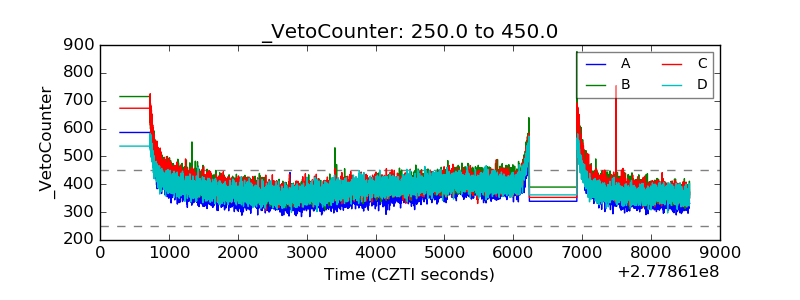 |