| Param | Original file | Final file |
|---|---|---|
| Filename | modeM0/AS1T03_020T01_9000002444_16579cztM0_level2.evt | modeM0/AS1T03_020T01_9000002444_16579cztM0_level2_quad_clean.evt |
| Size (bytes) | 548,470,080 | 84,983,040 |
| Size | 523.1 MB | 81.0 MB |
| Events in quadrant A | 3,347,698 | 603,802 |
| Events in quadrant B | 3,272,313 | 622,857 |
| Events in quadrant C | 5,160,572 | 582,392 |
| Events in quadrant D | 4,373,338 | 296,437 |
| Mode M9 | |||
|---|---|---|---|
| Quadrant | BADHDUFLAG | Total packets | Discarded packets |
| A | 0 | 4 | 0 |
| B | 0 | 4 | 0 |
| C | 0 | 4 | 0 |
| D | 0 | 4 | 0 |
| Mode SS | |||
|---|---|---|---|
| Quadrant | BADHDUFLAG | Total packets | Discarded packets |
| A | 0 | 134 | 0 |
| B | 0 | 134 | 0 |
| C | 0 | 134 | 0 |
| D | 0 | 134 | 0 |
| Mode M0 | |||
|---|---|---|---|
| Quadrant | BADHDUFLAG | Total packets | Discarded packets |
| A | 0 | 14623 | 2 |
| B | 0 | 14084 | 1 |
| C | 0 | 19939 | 1 |
| D | 0 | 17906 | 1 |
| Quadrant | Total seconds | Saturated seconds | Saturation percentage |
|---|---|---|---|
| A | 6696 | 161 | 2.404421% |
| B | 6696 | 119 | 1.777180% |
| C | 6696 | 301 | 4.495221% |
| D | 6696 | 3365 | 50.253883% |
Noise dominated data is calculated using 1-second bins in cleaned event files. If a bin has >2000 counts, and if more than 50% of those come from <1% of pixels, then it is considered to be noise-dominated and hence unusable.
| Quadrant | # 1 sec bins | Bins with >0 counts | Bins with >2000 counts | High rate bins dominated by noise | Noise dominated (total time) | Noise dominated (detector-on time) | Marked lightcurve |
|---|---|---|---|---|---|---|---|
| A | 7077 | 6698 | 36 | 36 | 0.51% | 0.54% | 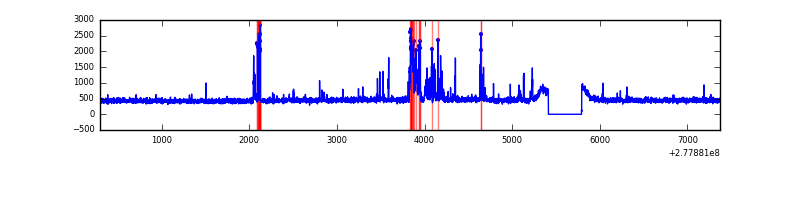 |
| B | 7077 | 6698 | 3 | 3 | 0.04% | 0.04% | 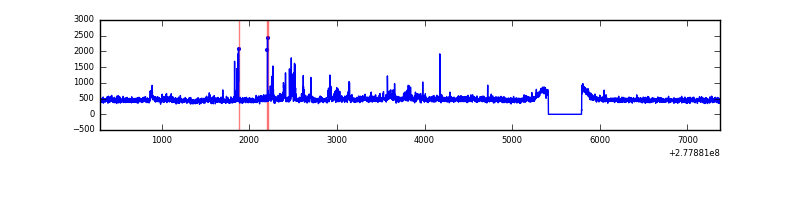 |
| C | 7077 | 6698 | 36 | 36 | 0.51% | 0.54% | 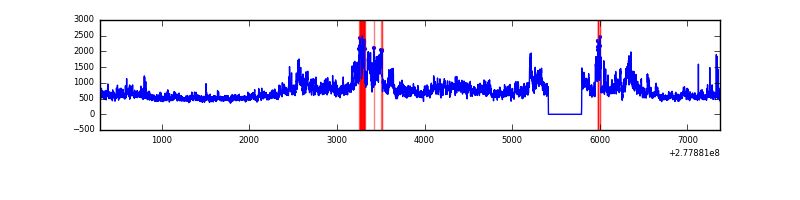 |
| D | 7076 | 6692 | 126 | 126 | 1.78% | 1.88% | 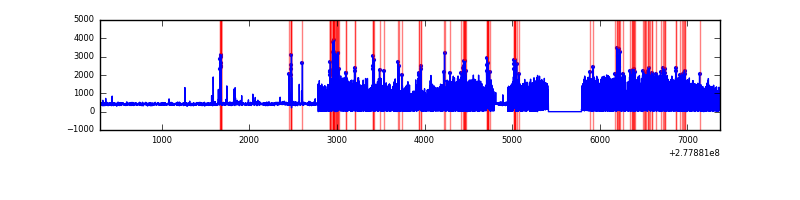 |
Top three noisy pixels from each quadrant. If the there are fewer than three noisy pixels in the level2.evt file, extra rows are filled as -1
| Pixel properties | Quadrant properties | ||||||
|---|---|---|---|---|---|---|---|
| Quadrant | DetID | PixID | Counts | Sigma | Mean | Median | Sigma |
| A | 15 | 174 | 250607 | 1578.83 | 774 | 755 | 158.3 |
| A | 9 | 143 | 81817 | 512.24 | 774 | 755 | 158.3 |
| A | 2 | 79 | 27311 | 167.81 | 774 | 755 | 158.3 |
| B | 15 | 35 | 103684 | 689.4 | 777 | 756 | 149.3 |
| B | 0 | 229 | 24818 | 161.16 | 777 | 756 | 149.3 |
| B | 0 | 214 | 21562 | 139.36 | 777 | 756 | 149.3 |
| C | 3 | 233 | 2143404 | 12258.61 | 744 | 747 | 174.8 |
| C | 14 | 238 | 112938 | 641.87 | 744 | 747 | 174.8 |
| C | 7 | 247 | 6275 | 31.63 | 744 | 747 | 174.8 |
| D | 1 | 52 | 2472810 | 21825.41 | 458 | 443 | 113.3 |
| D | 10 | 70 | 136181 | 1198.26 | 458 | 443 | 113.3 |
| D | 2 | 14 | 18831 | 162.32 | 458 | 443 | 113.3 |
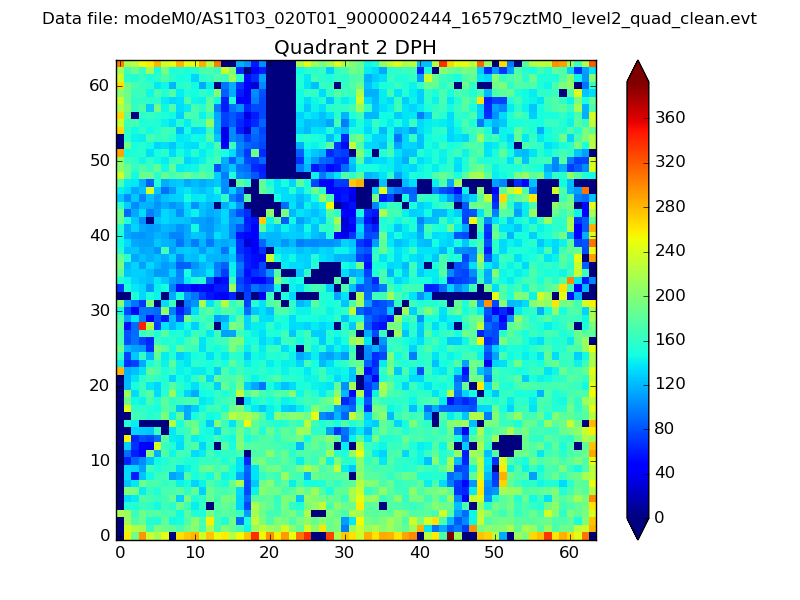
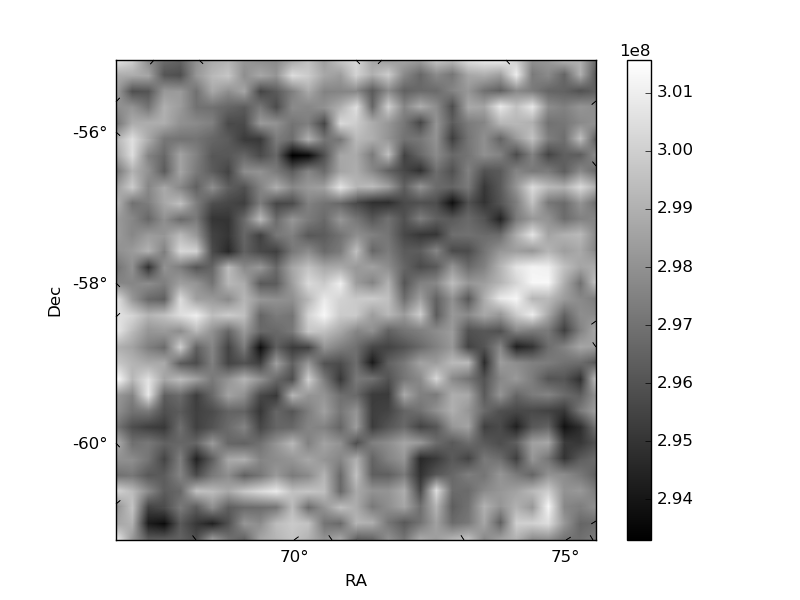
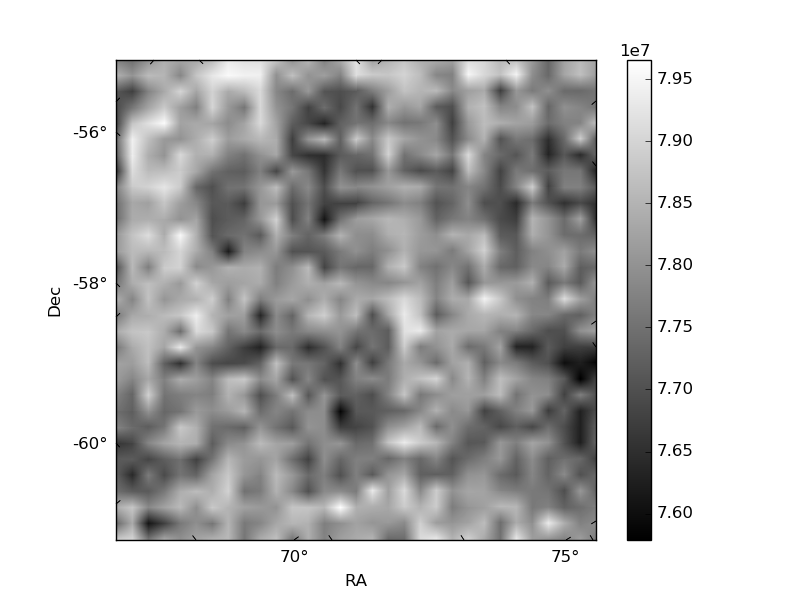
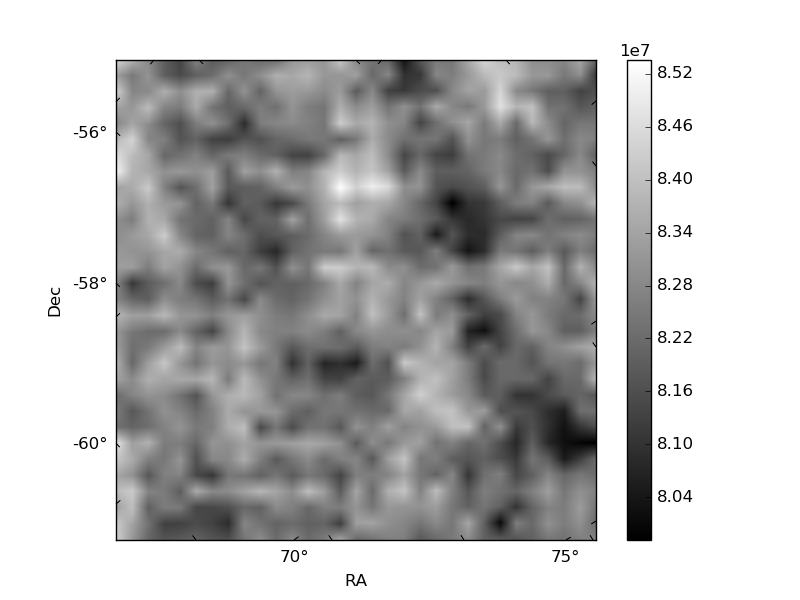
Histogram calculated using DETX and DETY for each event in the final _common_clean file
| Quadrant A | 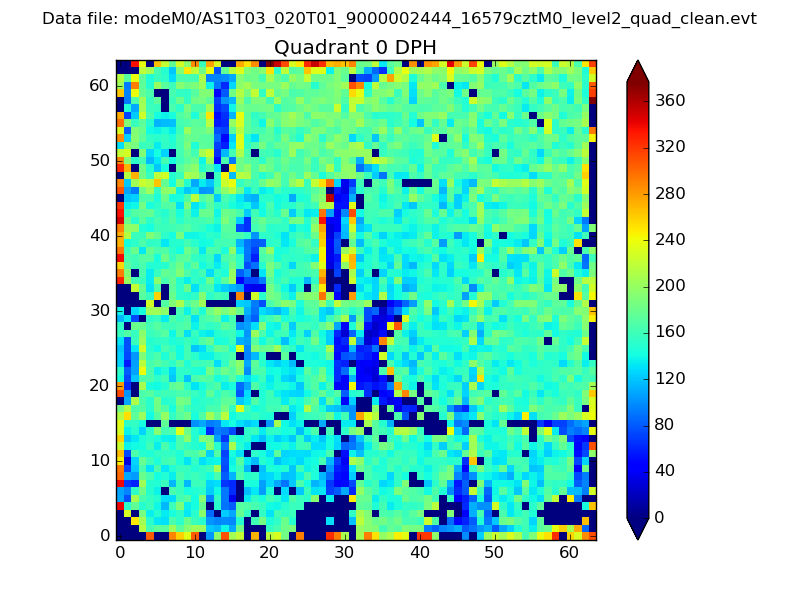 |
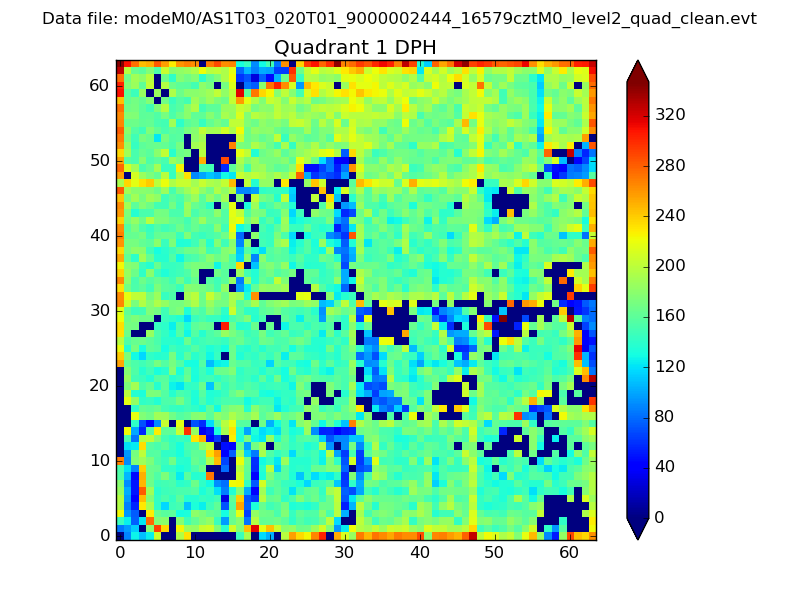 |
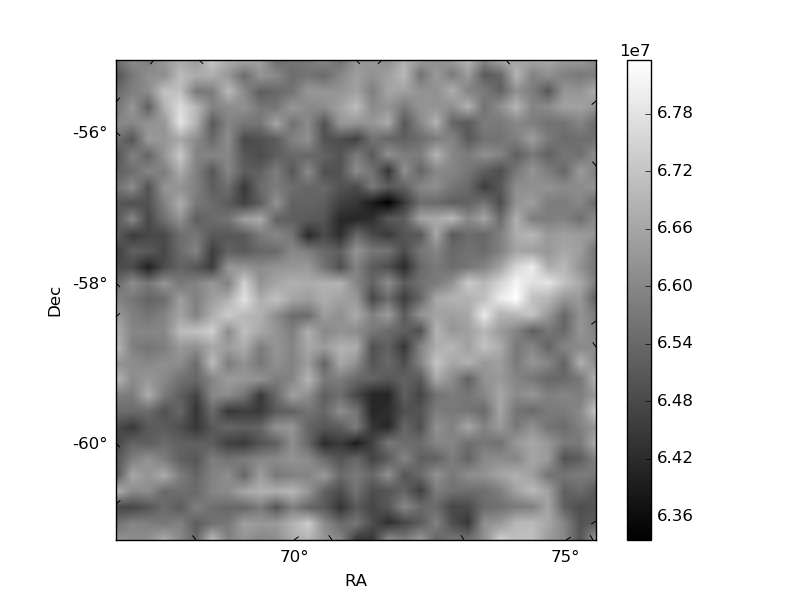
Quadrant B |
|---|---|---|---|
| Quadrant D | 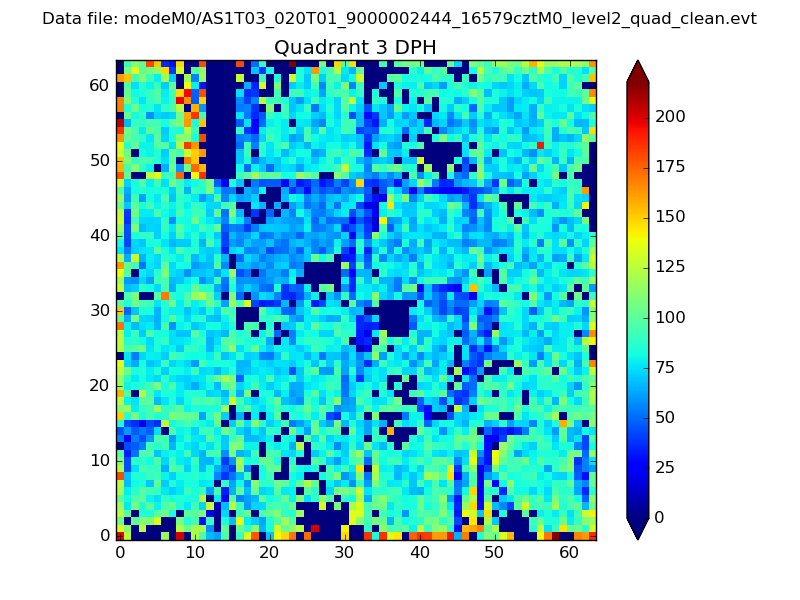 |
 |
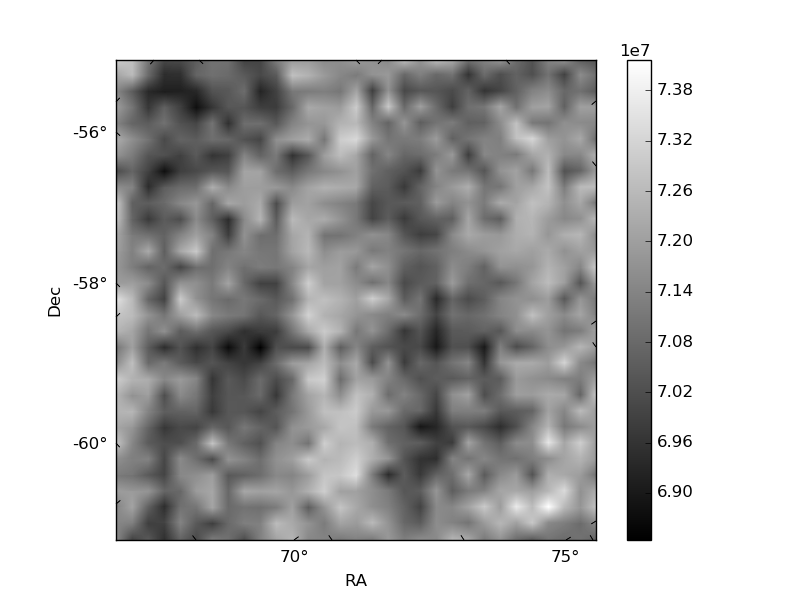
Quadrant C |
| Plot type | Count rate plots | Images |
|---|---|---|
| Comparison with Poisson distribution Blue bars denote a histogram of data divided into 1 sec bins. Red curve is a Poisson curve with rate = median count rate of data. |
 |
 |
| Quadrant-wise count rates Data is divided into 100 sec bins |
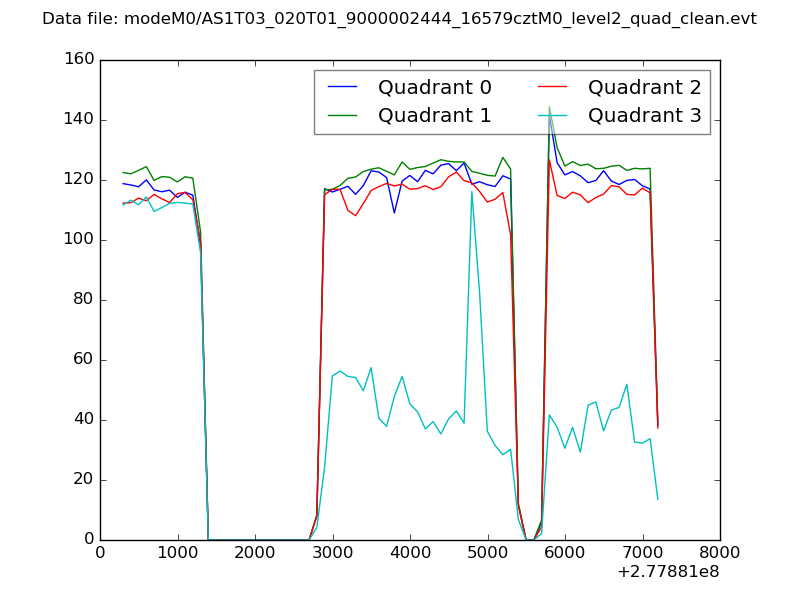 |
|
| Module-wise count rates for Quadrant A Data is divided into 100 sec bins |
 |
 |
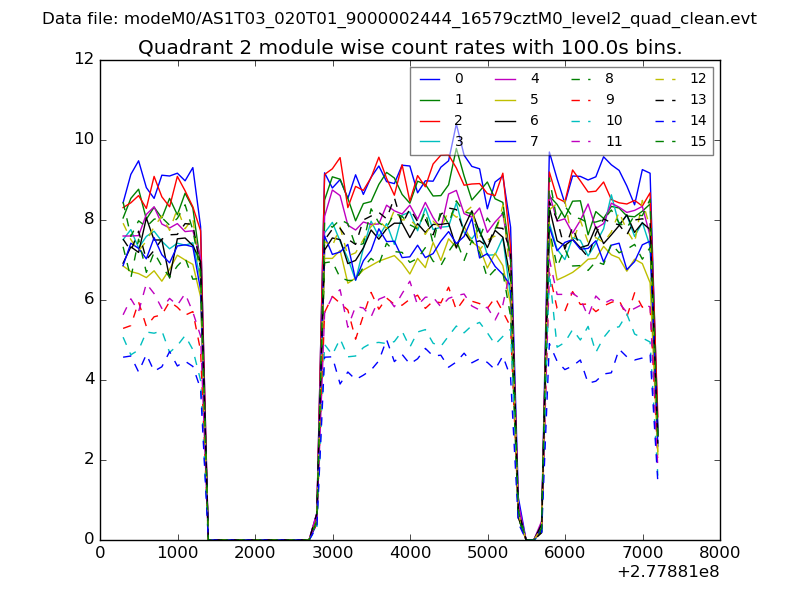
| Module-wise count rates for Quadrant B Data is divided into 100 sec bins |
 |
 |
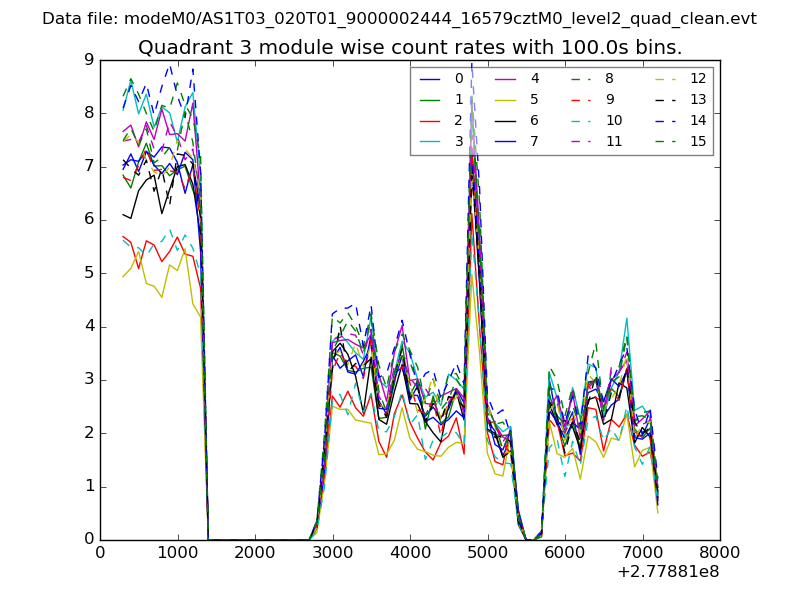
| Module-wise count rates for Quadrant C Data is divided into 100 sec bins |
 |
 |
| Module-wise count rates for Quadrant D Data is divided into 100 sec bins |
 |
 |
| Parameter | Plot |
|---|---|
| CZT HV Monitor |  |
| D_VDD | 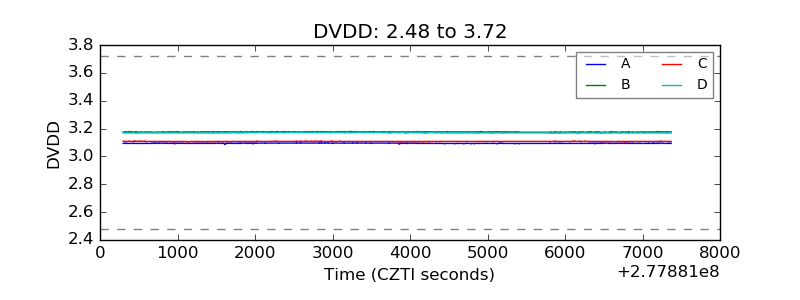 |
| Temperature 1 | 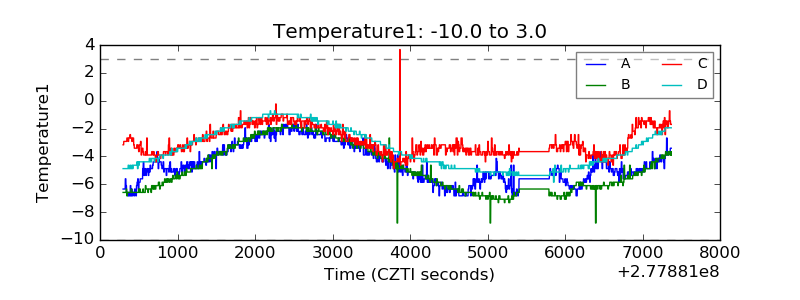 |
| Veto HV Monitor |  |
| Veto LLD |  |
| Alpha Counter | 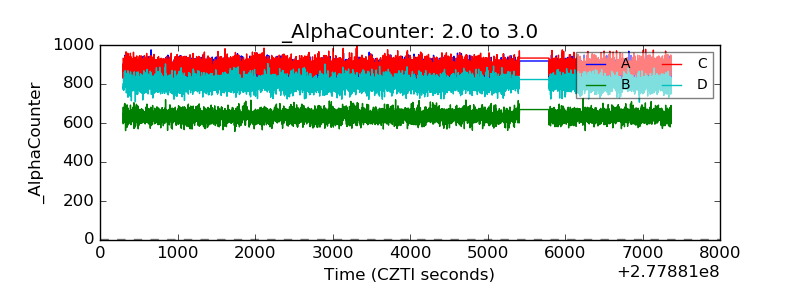 |
| _CPM_Rate | 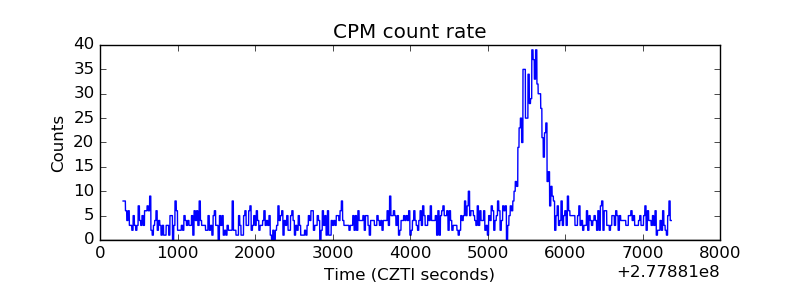 |
| CZT Counter | 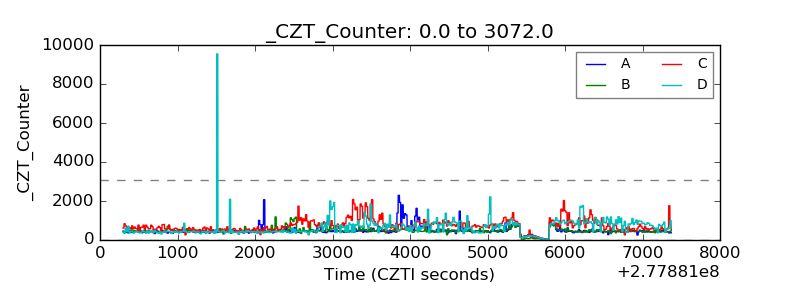 |
| +2.5 Volts monitor | 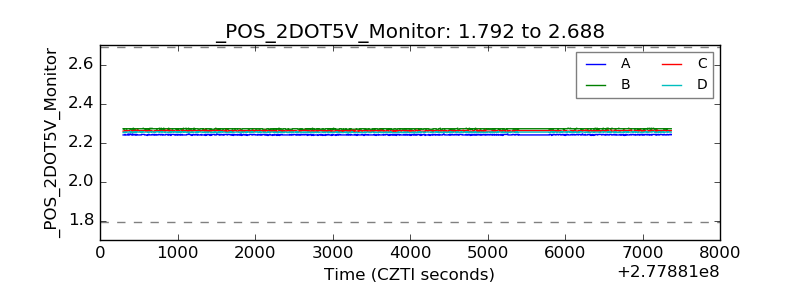 |
| +5 Volts monitor |  |
| _ROLL_ROT |  |
| _Roll_DEC | 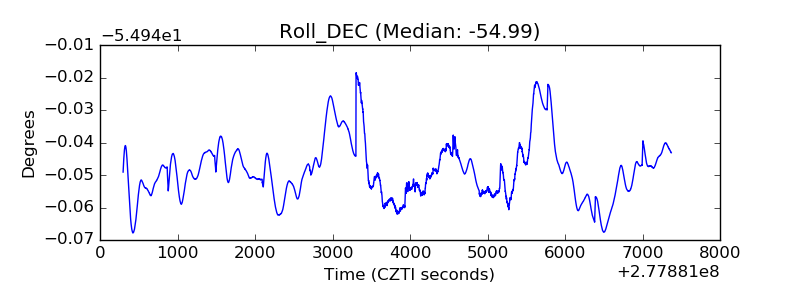 |
| _Roll_RA | 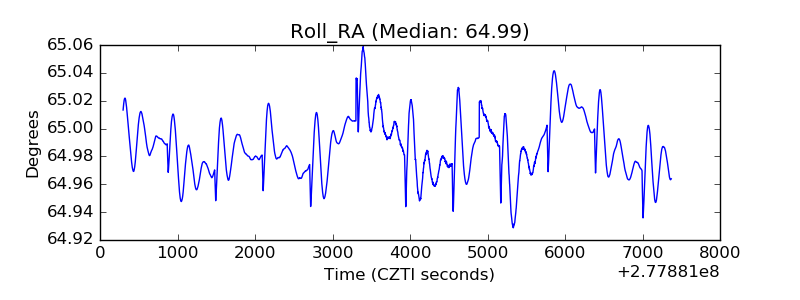 |
| Veto Counter | 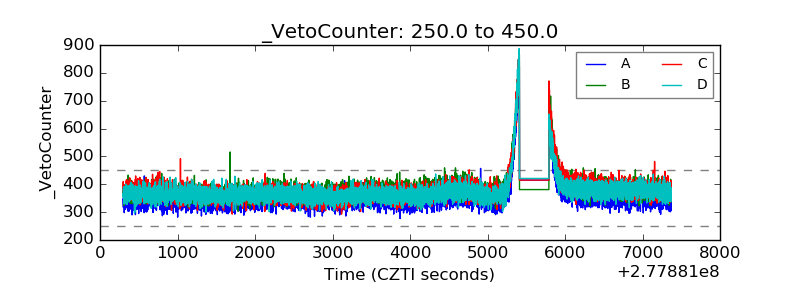 |