| Param | Original file | Final file |
|---|---|---|
| Filename | modeM0/AS1T03_020T01_9000002444_16583cztM0_level2.evt | modeM0/AS1T03_020T01_9000002444_16583cztM0_level2_quad_clean.evt |
| Size (bytes) | 1,508,201,280 | 208,379,520 |
| Size | 1.4 GB | 198.7 MB |
| Events in quadrant A | 8,256,205 | 1,345,685 |
| Events in quadrant B | 8,807,741 | 1,369,730 |
| Events in quadrant C | 18,336,729 | 1,257,741 |
| Events in quadrant D | 9,181,004 | 1,217,021 |
| Mode M9 | |||
|---|---|---|---|
| Quadrant | BADHDUFLAG | Total packets | Discarded packets |
| A | 0 | 28 | 0 |
| B | 0 | 28 | 0 |
| C | 0 | 28 | 0 |
| D | 0 | 28 | 0 |
| Mode SS | |||
|---|---|---|---|
| Quadrant | BADHDUFLAG | Total packets | Discarded packets |
| A | 0 | 330 | 0 |
| B | 0 | 330 | 0 |
| C | 0 | 330 | 0 |
| D | 0 | 330 | 0 |
| Mode M0 | |||
|---|---|---|---|
| Quadrant | BADHDUFLAG | Total packets | Discarded packets |
| A | 0 | 35805 | 4 |
| B | 0 | 36588 | 3 |
| C | 0 | 66149 | 3 |
| D | 0 | 39044 | 3 |
| Quadrant | Total seconds | Saturated seconds | Saturation percentage |
|---|---|---|---|
| A | 16240 | 361 | 2.222906% |
| B | 16240 | 256 | 1.576355% |
| C | 16240 | 2056 | 12.660099% |
| D | 16240 | 1341 | 8.257389% |
Noise dominated data is calculated using 1-second bins in cleaned event files. If a bin has >2000 counts, and if more than 50% of those come from <1% of pixels, then it is considered to be noise-dominated and hence unusable.
| Quadrant | # 1 sec bins | Bins with >0 counts | Bins with >2000 counts | High rate bins dominated by noise | Noise dominated (total time) | Noise dominated (detector-on time) | Marked lightcurve |
|---|---|---|---|---|---|---|---|
| A | 19001 | 16244 | 154 | 154 | 0.81% | 0.95% | 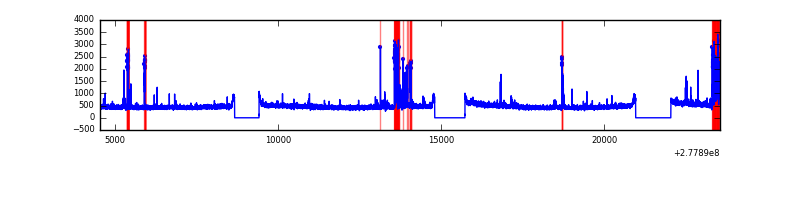 |
| B | 19001 | 16244 | 20 | 20 | 0.11% | 0.12% | 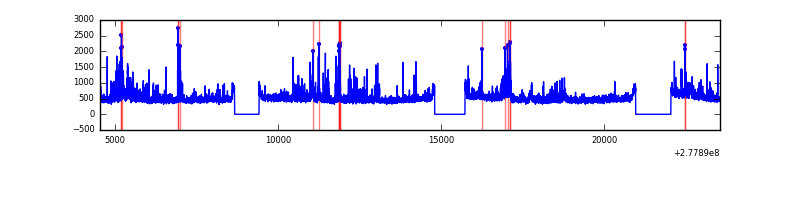 |
| C | 19001 | 16244 | 726 | 726 | 3.82% | 4.47% | 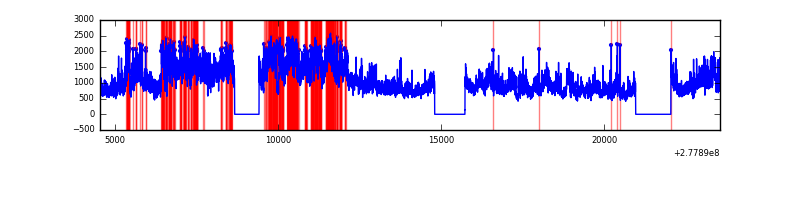 |
| D | 19001 | 16243 | 317 | 317 | 1.67% | 1.95% | 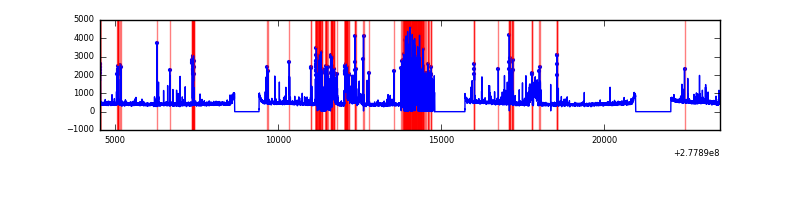 |
Top three noisy pixels from each quadrant. If the there are fewer than three noisy pixels in the level2.evt file, extra rows are filled as -1
| Pixel properties | Quadrant properties | ||||||
|---|---|---|---|---|---|---|---|
| Quadrant | DetID | PixID | Counts | Sigma | Mean | Median | Sigma |
| A | 15 | 174 | 766602 | 1996.55 | 1918 | 1876 | 383.0 |
| A | 9 | 143 | 105862 | 271.49 | 1918 | 1876 | 383.0 |
| A | 0 | 226 | 17171 | 39.93 | 1918 | 1876 | 383.0 |
| B | 15 | 35 | 429354 | 1171.13 | 1930 | 1879 | 365.0 |
| B | 0 | 85 | 287290 | 781.93 | 1930 | 1879 | 365.0 |
| B | 0 | 229 | 125939 | 339.88 | 1930 | 1879 | 365.0 |
| C | 3 | 233 | 10999880 | 26436.38 | 1800 | 1809 | 416.0 |
| C | 14 | 238 | 276215 | 659.6 | 1800 | 1809 | 416.0 |
| C | 7 | 247 | 40368 | 92.69 | 1800 | 1809 | 416.0 |
| D | 1 | 52 | 1307030 | 3042.72 | 1777 | 1725 | 429.0 |
| D | 7 | 38 | 579687 | 1347.25 | 1777 | 1725 | 429.0 |
| D | 10 | 70 | 391627 | 908.88 | 1777 | 1725 | 429.0 |
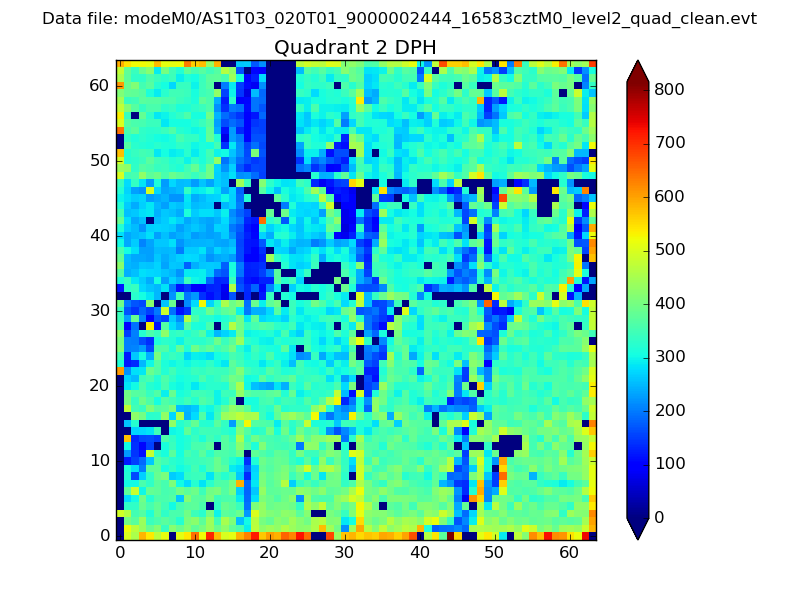
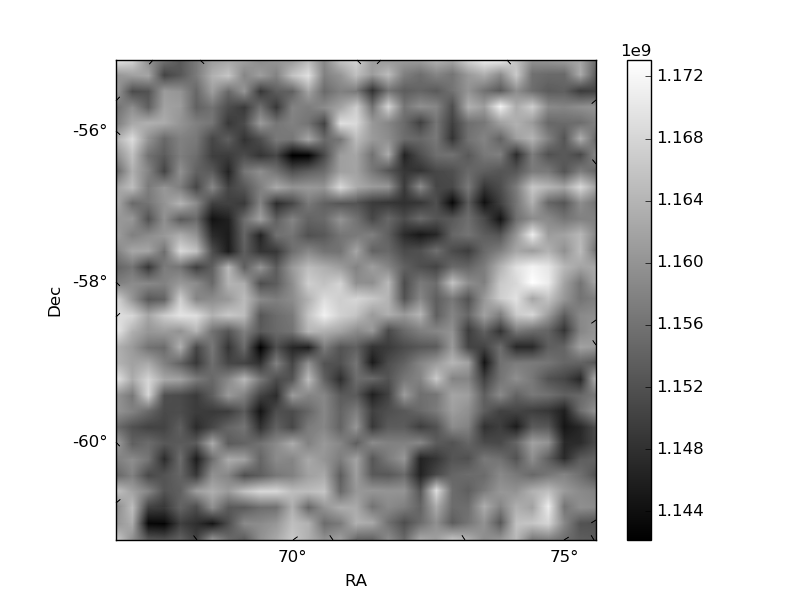
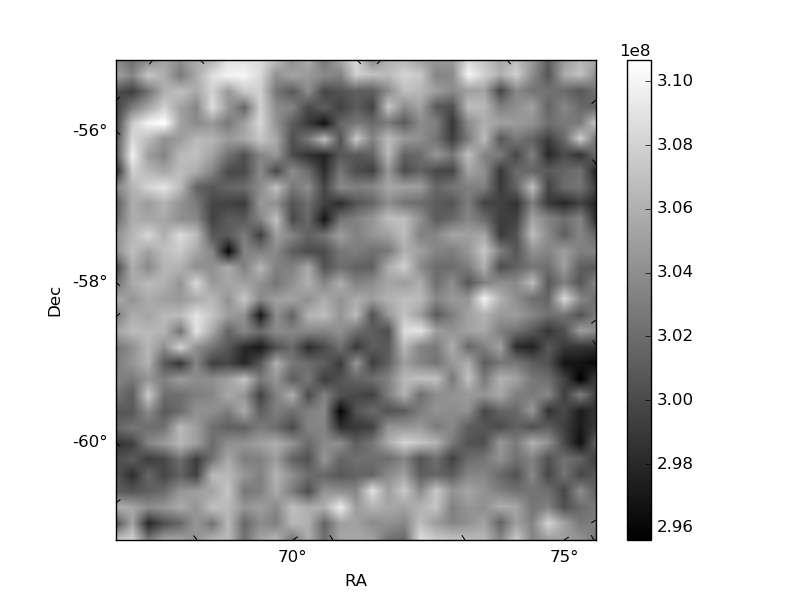
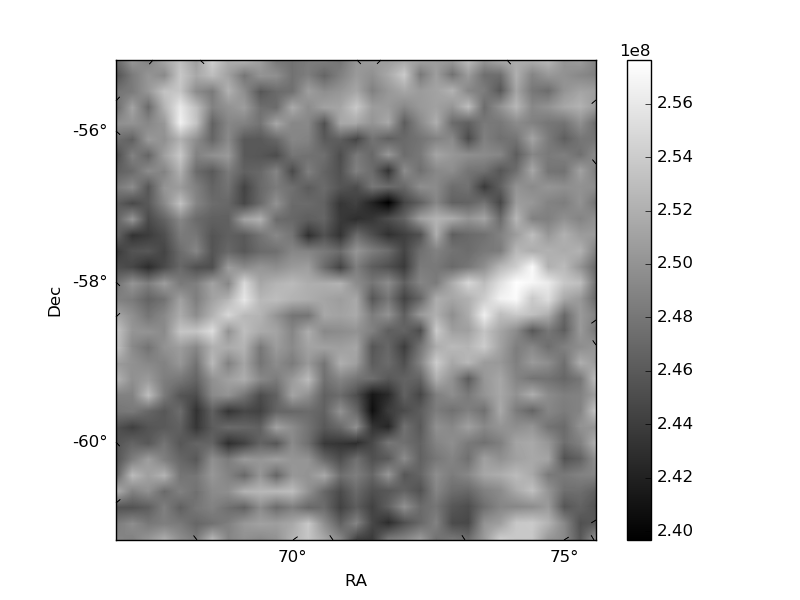
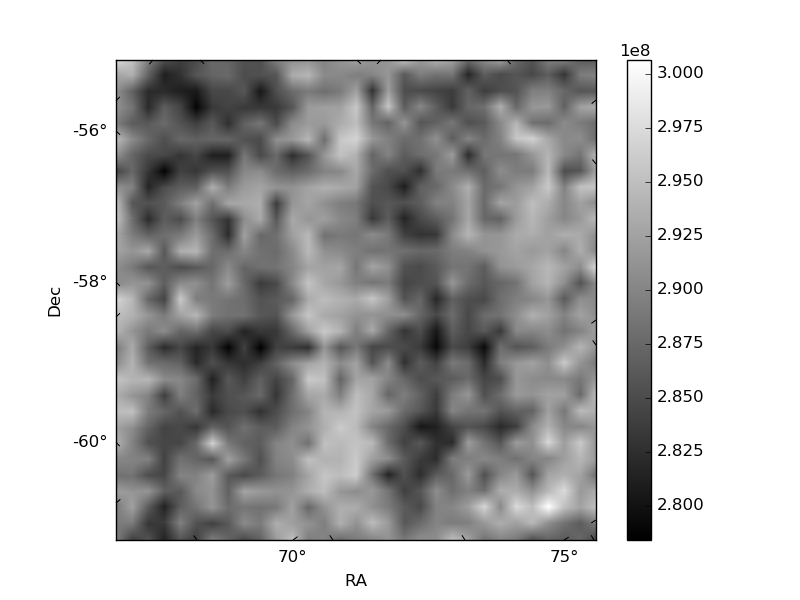
Histogram calculated using DETX and DETY for each event in the final _common_clean file
| Quadrant A | 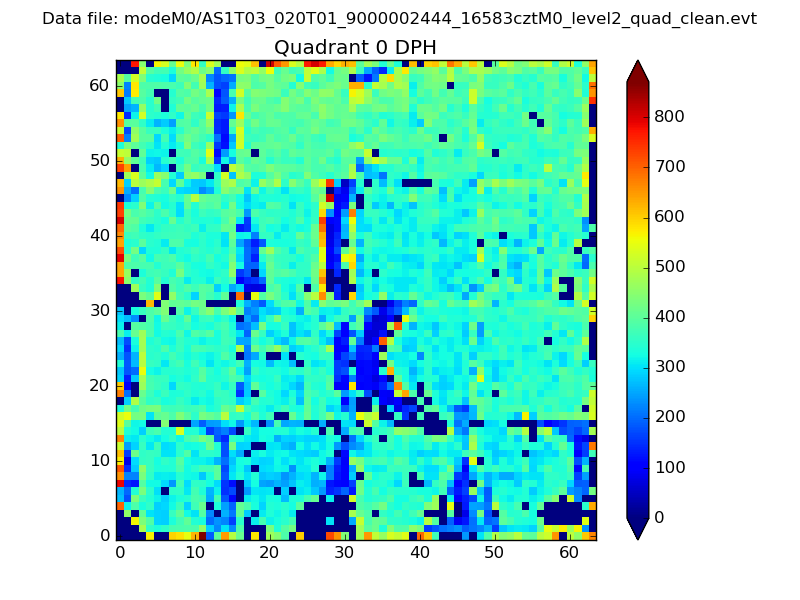 |
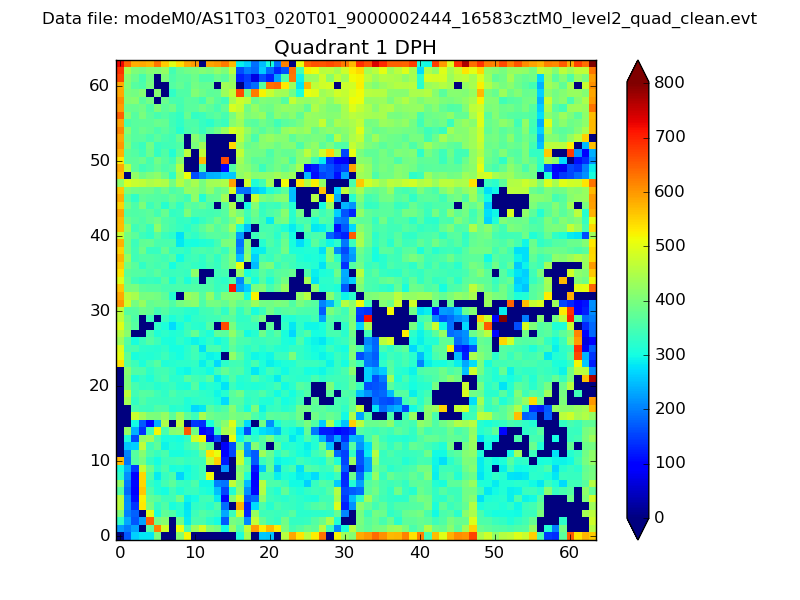 |
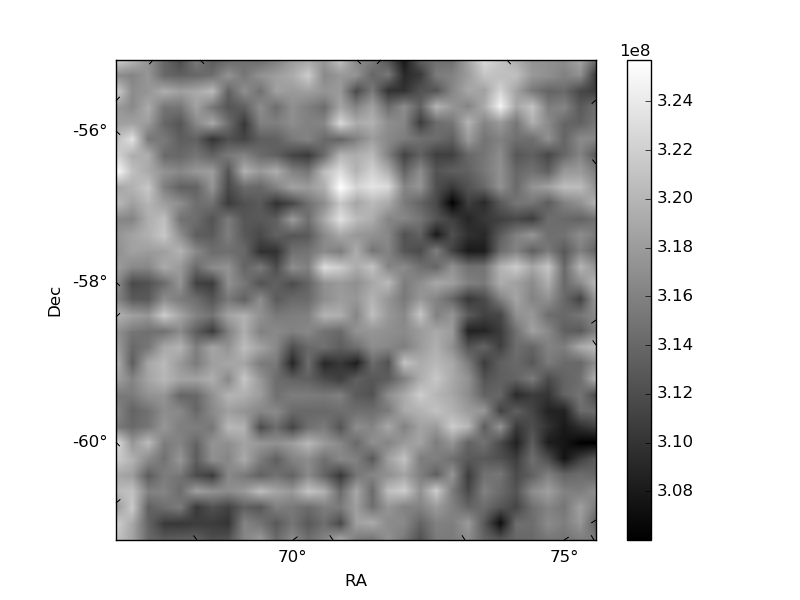
Quadrant B |
|---|---|---|---|
| Quadrant D | 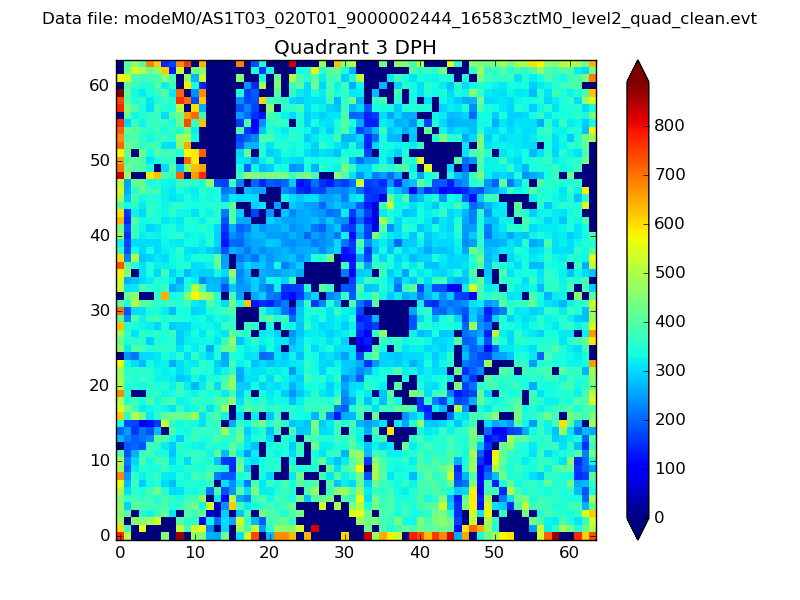 |
 |
Quadrant C |
| Plot type | Count rate plots | Images |
|---|---|---|
| Comparison with Poisson distribution Blue bars denote a histogram of data divided into 1 sec bins. Red curve is a Poisson curve with rate = median count rate of data. |
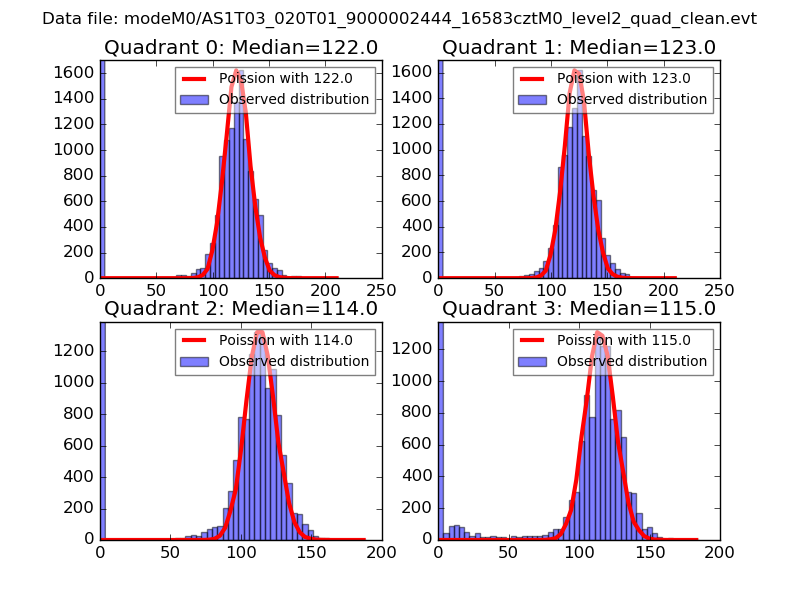 |
 |
| Quadrant-wise count rates Data is divided into 100 sec bins |
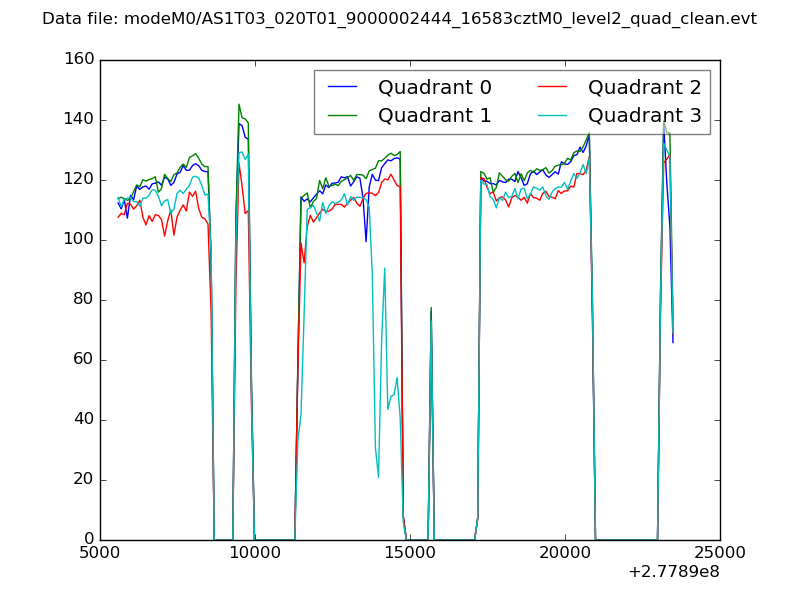 |
|
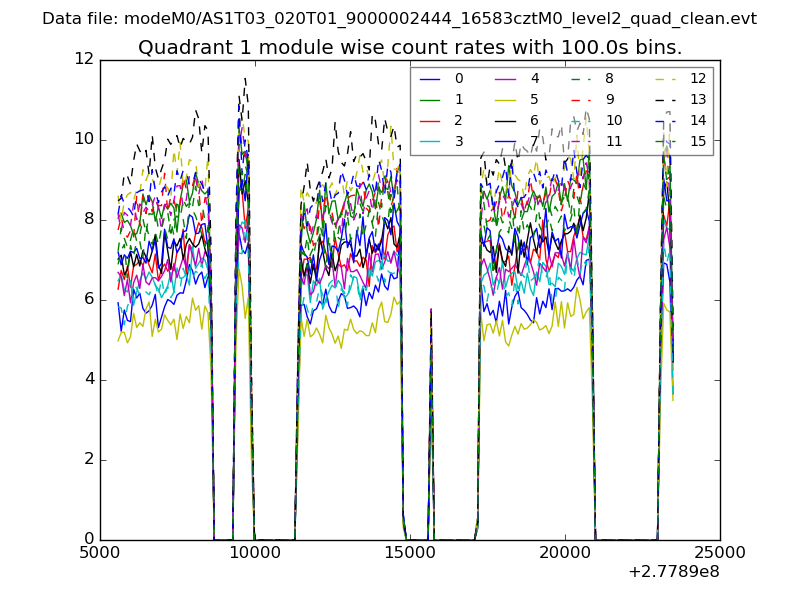
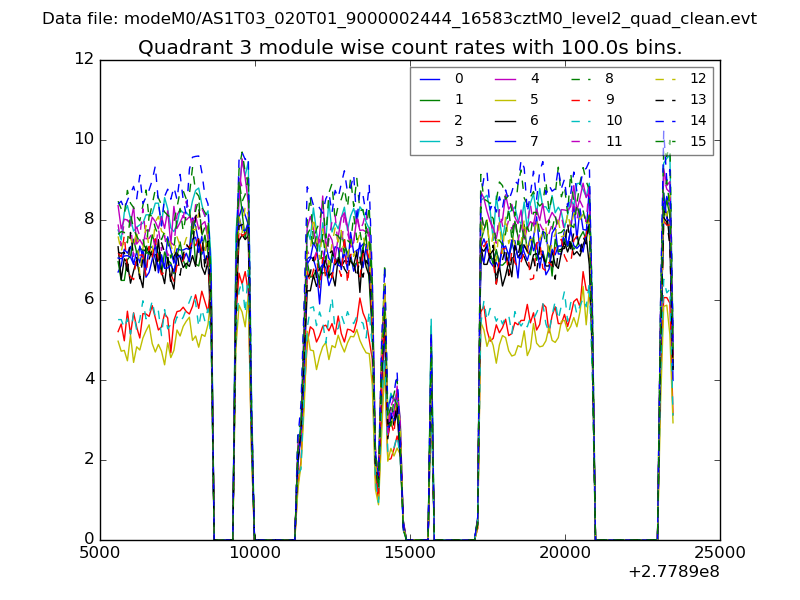
| Module-wise count rates for Quadrant A Data is divided into 100 sec bins |
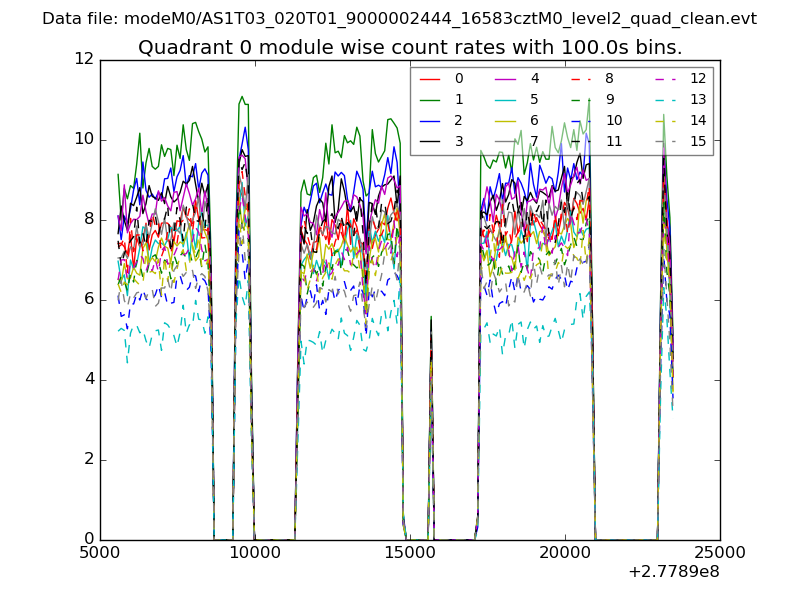 |
 |
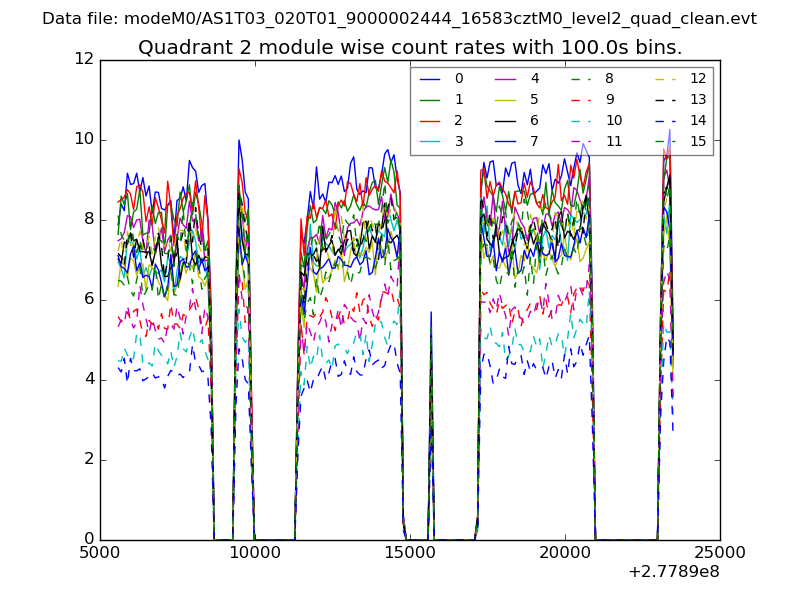
| Module-wise count rates for Quadrant B Data is divided into 100 sec bins |
 |
 |
| Module-wise count rates for Quadrant C Data is divided into 100 sec bins |
 |
 |
| Module-wise count rates for Quadrant D Data is divided into 100 sec bins |
 |
 |
| Parameter | Plot |
|---|---|
| CZT HV Monitor | 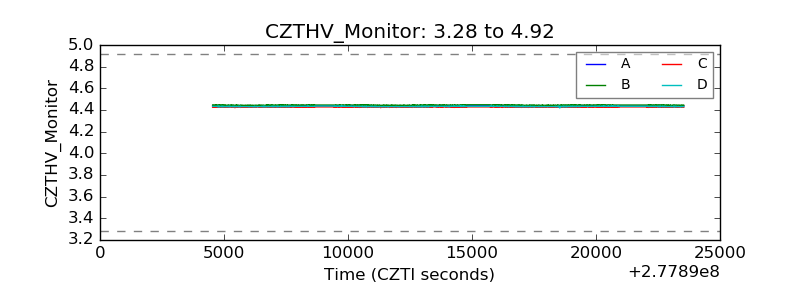 |
| D_VDD | 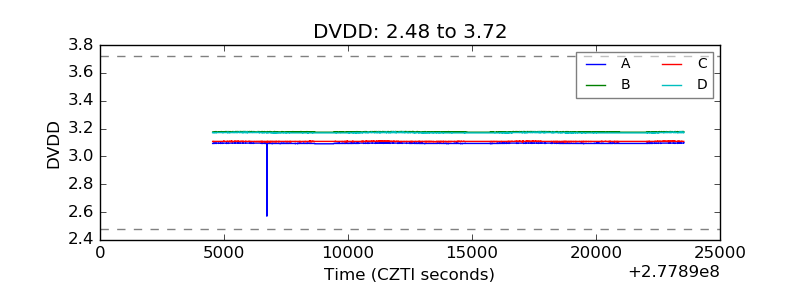 |
| Temperature 1 | 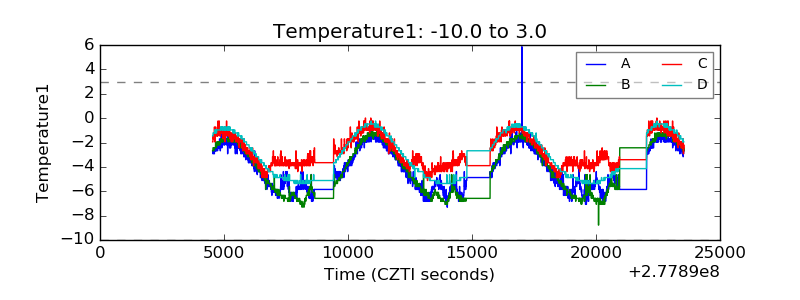 |
| Veto HV Monitor | 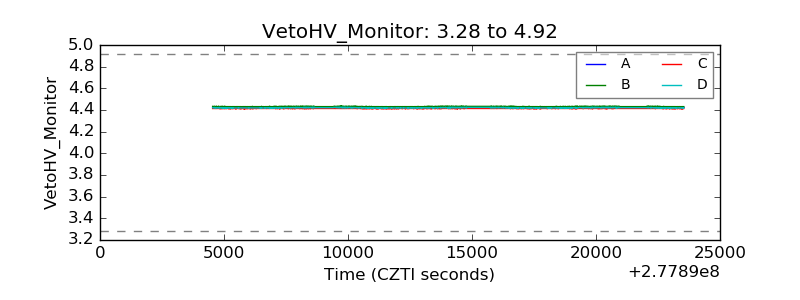 |
| Veto LLD | 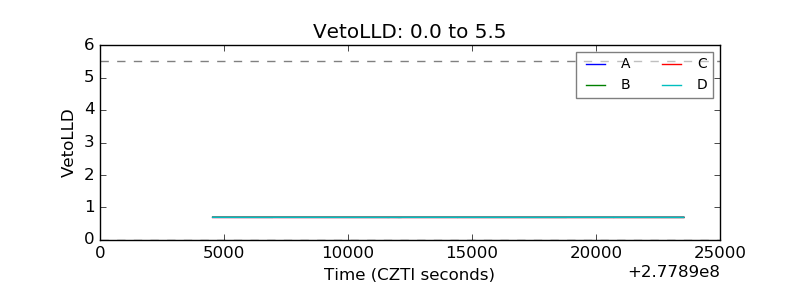 |
| Alpha Counter | 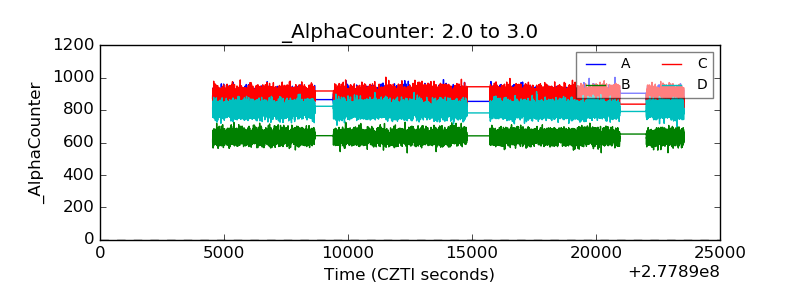 |
| _CPM_Rate | 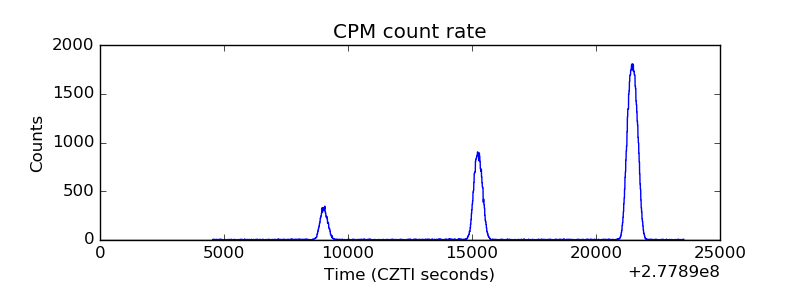 |
| CZT Counter | 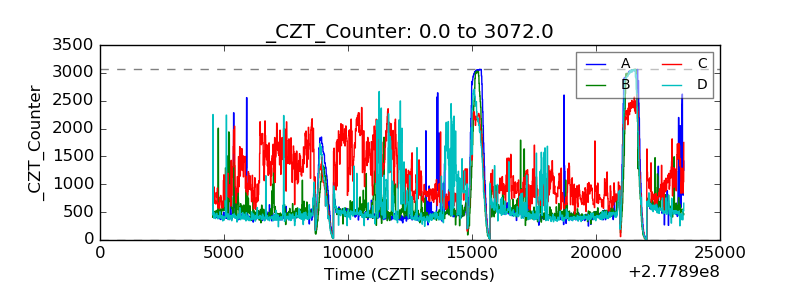 |
| +2.5 Volts monitor |  |
| +5 Volts monitor | 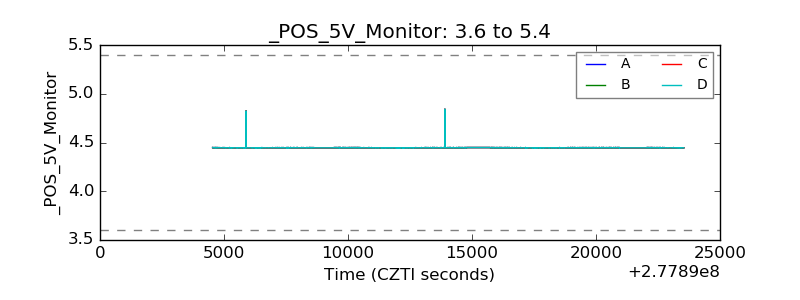 |
| _ROLL_ROT | 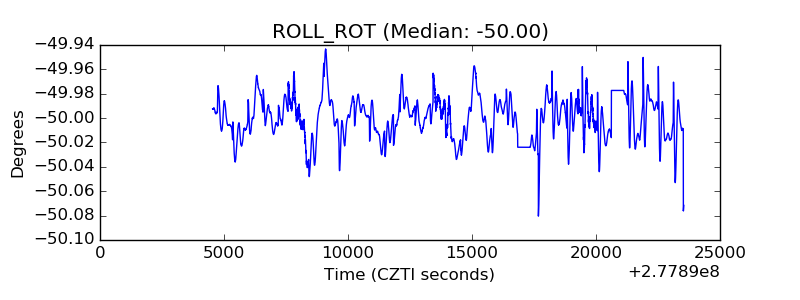 |
| _Roll_DEC | 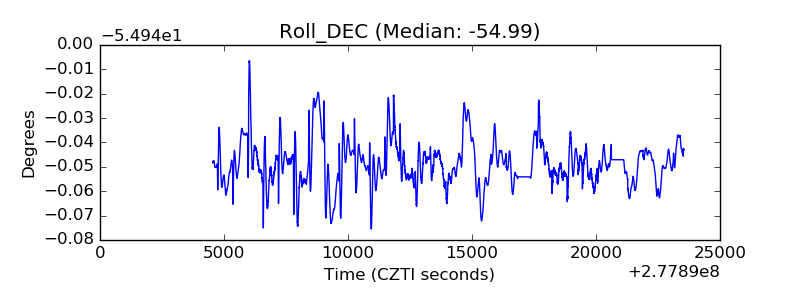 |
| _Roll_RA | 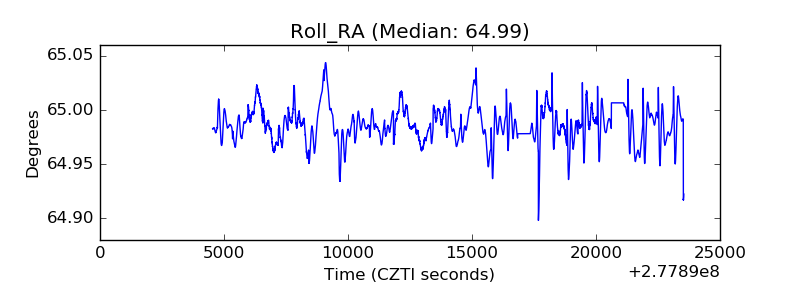 |
| Veto Counter | 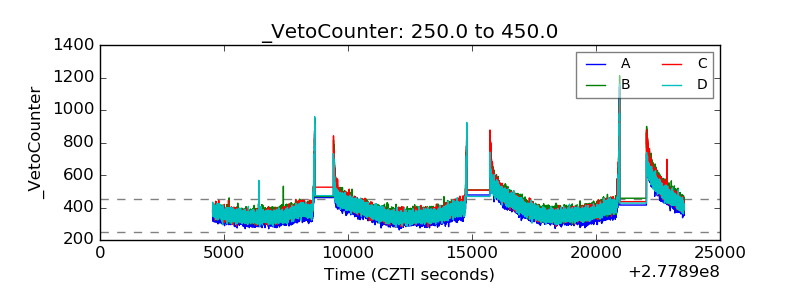 |