| Param | Original file | Final file |
|---|---|---|
| Filename | modeM0/AS1T03_020T01_9000002444_16585cztM0_level2.evt | modeM0/AS1T03_020T01_9000002444_16585cztM0_level2_quad_clean.evt |
| Size (bytes) | 234,276,480 | 25,476,480 |
| Size | 223.4 MB | 24.3 MB |
| Events in quadrant A | 1,906,595 | 147,614 |
| Events in quadrant B | 1,395,327 | 158,695 |
| Events in quadrant C | 2,424,648 | 147,248 |
| Events in quadrant D | 1,211,280 | 151,820 |
| Mode M9 | |||
|---|---|---|---|
| Quadrant | BADHDUFLAG | Total packets | Discarded packets |
| A | 0 | 8 | 0 |
| B | 0 | 8 | 0 |
| C | 0 | 8 | 0 |
| D | 0 | 9 | 0 |
| Mode SS | |||
|---|---|---|---|
| Quadrant | BADHDUFLAG | Total packets | Discarded packets |
| A | 0 | 46 | 0 |
| B | 0 | 46 | 0 |
| C | 0 | 46 | 0 |
| D | 0 | 46 | 0 |
| Mode M0 | |||
|---|---|---|---|
| Quadrant | BADHDUFLAG | Total packets | Discarded packets |
| A | 0 | 7209 | 1 |
| B | 0 | 5703 | 1 |
| C | 0 | 8864 | 1 |
| D | 0 | 5133 | 1 |
| Quadrant | Total seconds | Saturated seconds | Saturation percentage |
|---|---|---|---|
| A | 2291 | 202 | 8.817110% |
| B | 2291 | 35 | 1.527717% |
| C | 2291 | 124 | 5.412484% |
| D | 2291 | 6 | 0.261894% |
Noise dominated data is calculated using 1-second bins in cleaned event files. If a bin has >2000 counts, and if more than 50% of those come from <1% of pixels, then it is considered to be noise-dominated and hence unusable.
| Quadrant | # 1 sec bins | Bins with >0 counts | Bins with >2000 counts | High rate bins dominated by noise | Noise dominated (total time) | Noise dominated (detector-on time) | Marked lightcurve |
|---|---|---|---|---|---|---|---|
| A | 2292 | 2292 | 99 | 99 | 4.32% | 4.32% | 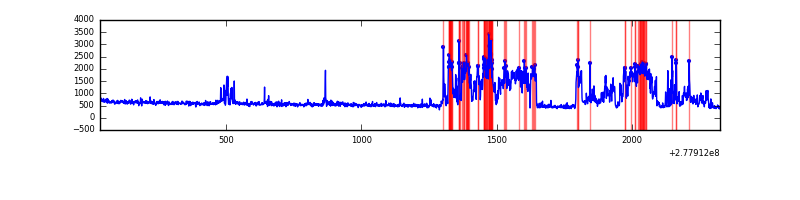 |
| B | 2292 | 2292 | 17 | 17 | 0.74% | 0.74% | 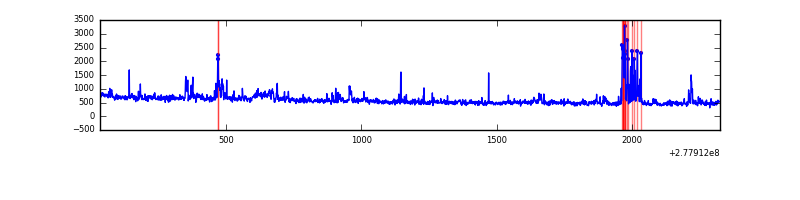 |
| C | 2292 | 2292 | 12 | 12 | 0.52% | 0.52% | 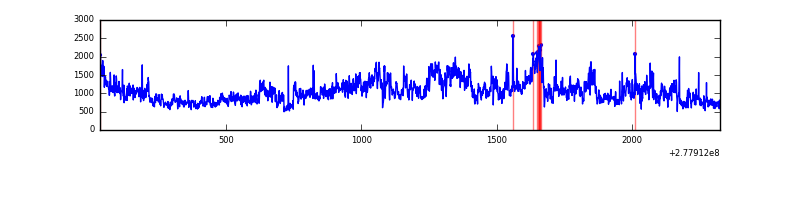 |
| D | 2292 | 2292 | 2 | 2 | 0.09% | 0.09% | 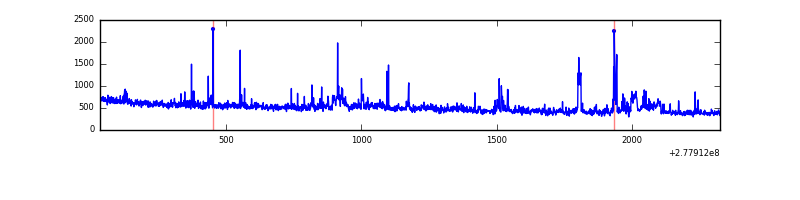 |
Top three noisy pixels from each quadrant. If the there are fewer than three noisy pixels in the level2.evt file, extra rows are filled as -1
| Pixel properties | Quadrant properties | ||||||
|---|---|---|---|---|---|---|---|
| Quadrant | DetID | PixID | Counts | Sigma | Mean | Median | Sigma |
| A | 15 | 174 | 657583 | 10767.03 | 295 | 289 | 61.0 |
| A | 9 | 143 | 111253 | 1817.68 | 295 | 289 | 61.0 |
| A | 11 | 29 | 2992 | 44.28 | 295 | 289 | 61.0 |
| B | 15 | 35 | 44640 | 780.3 | 297 | 291 | 56.8 |
| B | 0 | 229 | 42261 | 738.45 | 297 | 291 | 56.8 |
| B | 0 | 197 | 36266 | 632.97 | 297 | 291 | 56.8 |
| C | 3 | 233 | 1292734 | 19841.13 | 276 | 278 | 65.1 |
| C | 14 | 238 | 43257 | 659.79 | 276 | 278 | 65.1 |
| C | 7 | 247 | 7864 | 116.46 | 276 | 278 | 65.1 |
| D | 5 | 222 | 44110 | 615.4 | 288 | 279 | 71.2 |
| D | 10 | 70 | 37055 | 516.35 | 288 | 279 | 71.2 |
| D | 7 | 38 | 22485 | 311.78 | 288 | 279 | 71.2 |
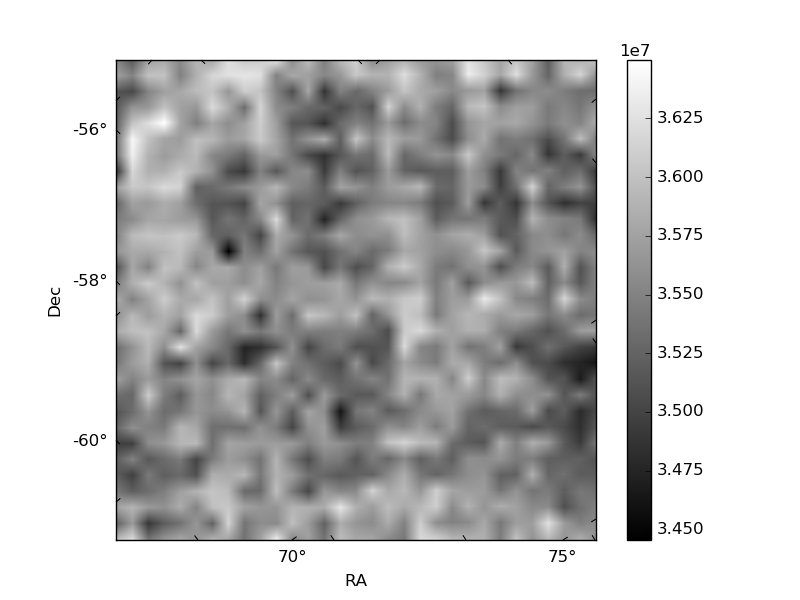
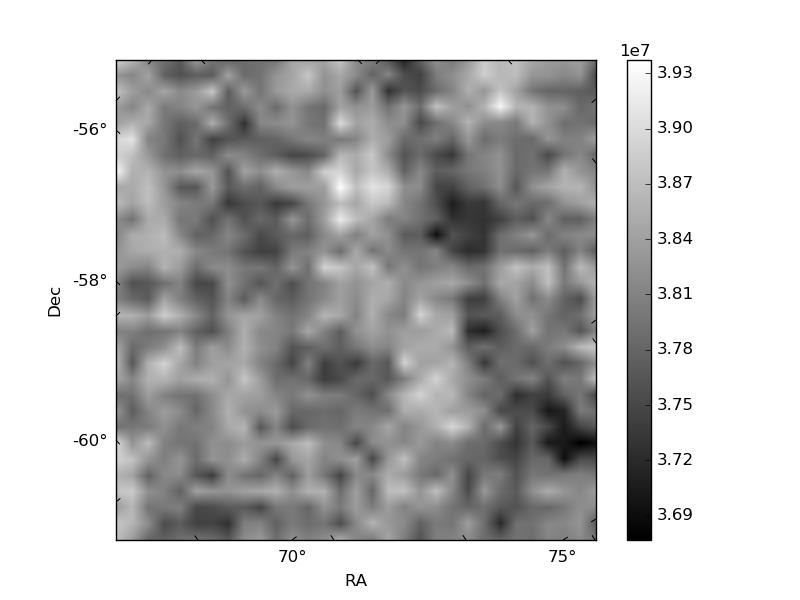
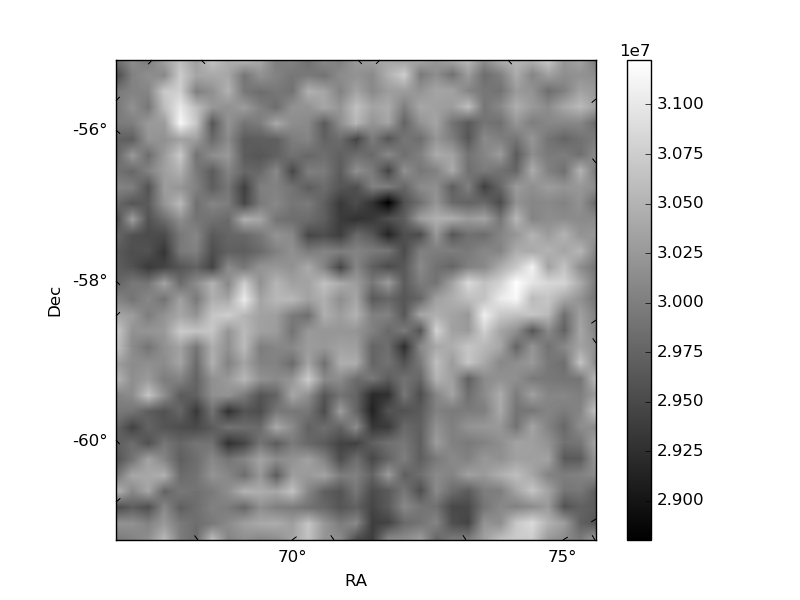
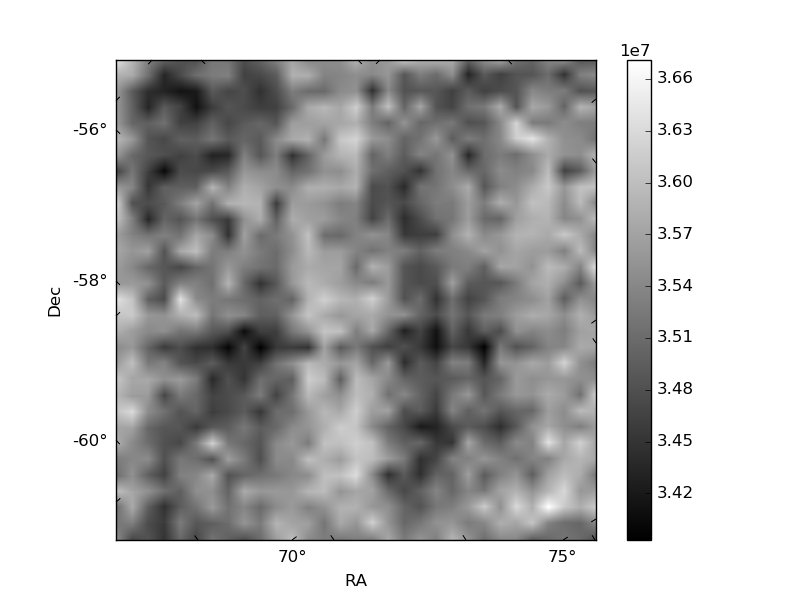
Histogram calculated using DETX and DETY for each event in the final _common_clean file
| Quadrant A | 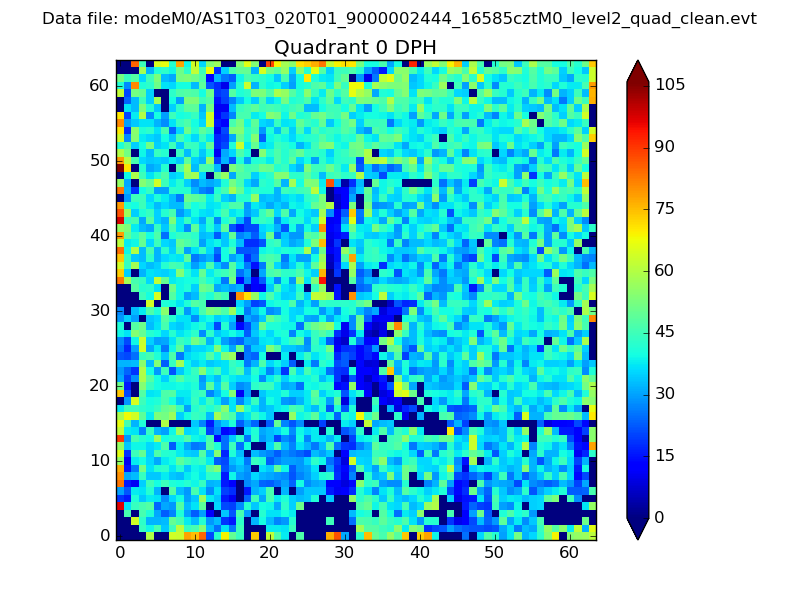 |
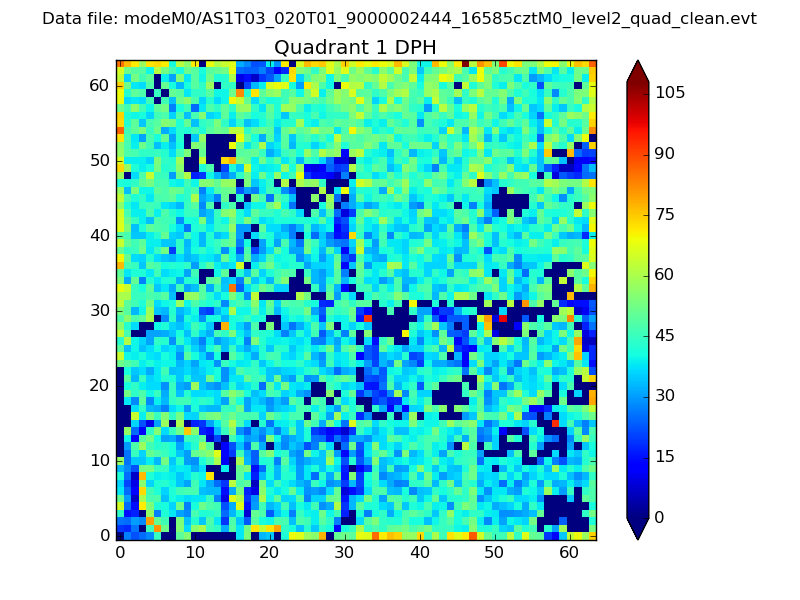 |
Quadrant B |
|---|---|---|---|
| Quadrant D | 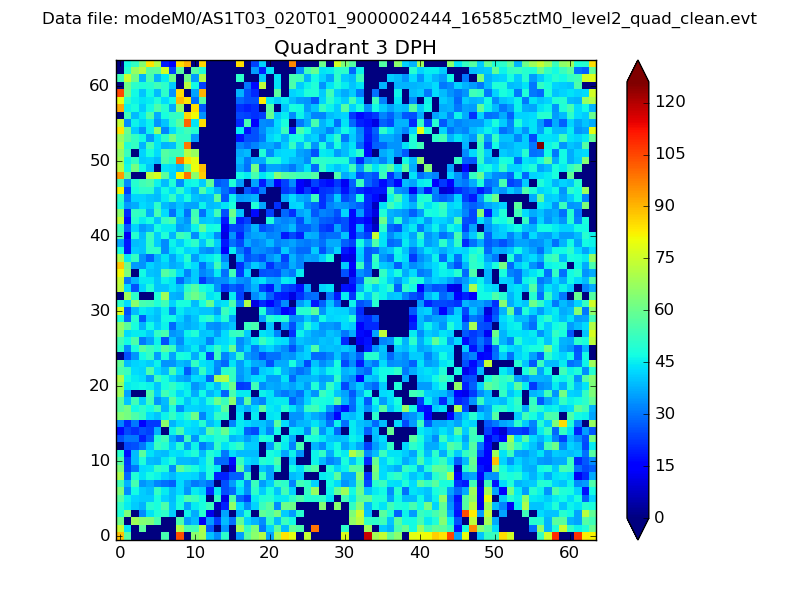 |
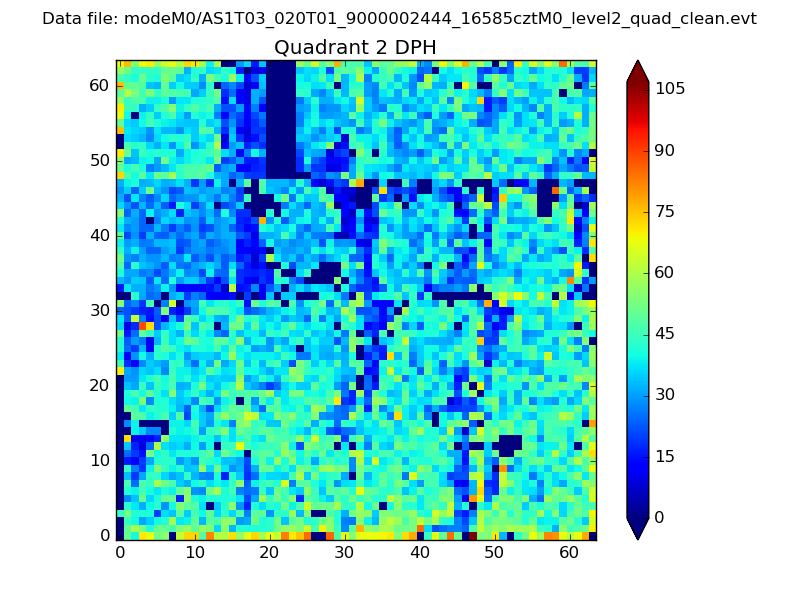 |
Quadrant C |
| Plot type | Count rate plots | Images |
|---|---|---|
| Comparison with Poisson distribution Blue bars denote a histogram of data divided into 1 sec bins. Red curve is a Poisson curve with rate = median count rate of data. |
 |
 |
| Quadrant-wise count rates Data is divided into 100 sec bins |
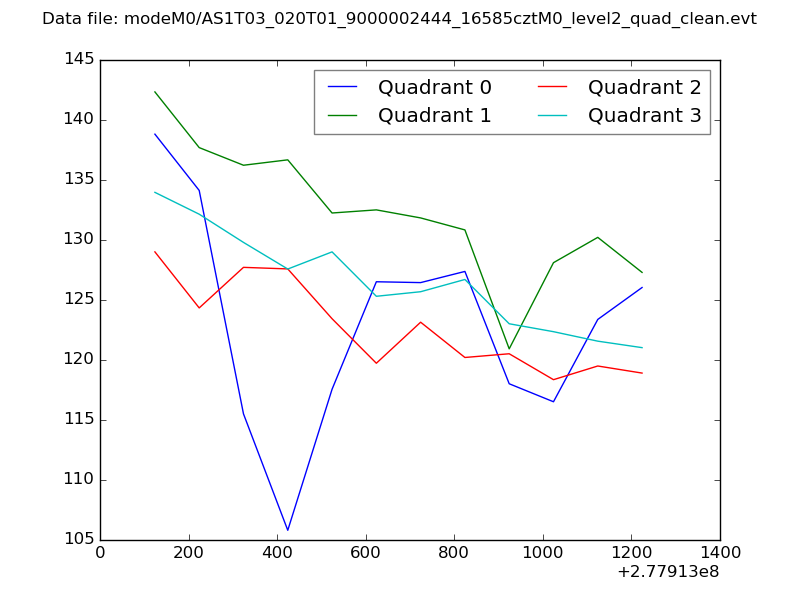 |
|
| Module-wise count rates for Quadrant A Data is divided into 100 sec bins |
 |
 |
| Module-wise count rates for Quadrant B Data is divided into 100 sec bins |
 |
 |
| Module-wise count rates for Quadrant C Data is divided into 100 sec bins |
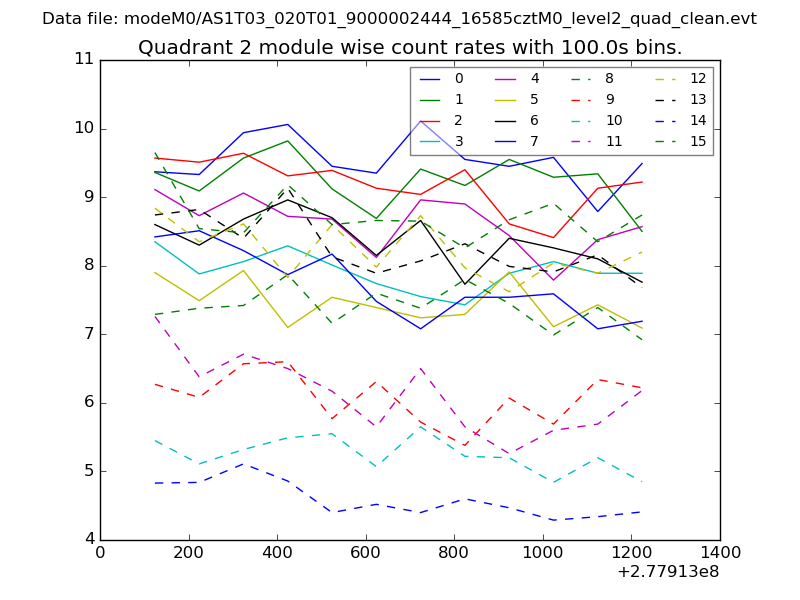 |
 |
| Module-wise count rates for Quadrant D Data is divided into 100 sec bins |
 |
 |
| Parameter | Plot |
|---|---|
| CZT HV Monitor | 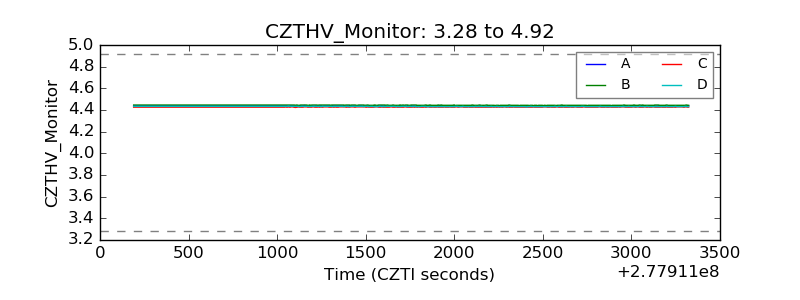 |
| D_VDD | 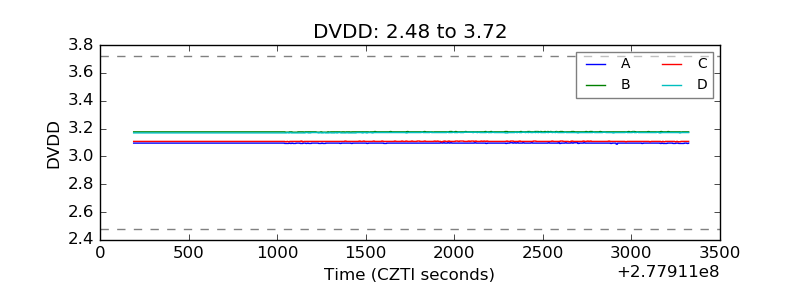 |
| Temperature 1 | 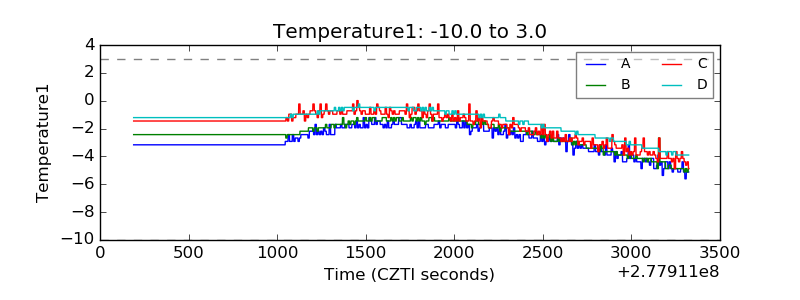 |
| Veto HV Monitor |  |
| Veto LLD | 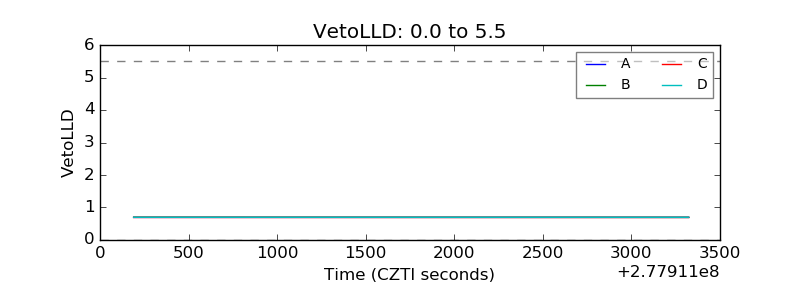 |
| Alpha Counter | 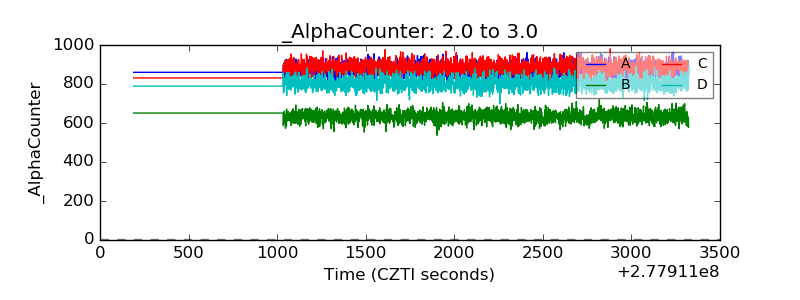 |
| _CPM_Rate | 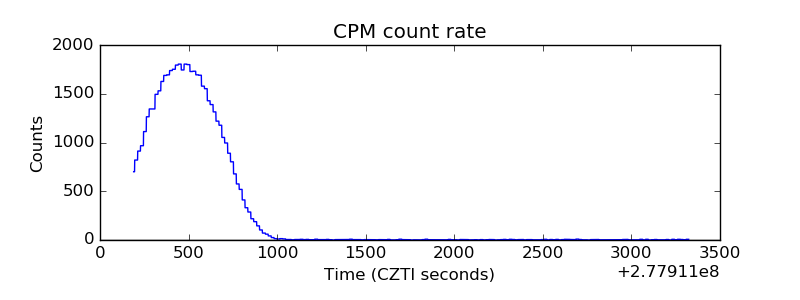 |
| CZT Counter |  |
| +2.5 Volts monitor | 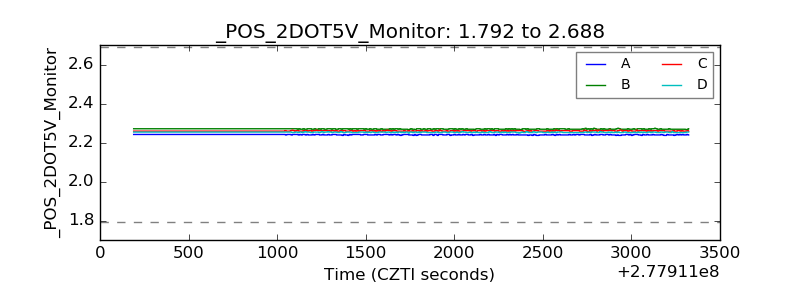 |
| +5 Volts monitor |  |
| _ROLL_ROT | 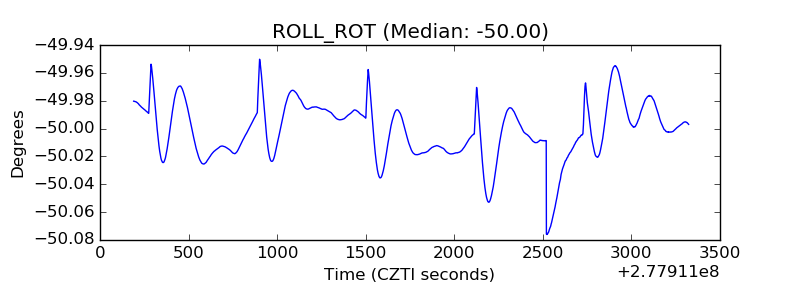 |
| _Roll_DEC | 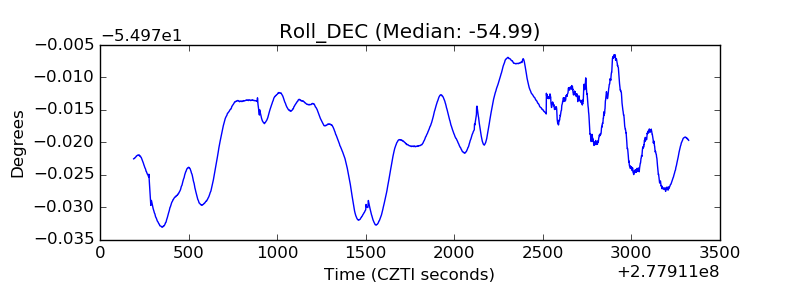 |
| _Roll_RA |  |
| Veto Counter |  |