| Param | Original file | Final file |
|---|---|---|
| Filename | modeM0/AS1C04_001T01_9000002446cztM0_level2.fits | modeM0/AS1C04_001T01_9000002446cztM0_level2_quad_clean.evt |
| Size (bytes) | 495,480,960 | 659,543,040 |
| Size | 472.5 MB | 629.0 MB |
| Events in quadrant A | 3,009,504 | 4,278,346 |
| Events in quadrant B | 2,894,430 | 4,259,703 |
| Events in quadrant C | 2,976,970 | 4,117,763 |
| Events in quadrant D | 2,540,232 | 3,737,417 |
| Mode M9 | |||
|---|---|---|---|
| Quadrant | BADHDUFLAG | Total packets | Discarded packets |
| A | 0 | 84 | 0 |
| B | 0 | 84 | 0 |
| C | 0 | 84 | 0 |
| D | 0 | 84 | 0 |
| Mode SS | |||
|---|---|---|---|
| Quadrant | BADHDUFLAG | Total packets | Discarded packets |
| A | 0 | 1060 | 0 |
| B | 0 | 1060 | 0 |
| C | 0 | 1060 | 0 |
| D | 0 | 1060 | 0 |
| Mode M0 | |||
|---|---|---|---|
| Quadrant | BADHDUFLAG | Total packets | Discarded packets |
| A | 0 | 113631 | 0 |
| B | 0 | 118386 | 0 |
| C | 0 | 120881 | 0 |
| D | 0 | 121105 | 0 |
| Quadrant | Total seconds | Saturated seconds | Saturation percentage |
|---|---|---|---|
| A | 52231 | 831 | 1.591009% |
| B | 52231 | 917 | 1.755662% |
| C | 52231 | 858 | 1.642703% |
| D | 52231 | 2191 | 4.194827% |
Noise dominated data is calculated using 1-second bins in cleaned event files. If a bin has >2000 counts, and if more than 50% of those come from <1% of pixels, then it is considered to be noise-dominated and hence unusable.
| Quadrant | # 1 sec bins | Bins with >0 counts | Bins with >2000 counts | High rate bins dominated by noise | Noise dominated (total time) | Noise dominated (detector-on time) | Marked lightcurve |
|---|---|---|---|---|---|---|---|
| A | 60583 | 52228 | 0 | 0 | 0.00% | 0.00% |  |
| B | 60583 | 52232 | 0 | 0 | 0.00% | 0.00% |  |
| C | 60583 | 52232 | 0 | 0 | 0.00% | 0.00% |  |
| D | 60583 | 51885 | 0 | 0 | 0.00% | 0.00% |  |
Top three noisy pixels from each quadrant. If the there are fewer than three noisy pixels in the level2.evt file, extra rows are filled as -1
| Pixel properties | Quadrant properties | ||||||
|---|---|---|---|---|---|---|---|
| Quadrant | DetID | PixID | Counts | Sigma | Mean | Median | Sigma |
| A | 0 | 29 | 2866 | 11.07 | 782 | 737 | 192.3 |
| A | 7 | 110 | 2484 | 9.08 | 782 | 737 | 192.3 |
| A | 9 | 19 | 2373 | 8.51 | 782 | 737 | 192.3 |
| B | 2 | 9 | 2351 | 10.86 | 767 | 735 | 148.9 |
| B | 2 | 8 | 2008 | 8.55 | 767 | 735 | 148.9 |
| B | 3 | 17 | 1905 | 7.86 | 767 | 735 | 148.9 |
| C | 2 | 191 | 2107 | 6.72 | 787 | 737 | 203.8 |
| C | 12 | 241 | 2078 | 6.58 | 787 | 737 | 203.8 |
| C | 9 | 233 | 1969 | 6.05 | 787 | 737 | 203.8 |
| D | 3 | 14 | 1875 | 6.29 | 724 | 660 | 193.0 |
| D | 6 | 231 | 1837 | 6.1 | 724 | 660 | 193.0 |
| D | 10 | 189 | 1801 | 5.91 | 724 | 660 | 193.0 |
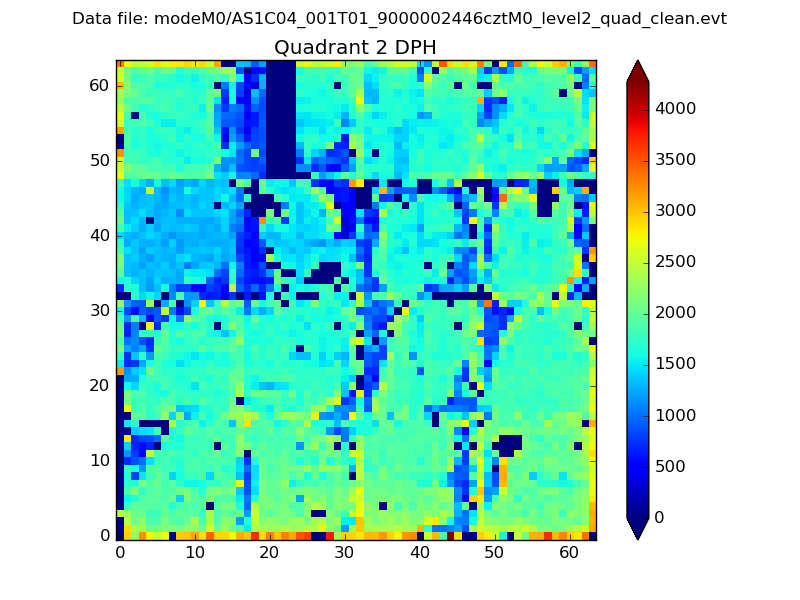
Histogram calculated using DETX and DETY for each event in the final _common_clean file
| Quadrant A |  |
 |
Quadrant B |
|---|---|---|---|
| Quadrant D |  |
 |
Quadrant C |
| Plot type | Count rate plots | Images |
|---|---|---|
| Comparison with Poisson distribution Blue bars denote a histogram of data divided into 1 sec bins. Red curve is a Poisson curve with rate = median count rate of data. |
 |
 |
| Quadrant-wise count rates Data is divided into 100 sec bins |
 |
|
| Module-wise count rates for Quadrant A Data is divided into 100 sec bins |
 |
 |
| Module-wise count rates for Quadrant B Data is divided into 100 sec bins |
 |
 |
| Module-wise count rates for Quadrant C Data is divided into 100 sec bins |
 |
 |
| Module-wise count rates for Quadrant D Data is divided into 100 sec bins |
 |
 |
| Parameter | Plot |
|---|---|
| CZT HV Monitor |  |
| D_VDD |  |
| Temperature 1 |  |
| Veto HV Monitor |  |
| Veto LLD |  |
| Alpha Counter |  |
| _CPM_Rate |  |
| CZT Counter |  |
| +2.5 Volts monitor |  |
| +5 Volts monitor |  |
| _ROLL_ROT |  |
| _Roll_DEC |  |
| _Roll_RA | 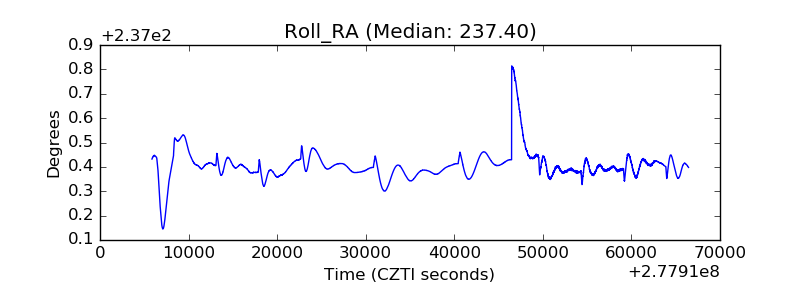 |
| Veto Counter |  |