| Param | Original file | Final file |
|---|---|---|
| Filename | modeM0/AS1C04_001T01_9000002446_16585cztM0_level2.evt | modeM0/AS1C04_001T01_9000002446_16585cztM0_level2_quad_clean.evt |
| Size (bytes) | 290,448,000 | 52,764,480 |
| Size | 277.0 MB | 50.3 MB |
| Events in quadrant A | 2,523,148 | 385,719 |
| Events in quadrant B | 1,750,657 | 401,124 |
| Events in quadrant C | 1,741,985 | 385,018 |
| Events in quadrant D | 2,592,149 | 228,901 |
| Mode M9 | |||
|---|---|---|---|
| Quadrant | BADHDUFLAG | Total packets | Discarded packets |
| A | 0 | 11 | 0 |
| B | 0 | 11 | 0 |
| C | 0 | 11 | 0 |
| D | 0 | 11 | 0 |
| Mode SS | |||
|---|---|---|---|
| Quadrant | BADHDUFLAG | Total packets | Discarded packets |
| A | 0 | 58 | 0 |
| B | 0 | 58 | 0 |
| C | 0 | 58 | 0 |
| D | 0 | 58 | 0 |
| Mode M0 | |||
|---|---|---|---|
| Quadrant | BADHDUFLAG | Total packets | Discarded packets |
| A | 0 | 9300 | 2 |
| B | 0 | 7036 | 1 |
| C | 0 | 7214 | 1 |
| D | 0 | 9630 | 1 |
| Quadrant | Total seconds | Saturated seconds | Saturation percentage |
|---|---|---|---|
| A | 2731 | 318 | 11.644086% |
| B | 2731 | 58 | 2.123764% |
| C | 2731 | 73 | 2.673014% |
| D | 2731 | 1485 | 54.375687% |
Noise dominated data is calculated using 1-second bins in cleaned event files. If a bin has >2000 counts, and if more than 50% of those come from <1% of pixels, then it is considered to be noise-dominated and hence unusable.
| Quadrant | # 1 sec bins | Bins with >0 counts | Bins with >2000 counts | High rate bins dominated by noise | Noise dominated (total time) | Noise dominated (detector-on time) | Marked lightcurve |
|---|---|---|---|---|---|---|---|
| A | 3927 | 2733 | 152 | 152 | 3.87% | 5.56% | 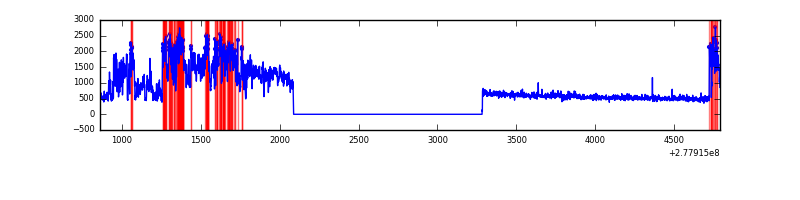 |
| B | 3927 | 2733 | 11 | 11 | 0.28% | 0.40% | 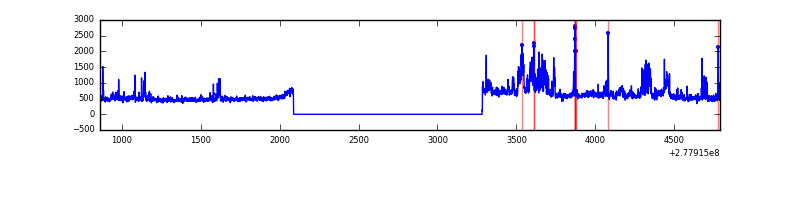 |
| C | 3927 | 2733 | 2 | 2 | 0.05% | 0.07% | 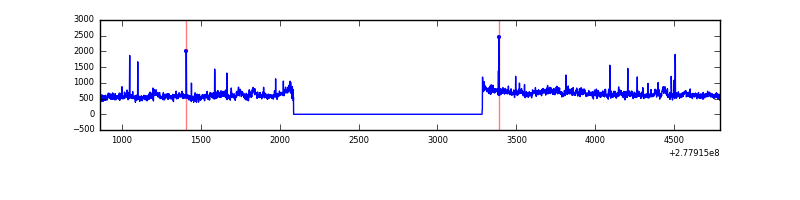 |
| D | 3927 | 2728 | 188 | 188 | 4.79% | 6.89% | 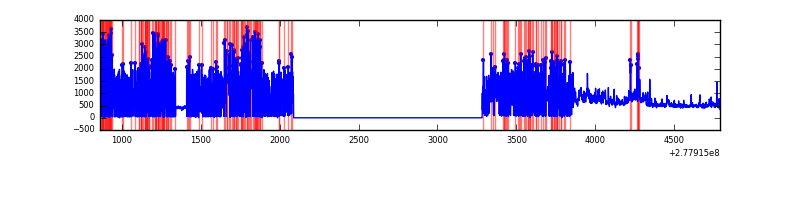 |
Top three noisy pixels from each quadrant. If the there are fewer than three noisy pixels in the level2.evt file, extra rows are filled as -1
| Pixel properties | Quadrant properties | ||||||
|---|---|---|---|---|---|---|---|
| Quadrant | DetID | PixID | Counts | Sigma | Mean | Median | Sigma |
| A | 15 | 174 | 1165280 | 16401.92 | 351 | 345 | 71.0 |
| A | 15 | 223 | 4779 | 62.43 | 351 | 345 | 71.0 |
| A | 0 | 226 | 3160 | 39.63 | 351 | 345 | 71.0 |
| B | 15 | 35 | 98244 | 1442.88 | 357 | 349 | 67.8 |
| B | 0 | 85 | 94189 | 1383.11 | 357 | 349 | 67.8 |
| B | 0 | 229 | 66785 | 979.2 | 357 | 349 | 67.8 |
| C | 3 | 233 | 340066 | 4215.71 | 344 | 346 | 80.6 |
| C | 14 | 238 | 53450 | 658.99 | 344 | 346 | 80.6 |
| C | 7 | 247 | 6106 | 71.48 | 344 | 346 | 80.6 |
| D | 1 | 52 | 1535790 | 28887.18 | 214 | 207 | 53.2 |
| D | 5 | 222 | 197826 | 3717.58 | 214 | 207 | 53.2 |
| D | 10 | 70 | 35551 | 664.89 | 214 | 207 | 53.2 |
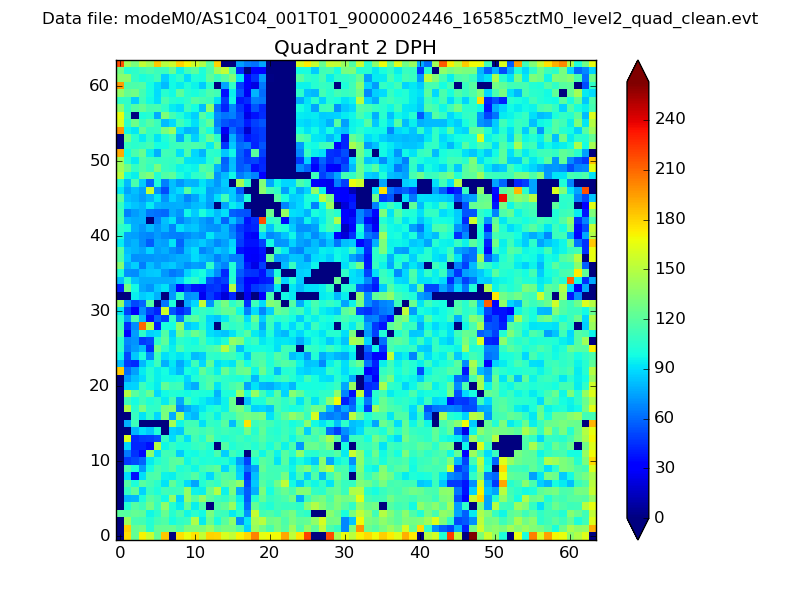
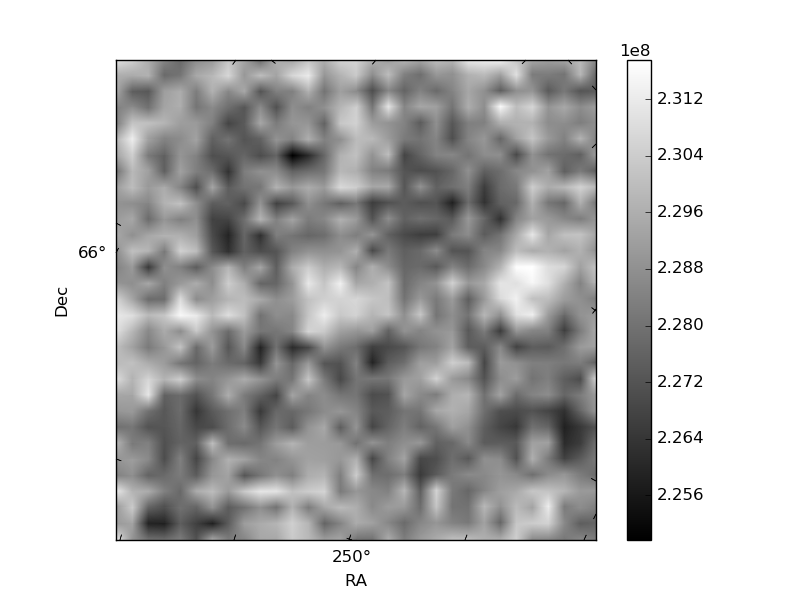
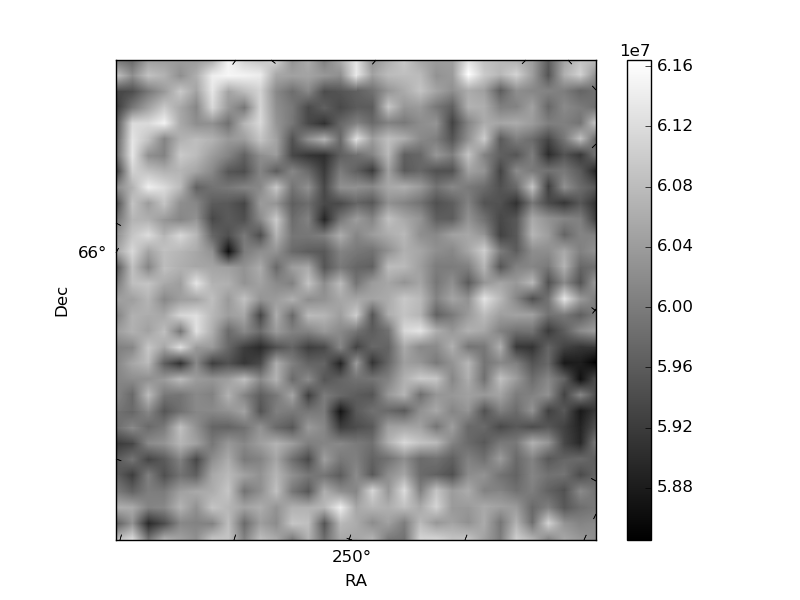
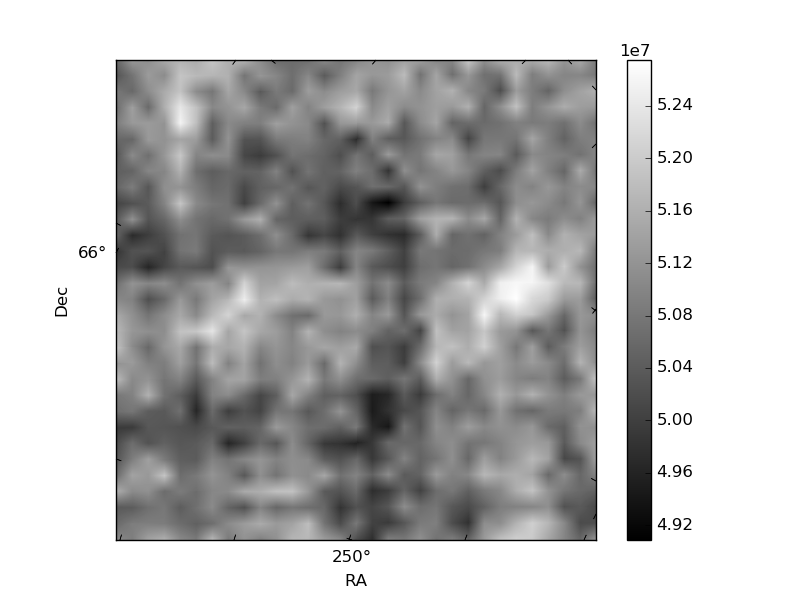
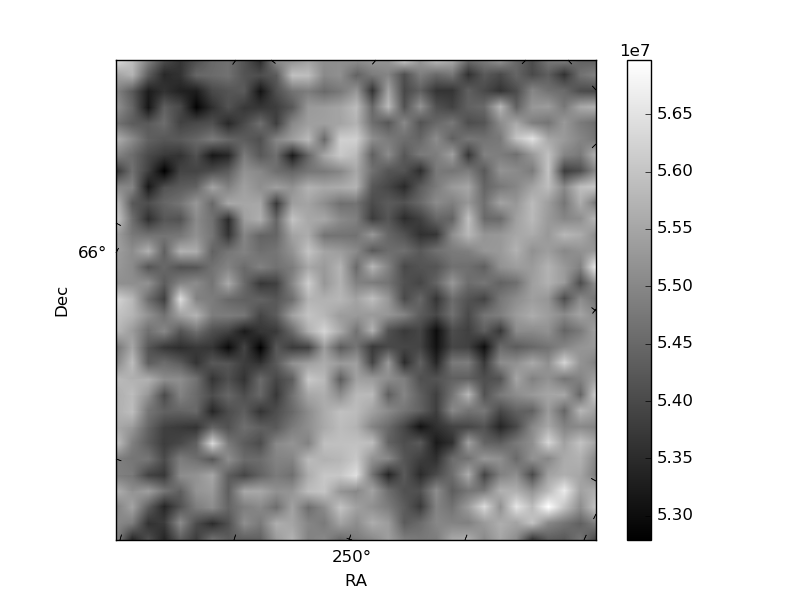
Histogram calculated using DETX and DETY for each event in the final _common_clean file
| Quadrant A | 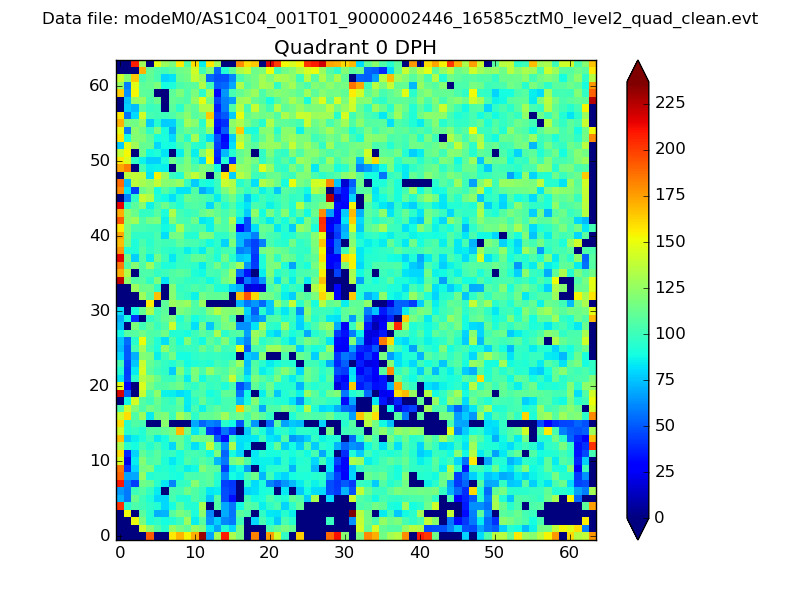 |
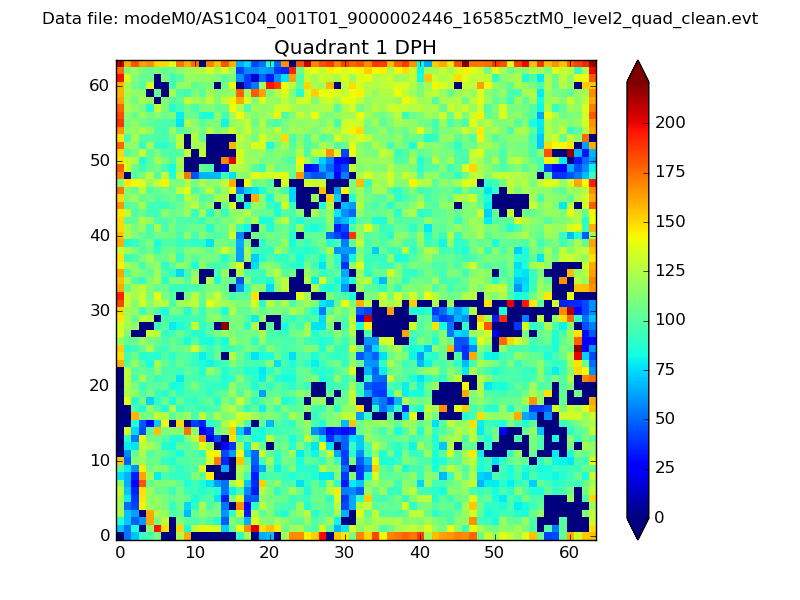 |
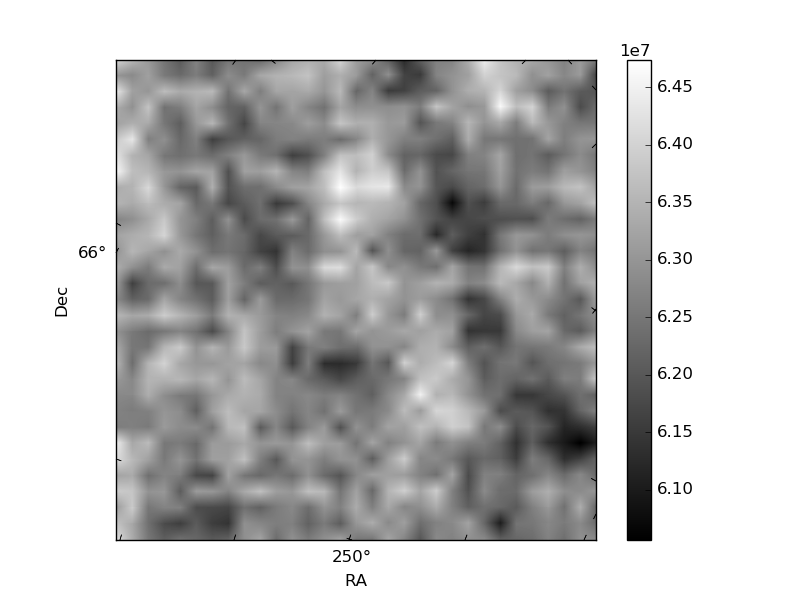
Quadrant B |
|---|---|---|---|
| Quadrant D | 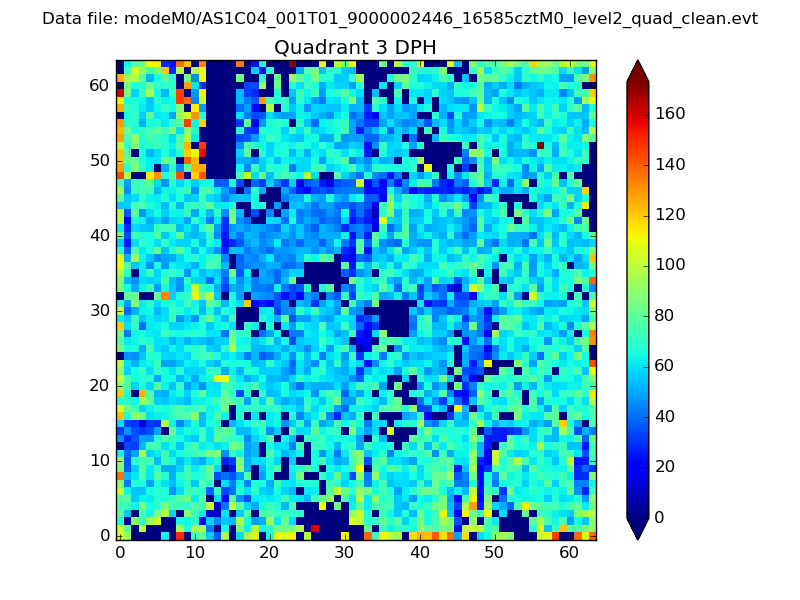 |
 |
Quadrant C |
| Plot type | Count rate plots | Images |
|---|---|---|
| Comparison with Poisson distribution Blue bars denote a histogram of data divided into 1 sec bins. Red curve is a Poisson curve with rate = median count rate of data. |
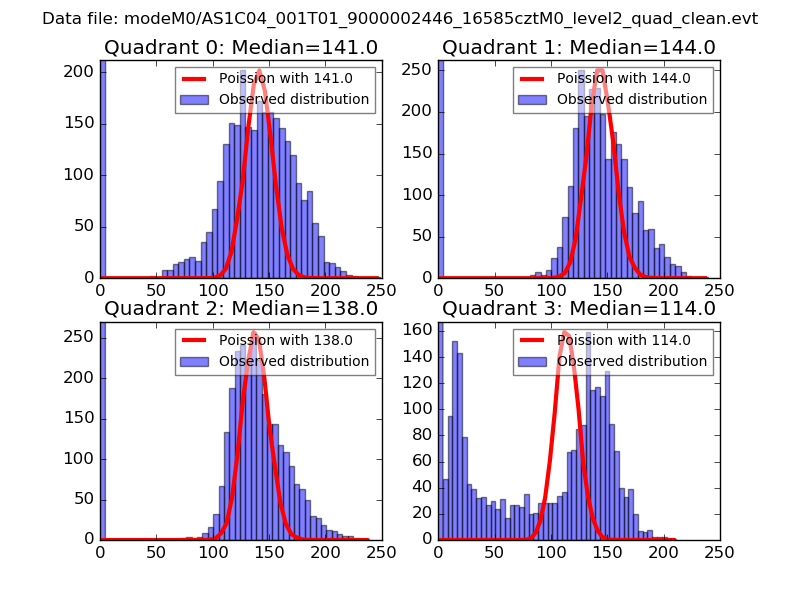 |
 |
| Quadrant-wise count rates Data is divided into 100 sec bins |
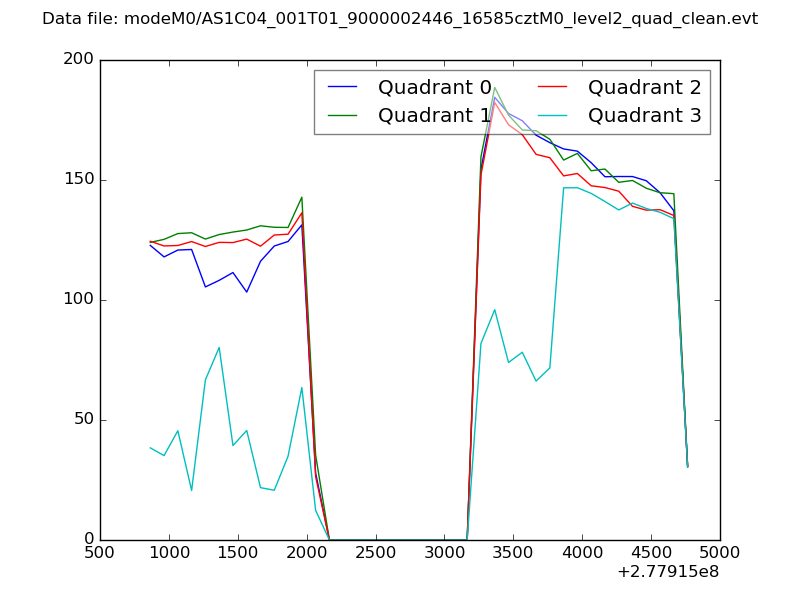 |
|
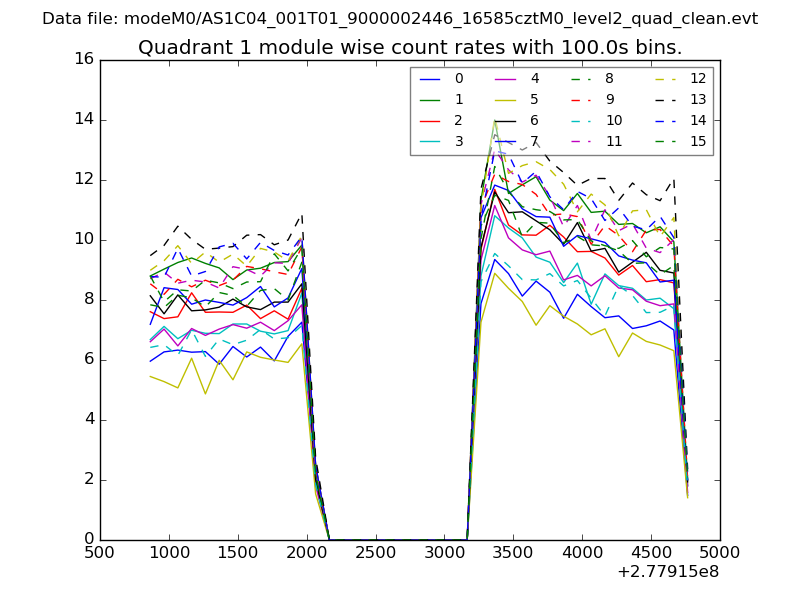
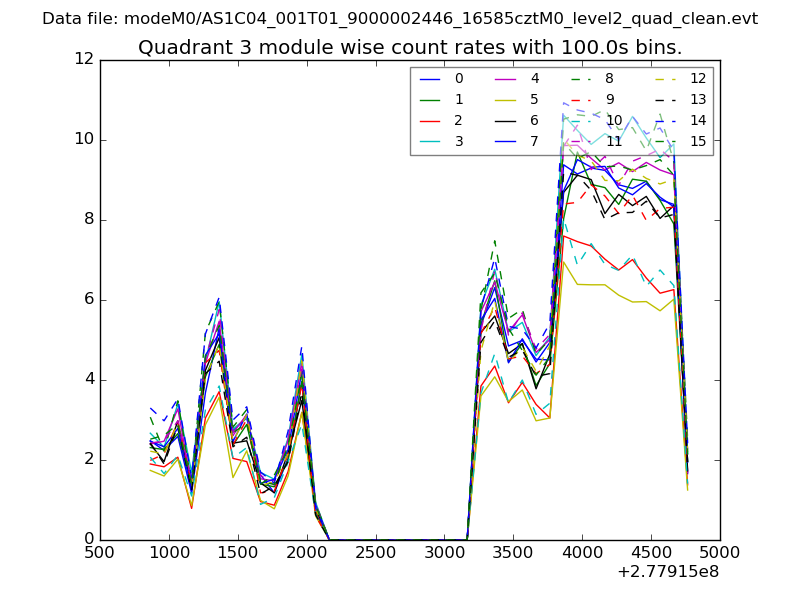
| Module-wise count rates for Quadrant A Data is divided into 100 sec bins |
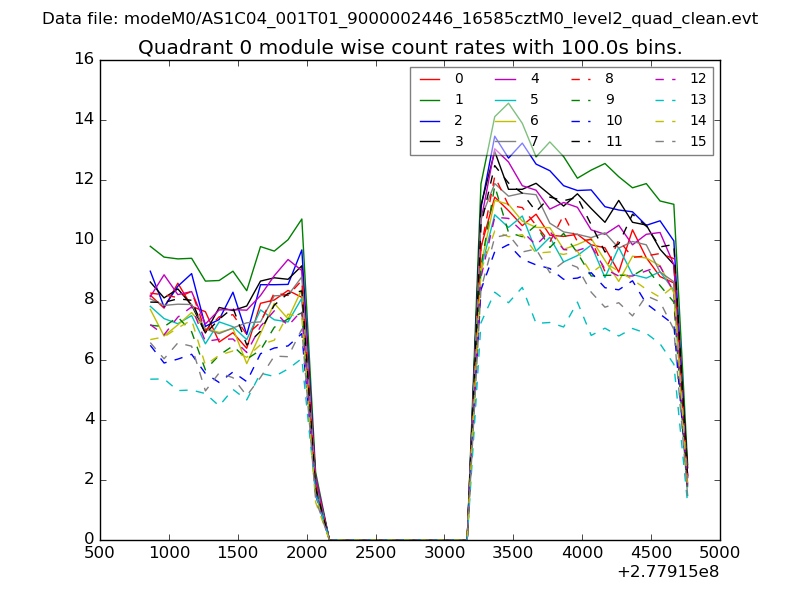 |
 |
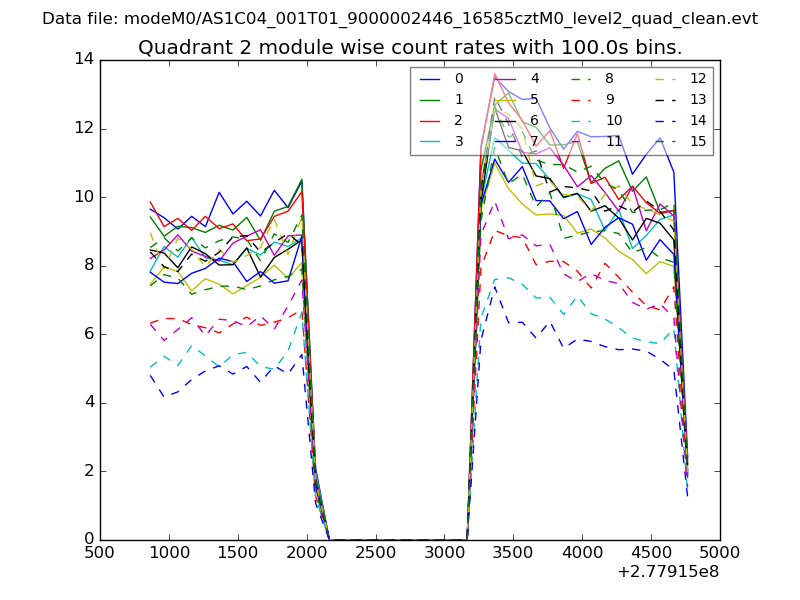
| Module-wise count rates for Quadrant B Data is divided into 100 sec bins |
 |
 |
| Module-wise count rates for Quadrant C Data is divided into 100 sec bins |
 |
 |
| Module-wise count rates for Quadrant D Data is divided into 100 sec bins |
 |
 |
| Parameter | Plot |
|---|---|
| CZT HV Monitor | 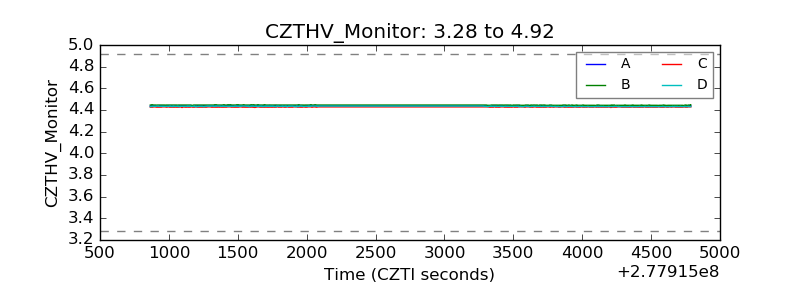 |
| D_VDD | 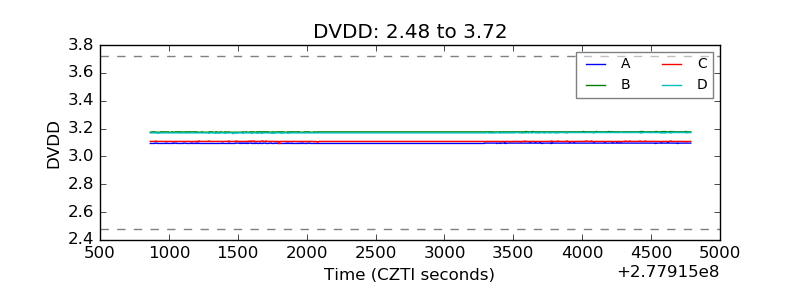 |
| Temperature 1 | 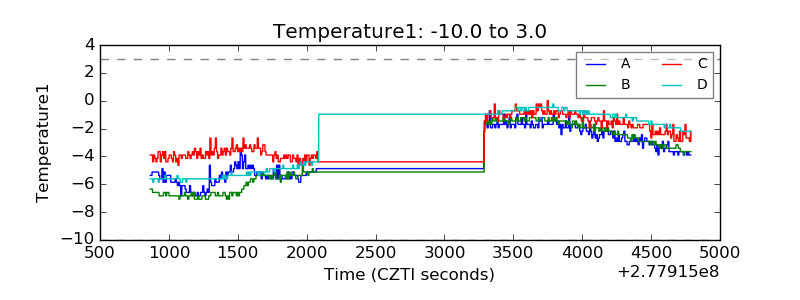 |
| Veto HV Monitor | 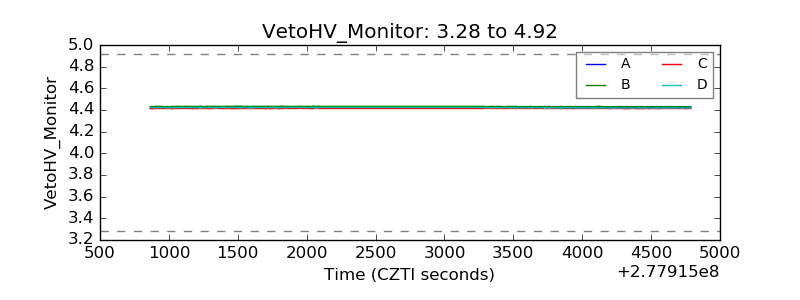 |
| Veto LLD | 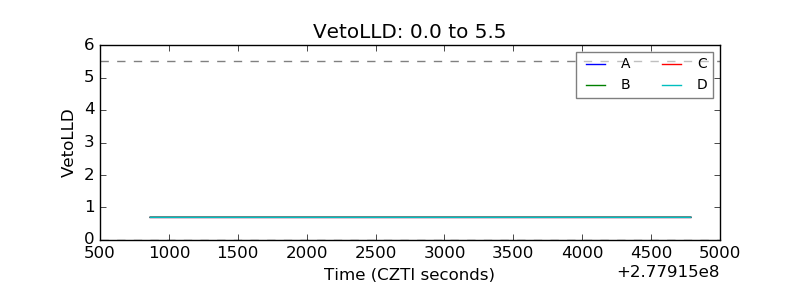 |
| Alpha Counter | 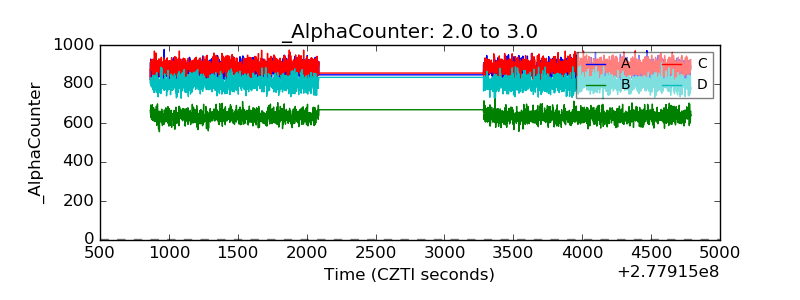 |
| _CPM_Rate | 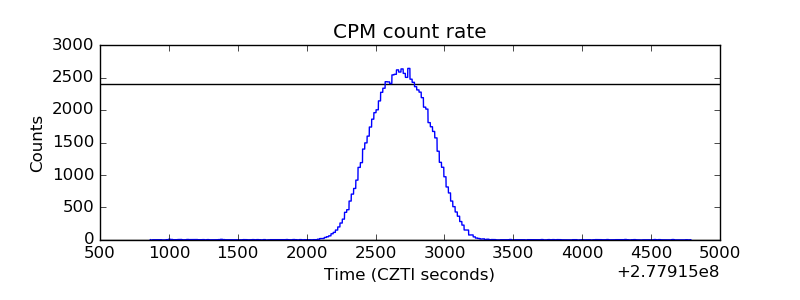 |
| CZT Counter | 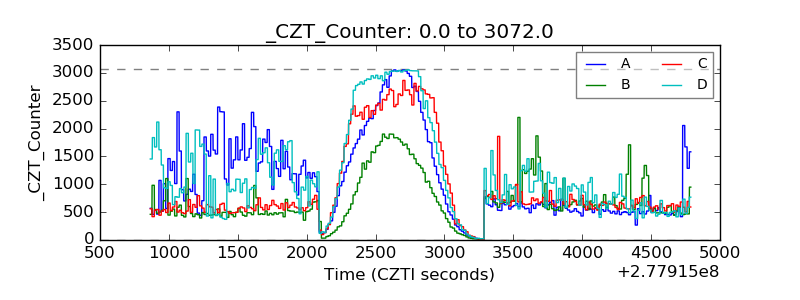 |
| +2.5 Volts monitor |  |
| +5 Volts monitor |  |
| _ROLL_ROT | 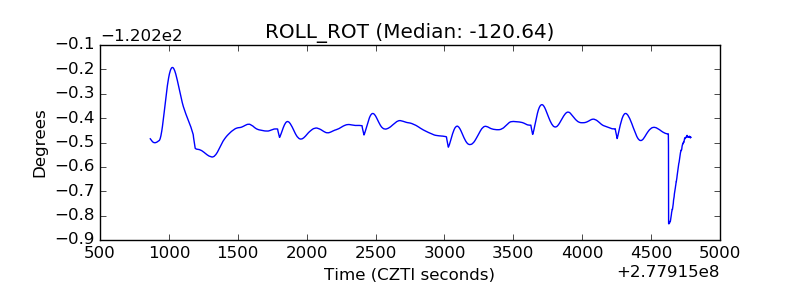 |
| _Roll_DEC | 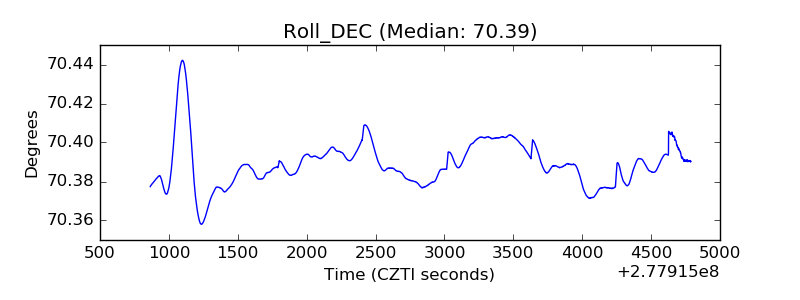 |
| _Roll_RA | 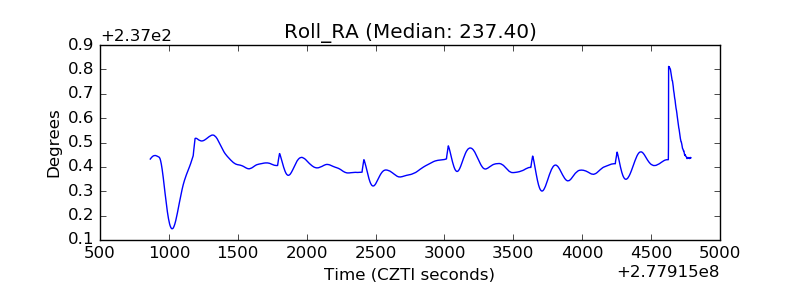 |
| Veto Counter | 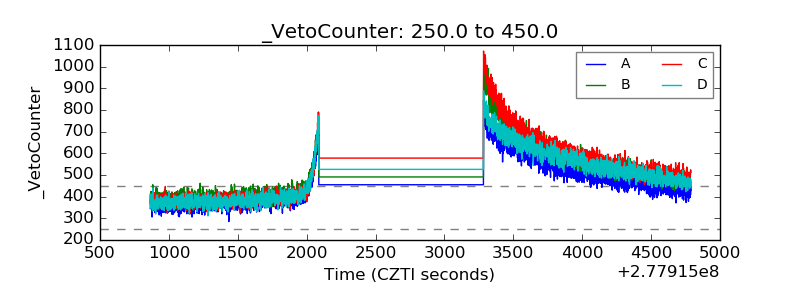 |