| Param | Original file | Final file |
|---|---|---|
| Filename | modeM0/AS1C04_001T01_9000002446_16586cztM0_level2.evt | modeM0/AS1C04_001T01_9000002446_16586cztM0_level2_quad_clean.evt |
| Size (bytes) | 510,543,360 | 132,085,440 |
| Size | 486.9 MB | 126.0 MB |
| Events in quadrant A | 3,528,990 | 916,275 |
| Events in quadrant B | 3,774,887 | 922,966 |
| Events in quadrant C | 4,013,159 | 894,607 |
| Events in quadrant D | 3,716,819 | 826,615 |
| Mode M9 | |||
|---|---|---|---|
| Quadrant | BADHDUFLAG | Total packets | Discarded packets |
| A | 0 | 13 | 0 |
| B | 0 | 13 | 0 |
| C | 0 | 13 | 0 |
| D | 0 | 14 | 0 |
| Mode SS | |||
|---|---|---|---|
| Quadrant | BADHDUFLAG | Total packets | Discarded packets |
| A | 0 | 128 | 0 |
| B | 0 | 128 | 0 |
| C | 0 | 128 | 0 |
| D | 0 | 128 | 0 |
| Mode M0 | |||
|---|---|---|---|
| Quadrant | BADHDUFLAG | Total packets | Discarded packets |
| A | 0 | 14695 | 3 |
| B | 0 | 15419 | 2 |
| C | 0 | 16444 | 2 |
| D | 0 | 15533 | 2 |
| Quadrant | Total seconds | Saturated seconds | Saturation percentage |
|---|---|---|---|
| A | 6306 | 93 | 1.474786% |
| B | 6306 | 98 | 1.554075% |
| C | 6306 | 125 | 1.982239% |
| D | 6306 | 510 | 8.087536% |
Noise dominated data is calculated using 1-second bins in cleaned event files. If a bin has >2000 counts, and if more than 50% of those come from <1% of pixels, then it is considered to be noise-dominated and hence unusable.
| Quadrant | # 1 sec bins | Bins with >0 counts | Bins with >2000 counts | High rate bins dominated by noise | Noise dominated (total time) | Noise dominated (detector-on time) | Marked lightcurve |
|---|---|---|---|---|---|---|---|
| A | 7597 | 6308 | 54 | 54 | 0.71% | 0.86% | 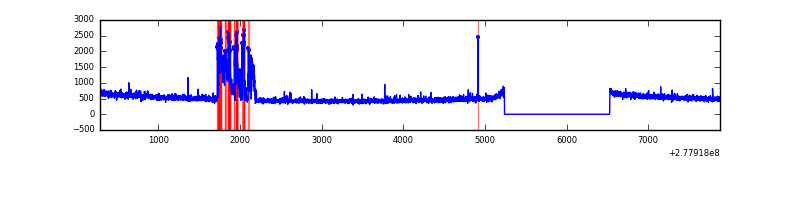 |
| B | 7597 | 6308 | 28 | 28 | 0.37% | 0.44% | 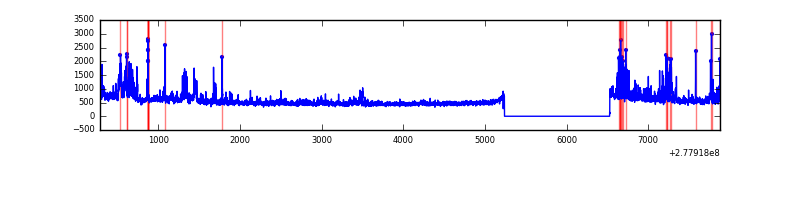 |
| C | 7597 | 6308 | 6 | 6 | 0.08% | 0.10% | 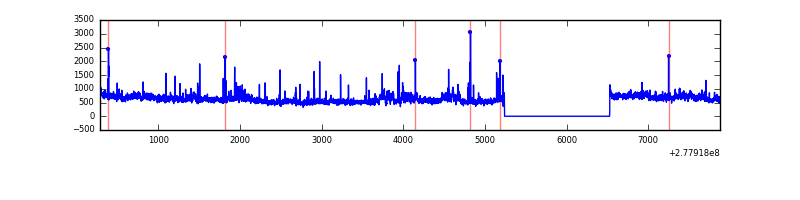 |
| D | 7597 | 6306 | 86 | 86 | 1.13% | 1.36% | 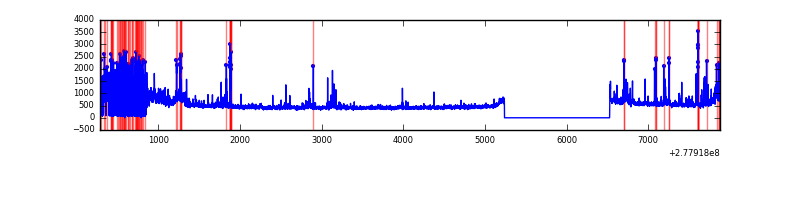 |
Top three noisy pixels from each quadrant. If the there are fewer than three noisy pixels in the level2.evt file, extra rows are filled as -1
| Pixel properties | Quadrant properties | ||||||
|---|---|---|---|---|---|---|---|
| Quadrant | DetID | PixID | Counts | Sigma | Mean | Median | Sigma |
| A | 15 | 174 | 439276 | 2805.88 | 795 | 781 | 156.3 |
| A | 15 | 223 | 18223 | 111.61 | 795 | 781 | 156.3 |
| A | 9 | 143 | 8267 | 47.9 | 795 | 781 | 156.3 |
| B | 15 | 35 | 296608 | 2033.93 | 797 | 780 | 145.4 |
| B | 0 | 229 | 100677 | 686.83 | 797 | 780 | 145.4 |
| B | 0 | 85 | 87939 | 599.25 | 797 | 780 | 145.4 |
| C | 3 | 233 | 795638 | 4430.34 | 780 | 785 | 179.4 |
| C | 14 | 238 | 123646 | 684.8 | 780 | 785 | 179.4 |
| C | 7 | 247 | 51963 | 285.26 | 780 | 785 | 179.4 |
| D | 1 | 52 | 463566 | 2582.57 | 742 | 721 | 179.2 |
| D | 5 | 222 | 305767 | 1702.09 | 742 | 721 | 179.2 |
| D | 10 | 70 | 82496 | 456.29 | 742 | 721 | 179.2 |
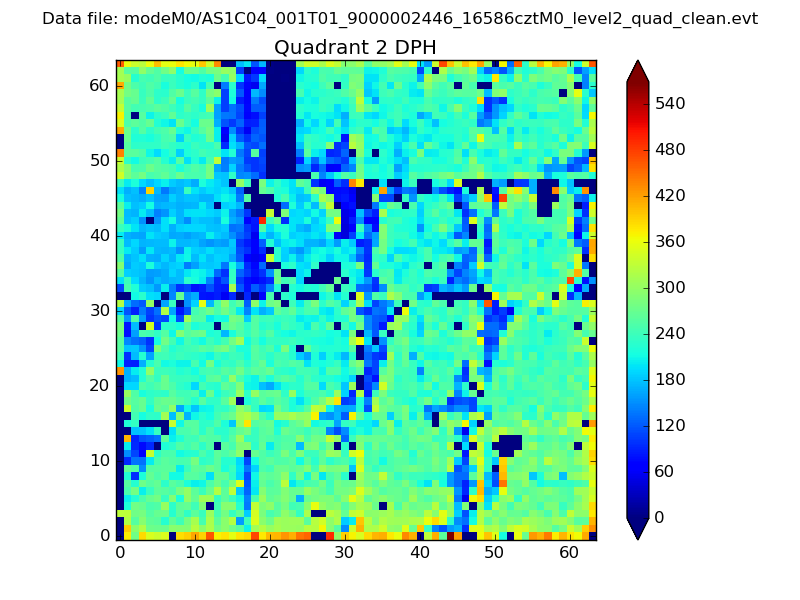
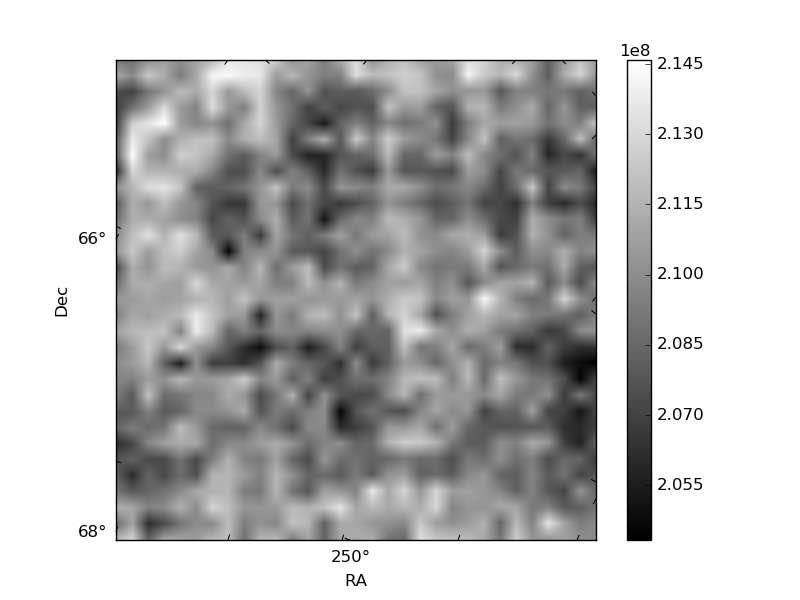
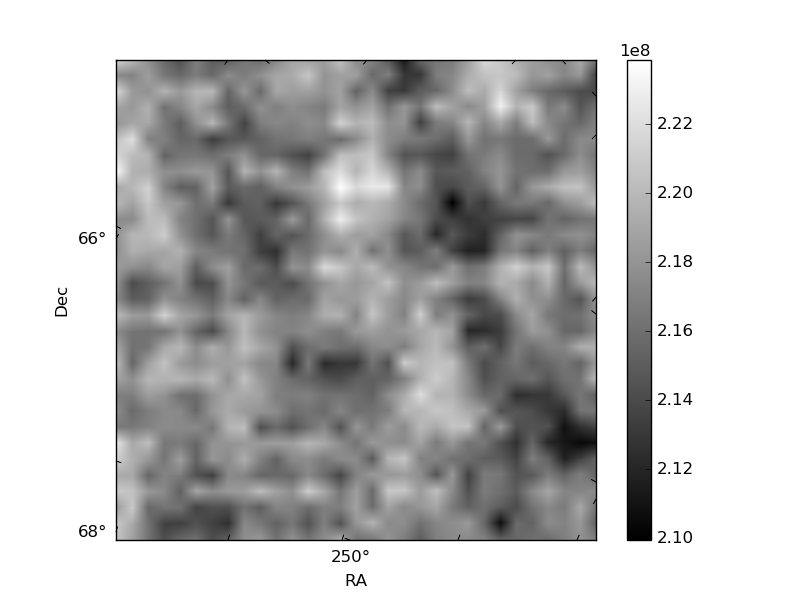
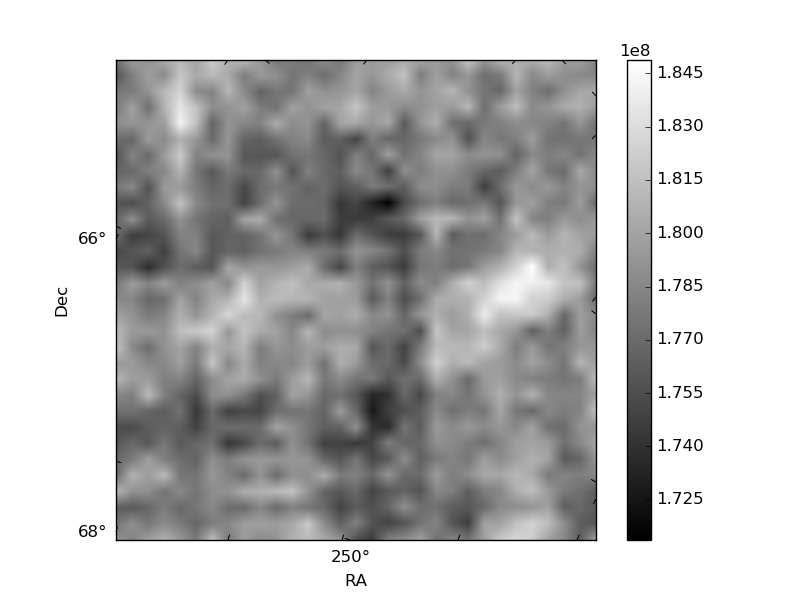
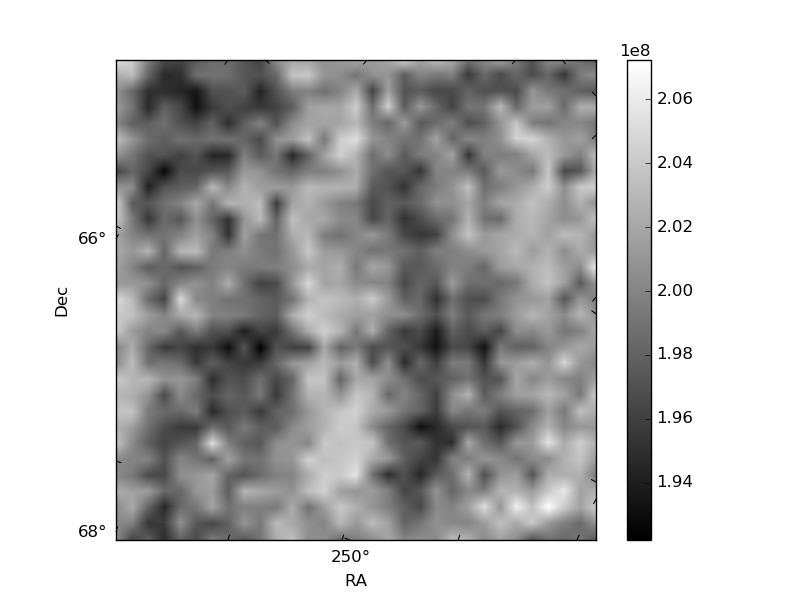
Histogram calculated using DETX and DETY for each event in the final _common_clean file
| Quadrant A | 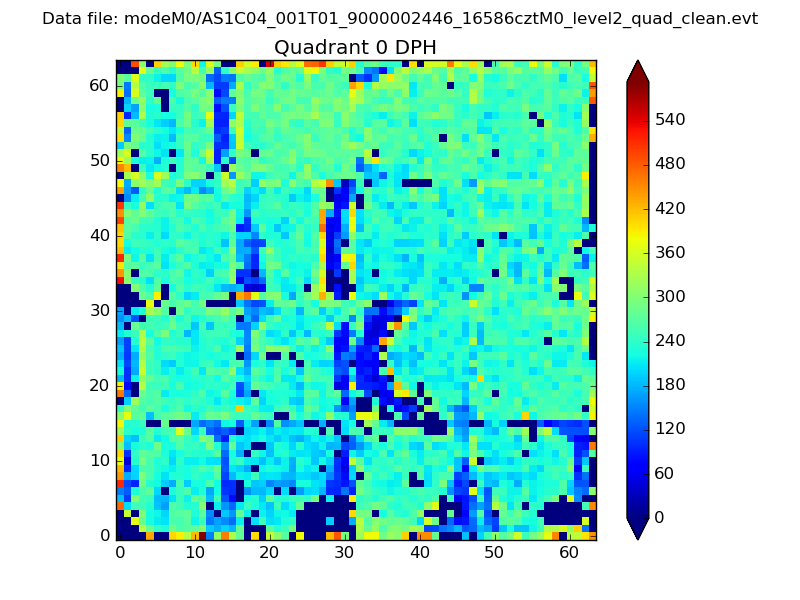 |
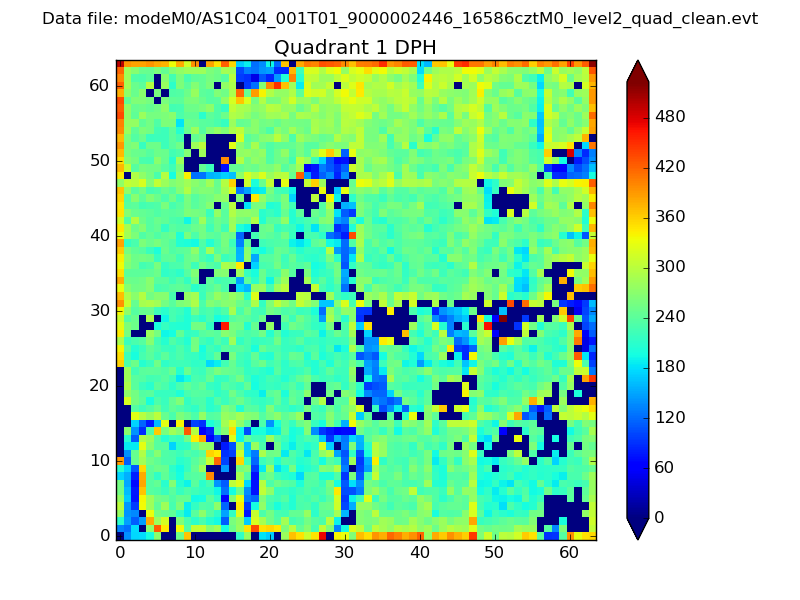 |
Quadrant B |
|---|---|---|---|
| Quadrant D | 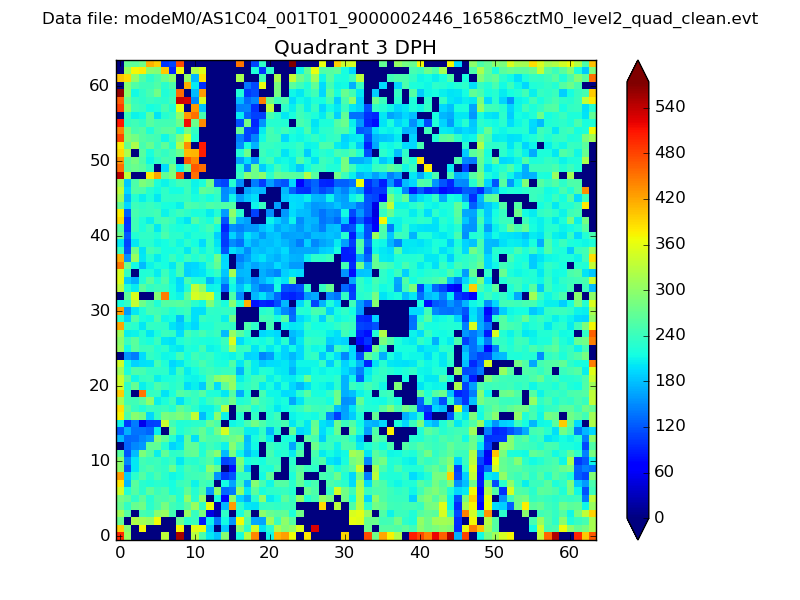 |
 |
Quadrant C |
| Plot type | Count rate plots | Images |
|---|---|---|
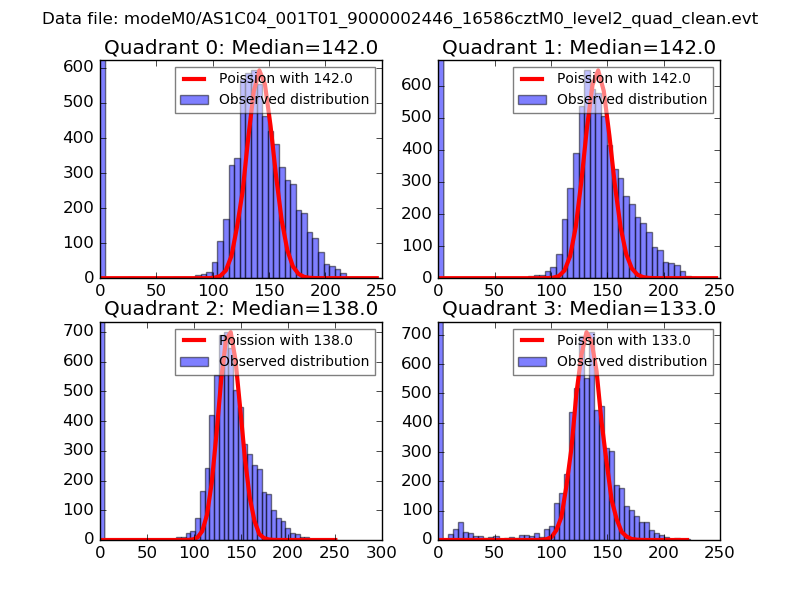
| Comparison with Poisson distribution Blue bars denote a histogram of data divided into 1 sec bins. Red curve is a Poisson curve with rate = median count rate of data. |
 |
 |
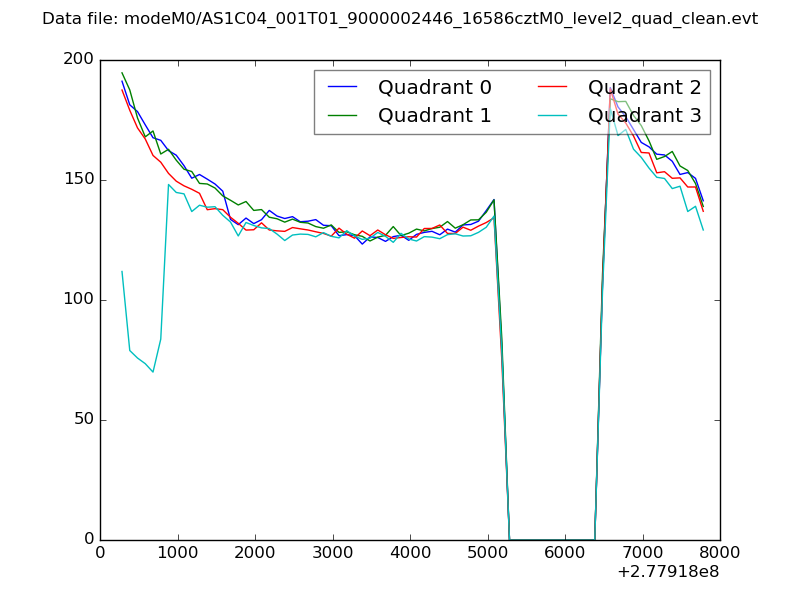
| Quadrant-wise count rates Data is divided into 100 sec bins |
 |
|
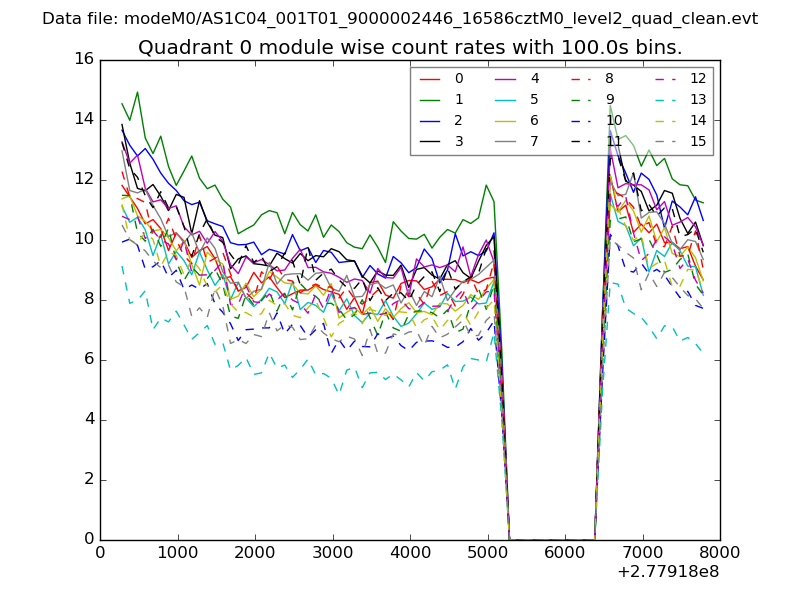
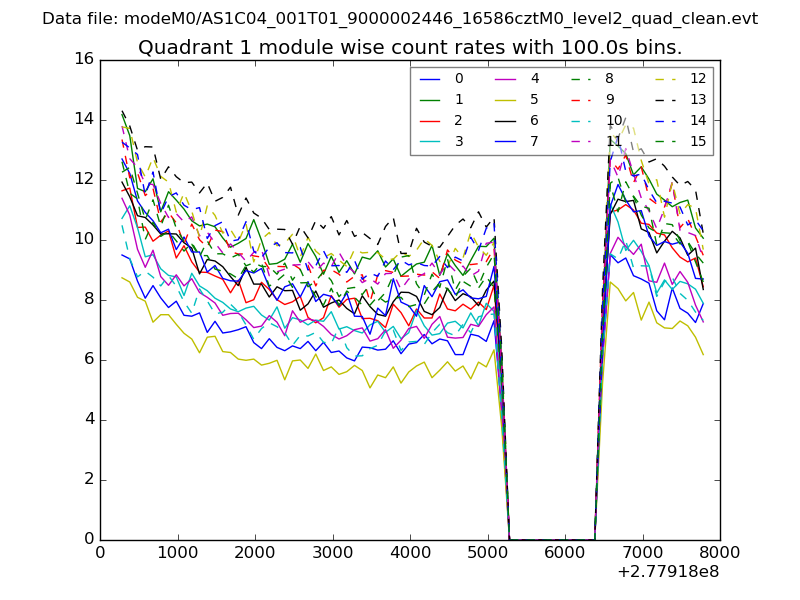
| Module-wise count rates for Quadrant A Data is divided into 100 sec bins |
 |
 |
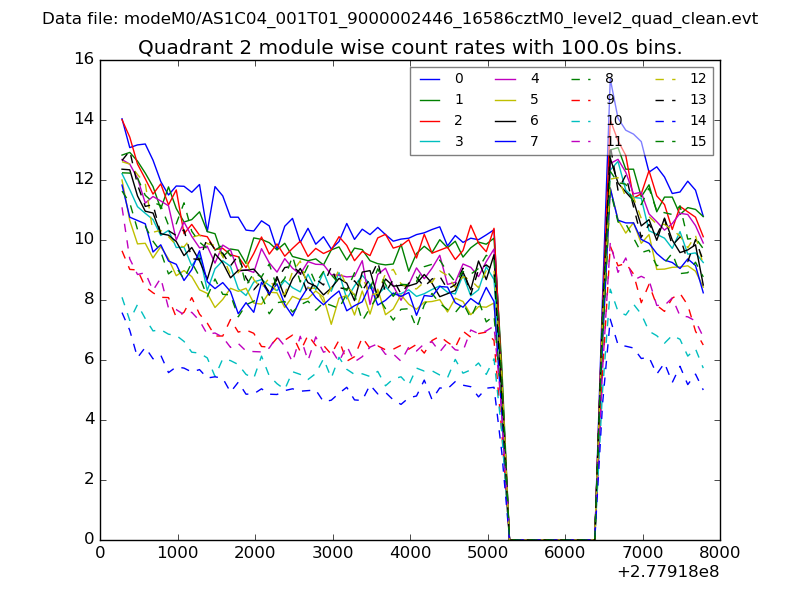
| Module-wise count rates for Quadrant B Data is divided into 100 sec bins |
 |
 |
| Module-wise count rates for Quadrant C Data is divided into 100 sec bins |
 |
 |
| Module-wise count rates for Quadrant D Data is divided into 100 sec bins |
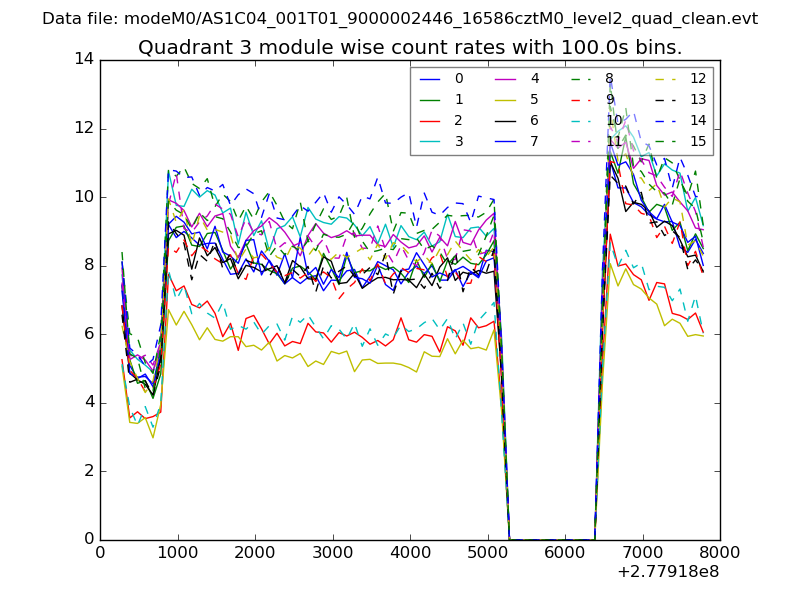 |
 |
| Parameter | Plot |
|---|---|
| CZT HV Monitor | 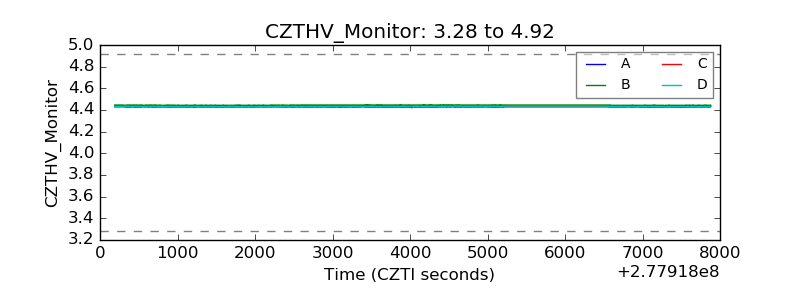 |
| D_VDD | 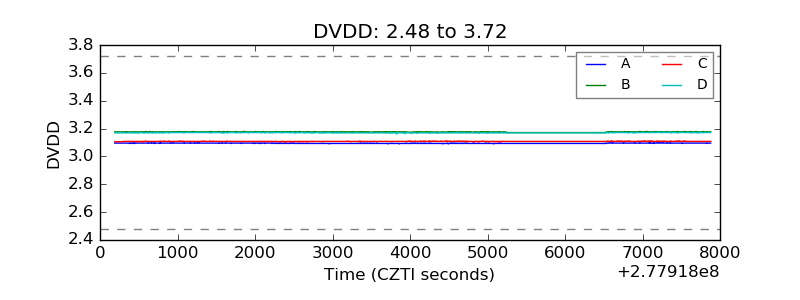 |
| Temperature 1 | 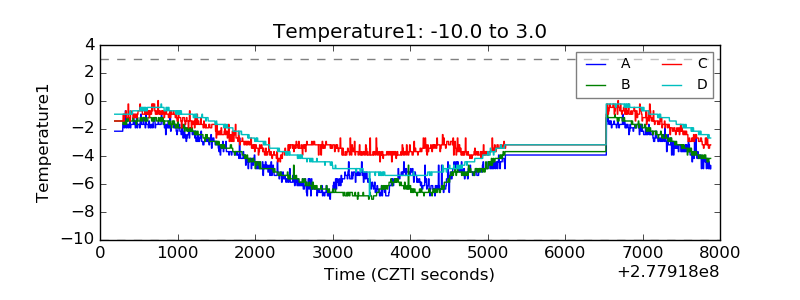 |
| Veto HV Monitor | 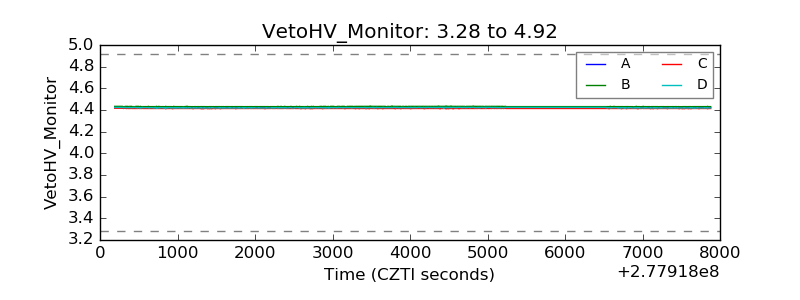 |
| Veto LLD | 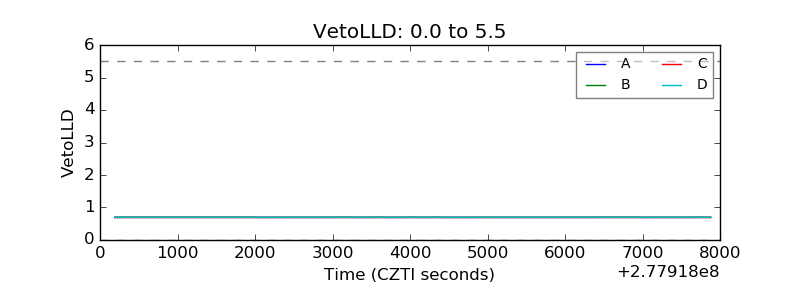 |
| Alpha Counter | 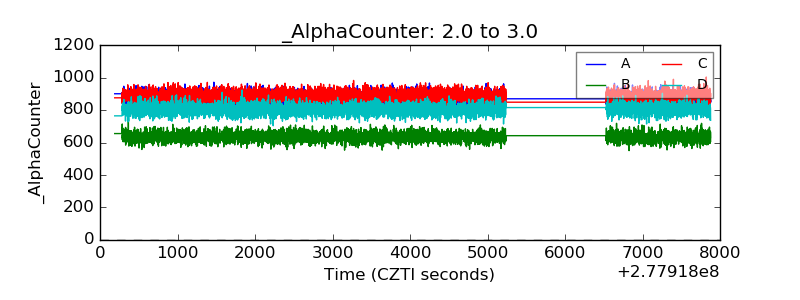 |
| _CPM_Rate | 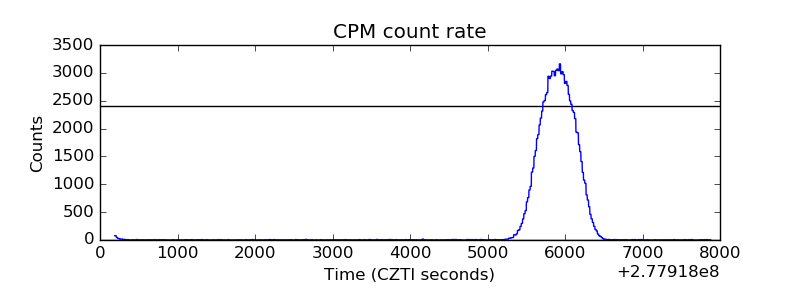 |
| CZT Counter | 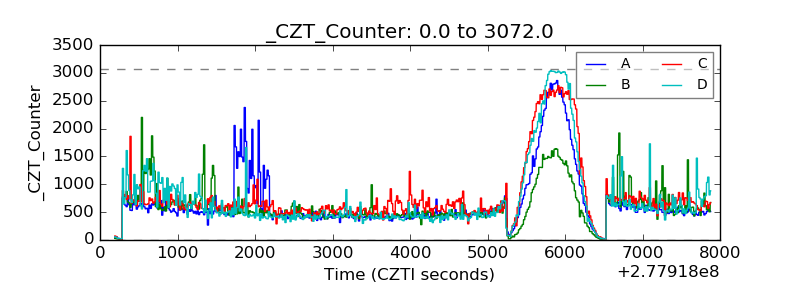 |
| +2.5 Volts monitor | 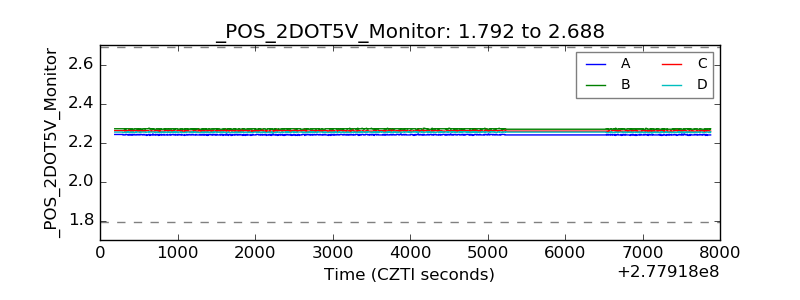 |
| +5 Volts monitor |  |
| _ROLL_ROT | 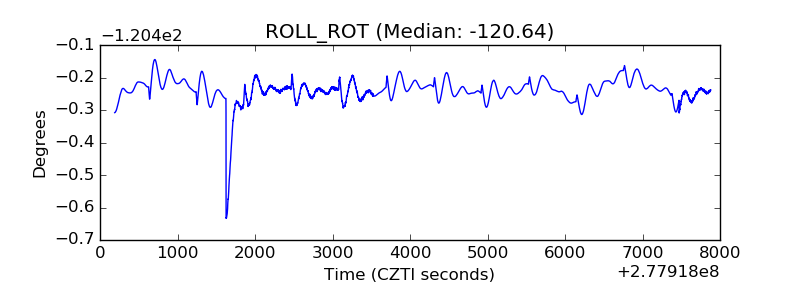 |
| _Roll_DEC | 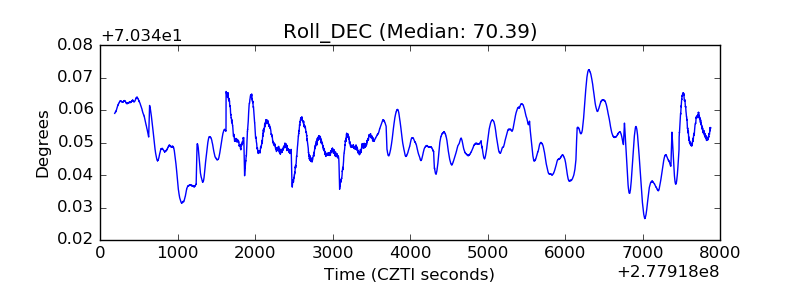 |
| _Roll_RA | 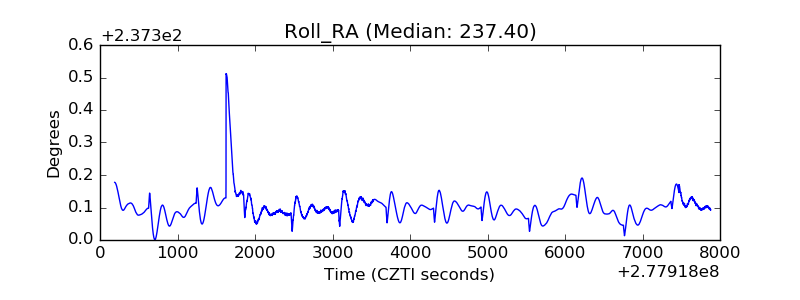 |
| Veto Counter | 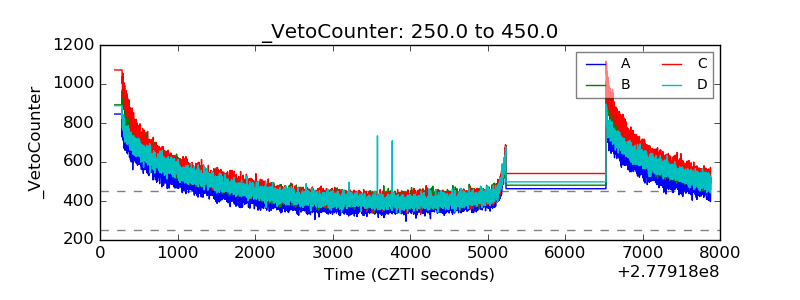 |