| Param | Original file | Final file |
|---|---|---|
| Filename | modeM0/AS1C04_001T01_9000002446_16587cztM0_level2.evt | modeM0/AS1C04_001T01_9000002446_16587cztM0_level2_quad_clean.evt |
| Size (bytes) | 475,384,320 | 128,376,000 |
| Size | 453.4 MB | 122.4 MB |
| Events in quadrant A | 3,076,449 | 875,718 |
| Events in quadrant B | 3,635,049 | 886,531 |
| Events in quadrant C | 3,496,056 | 866,612 |
| Events in quadrant D | 3,778,374 | 836,296 |
| Mode M9 | |||
|---|---|---|---|
| Quadrant | BADHDUFLAG | Total packets | Discarded packets |
| A | 0 | 13 | 0 |
| B | 0 | 13 | 0 |
| C | 0 | 13 | 0 |
| D | 0 | 13 | 0 |
| Mode SS | |||
|---|---|---|---|
| Quadrant | BADHDUFLAG | Total packets | Discarded packets |
| A | 0 | 124 | 0 |
| B | 0 | 124 | 0 |
| C | 0 | 124 | 0 |
| D | 0 | 124 | 0 |
| Mode M0 | |||
|---|---|---|---|
| Quadrant | BADHDUFLAG | Total packets | Discarded packets |
| A | 0 | 13099 | 2 |
| B | 0 | 14740 | 1 |
| C | 0 | 14650 | 1 |
| D | 0 | 15280 | 1 |
| Quadrant | Total seconds | Saturated seconds | Saturation percentage |
|---|---|---|---|
| A | 6058 | 56 | 0.924397% |
| B | 6058 | 114 | 1.881809% |
| C | 6058 | 104 | 1.716738% |
| D | 6058 | 187 | 3.086827% |
Noise dominated data is calculated using 1-second bins in cleaned event files. If a bin has >2000 counts, and if more than 50% of those come from <1% of pixels, then it is considered to be noise-dominated and hence unusable.
| Quadrant | # 1 sec bins | Bins with >0 counts | Bins with >2000 counts | High rate bins dominated by noise | Noise dominated (total time) | Noise dominated (detector-on time) | Marked lightcurve |
|---|---|---|---|---|---|---|---|
| A | 7379 | 6060 | 20 | 20 | 0.27% | 0.33% | 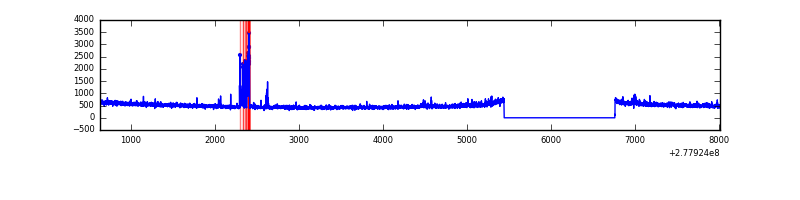 |
| B | 7379 | 6060 | 36 | 36 | 0.49% | 0.59% | 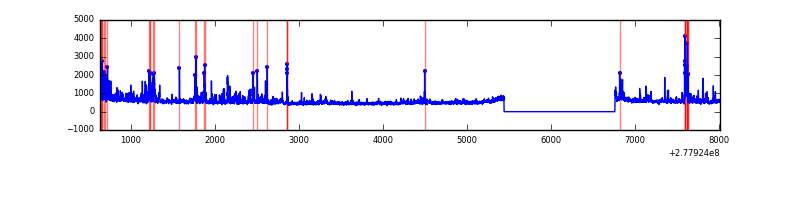 |
| C | 7379 | 6060 | 1 | 1 | 0.01% | 0.02% | 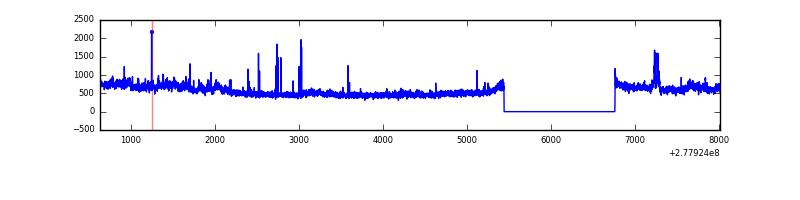 |
| D | 7379 | 6060 | 152 | 152 | 2.06% | 2.51% | 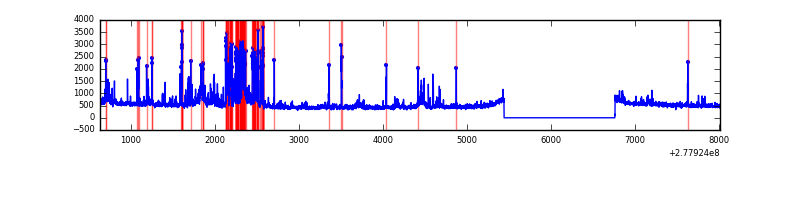 |
Top three noisy pixels from each quadrant. If the there are fewer than three noisy pixels in the level2.evt file, extra rows are filled as -1
| Pixel properties | Quadrant properties | ||||||
|---|---|---|---|---|---|---|---|
| Quadrant | DetID | PixID | Counts | Sigma | Mean | Median | Sigma |
| A | 15 | 174 | 122698 | 801.21 | 760 | 744 | 152.2 |
| A | 15 | 223 | 17359 | 109.16 | 760 | 744 | 152.2 |
| A | 9 | 143 | 7391 | 43.67 | 760 | 744 | 152.2 |
| B | 15 | 35 | 290849 | 2084.2 | 765 | 747 | 139.2 |
| B | 0 | 229 | 61207 | 434.37 | 765 | 747 | 139.2 |
| B | 10 | 16 | 59178 | 419.79 | 765 | 747 | 139.2 |
| C | 3 | 233 | 433626 | 2506.46 | 750 | 755 | 172.7 |
| C | 14 | 238 | 118584 | 682.27 | 750 | 755 | 172.7 |
| C | 7 | 247 | 14077 | 77.14 | 750 | 755 | 172.7 |
| D | 1 | 52 | 599829 | 3320.34 | 749 | 730 | 180.4 |
| D | 5 | 222 | 249647 | 1379.55 | 749 | 730 | 180.4 |
| D | 10 | 70 | 45886 | 250.26 | 749 | 730 | 180.4 |
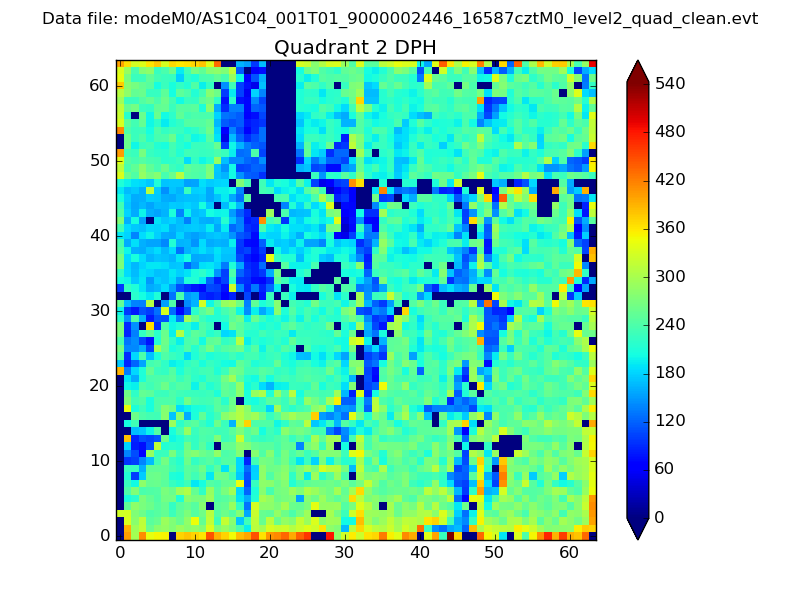
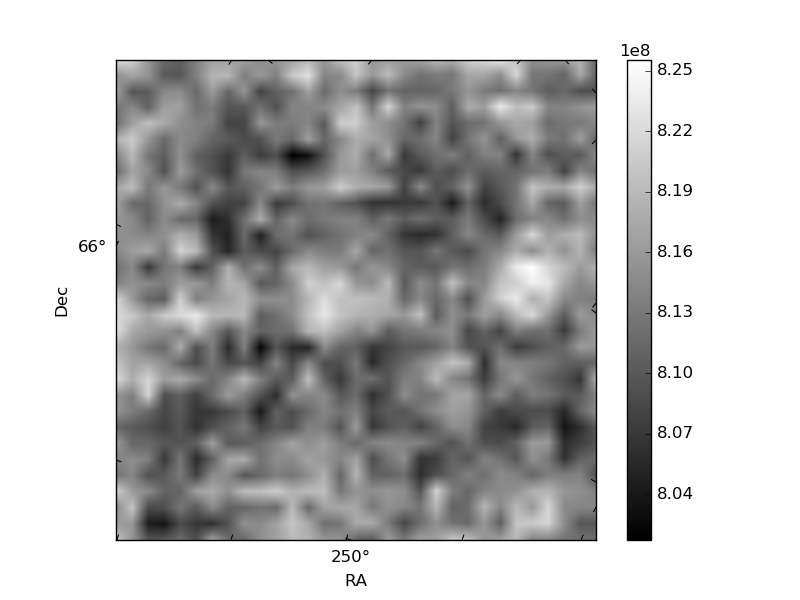
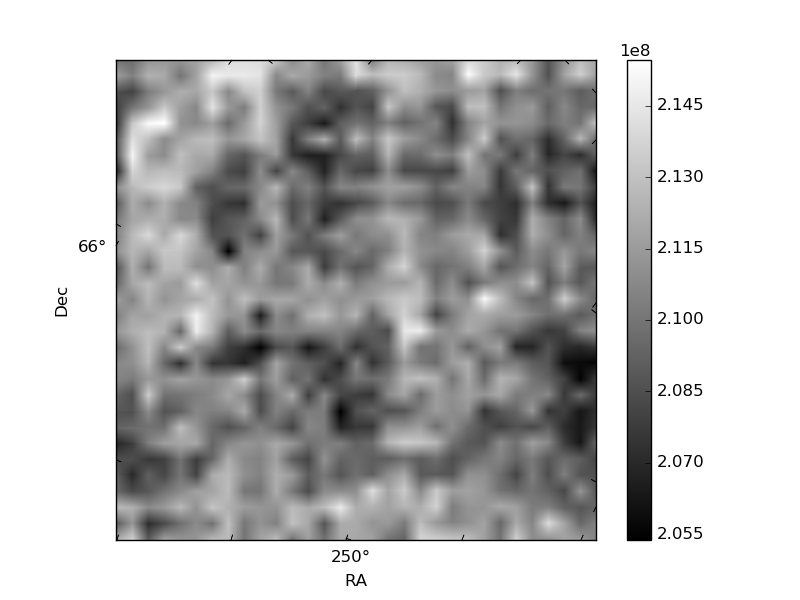
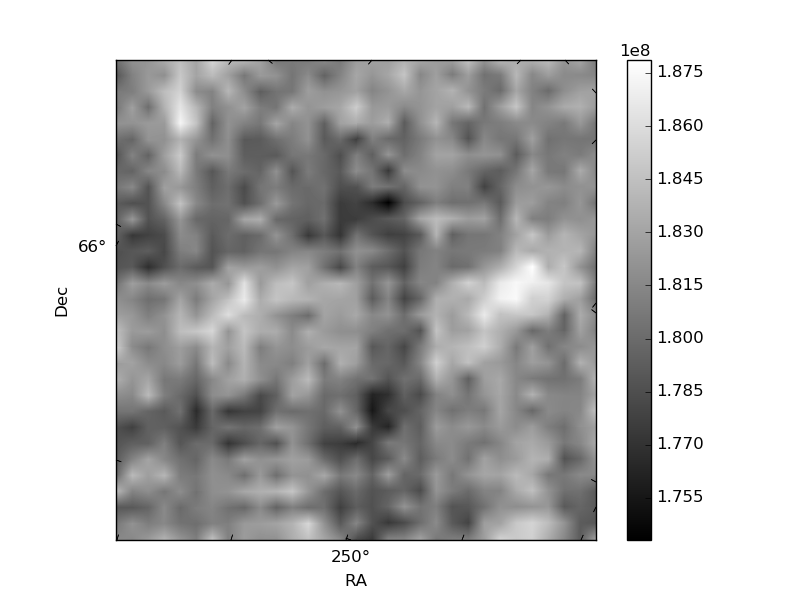
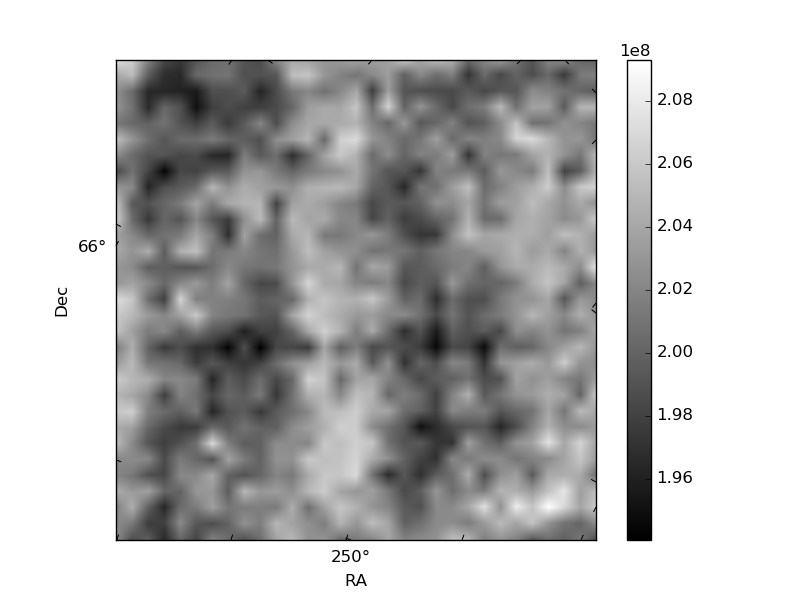
Histogram calculated using DETX and DETY for each event in the final _common_clean file
| Quadrant A | 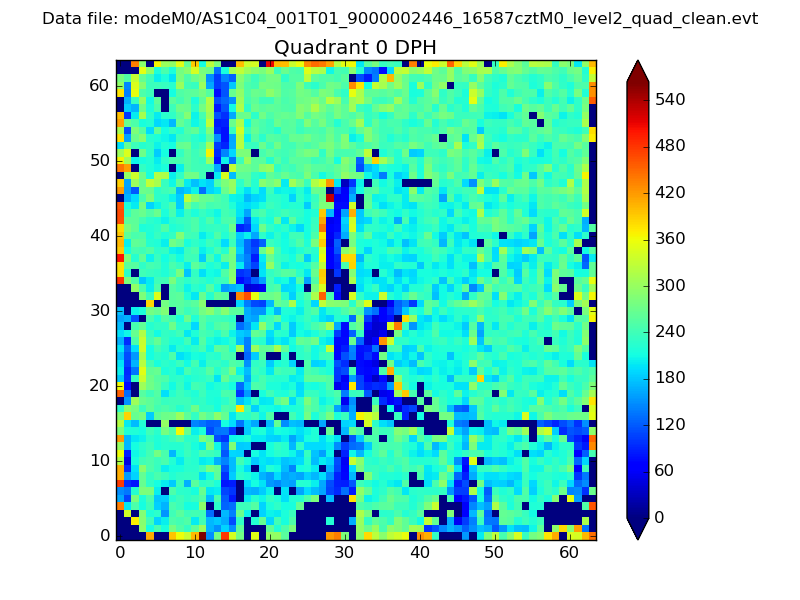 |
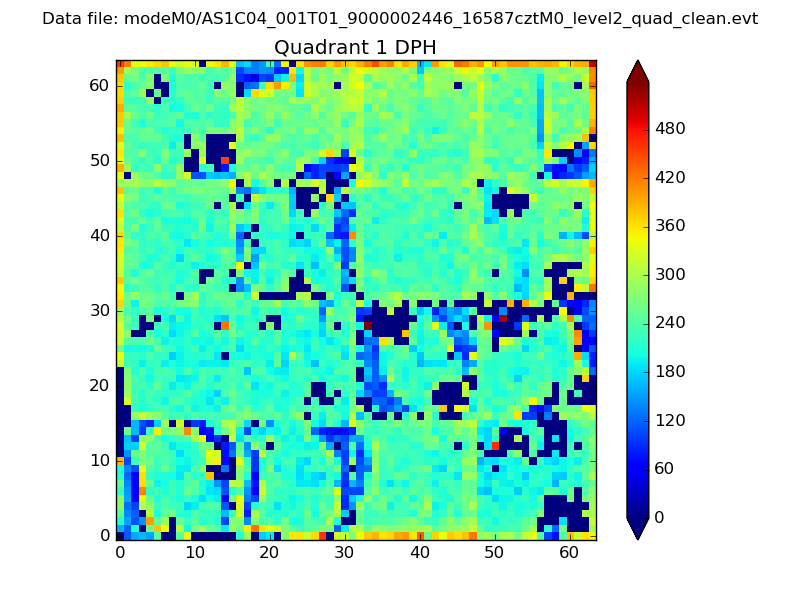 |
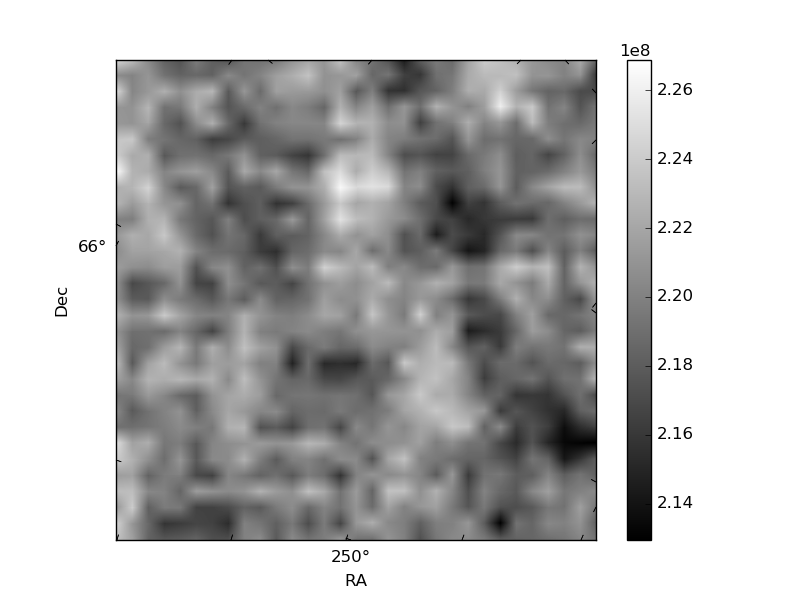
Quadrant B |
|---|---|---|---|
| Quadrant D | 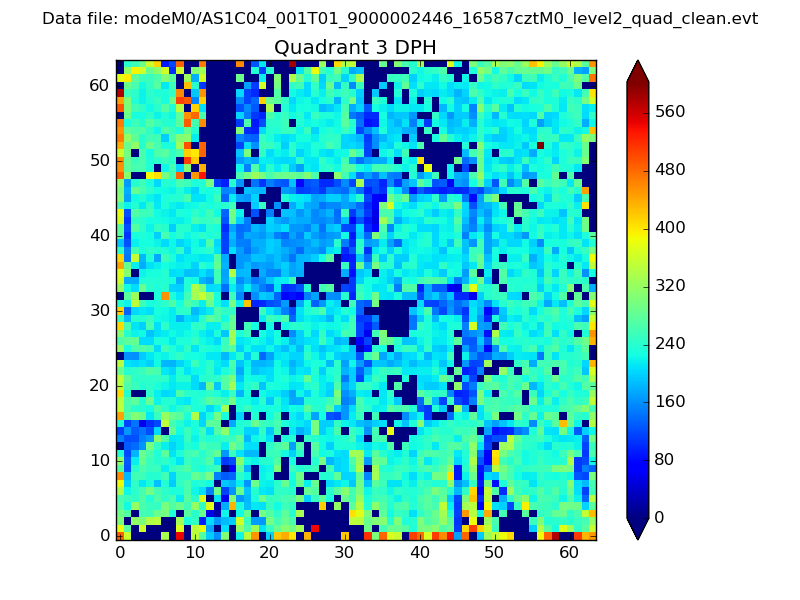 |
 |
Quadrant C |
| Plot type | Count rate plots | Images |
|---|---|---|
| Comparison with Poisson distribution Blue bars denote a histogram of data divided into 1 sec bins. Red curve is a Poisson curve with rate = median count rate of data. |
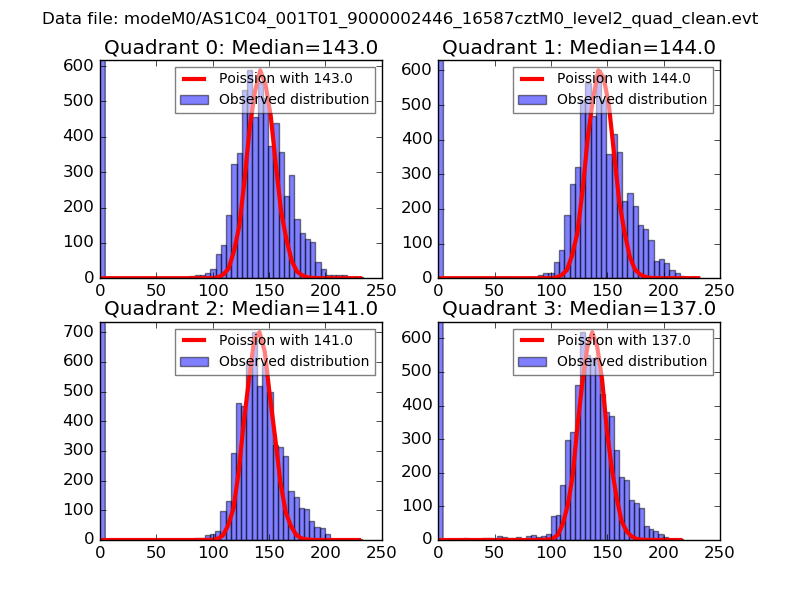 |
 |
| Quadrant-wise count rates Data is divided into 100 sec bins |
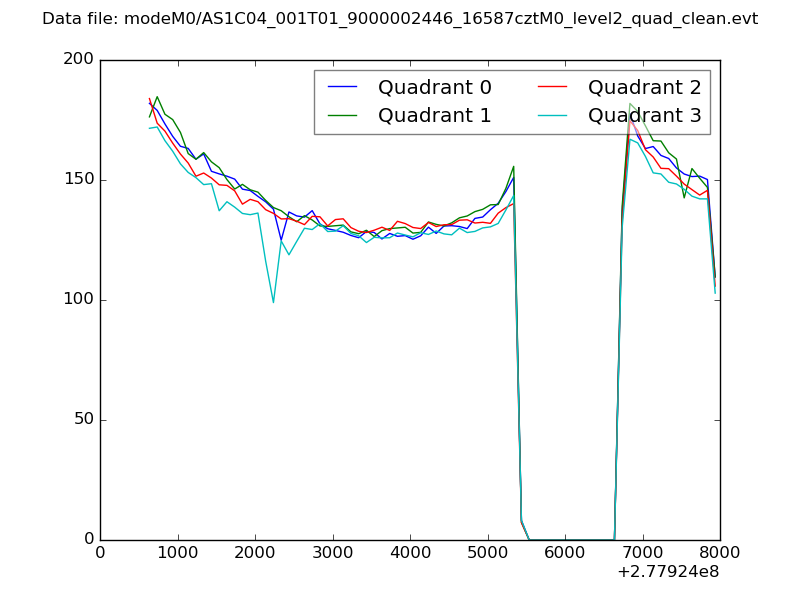 |
|
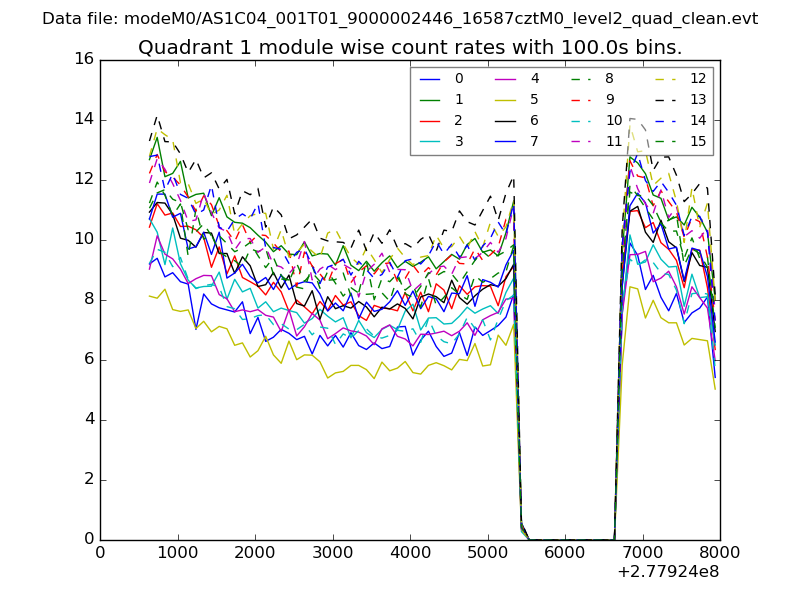
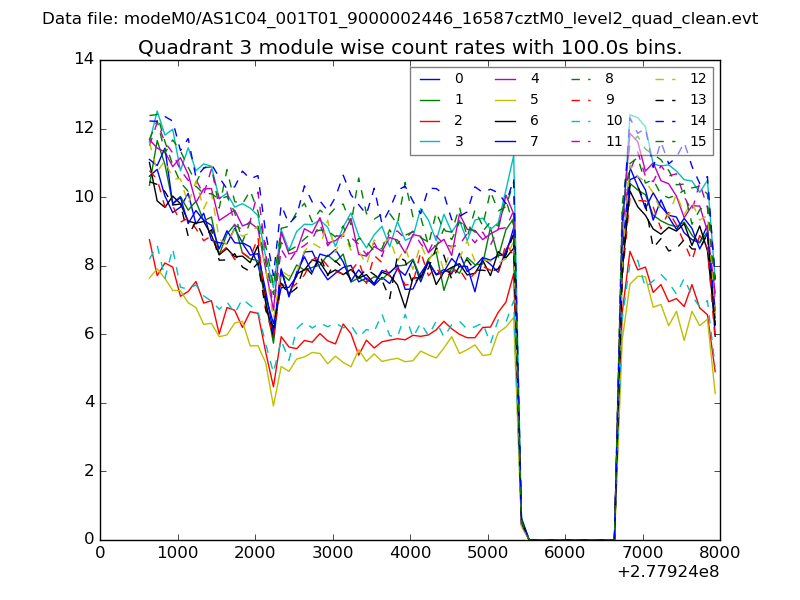
| Module-wise count rates for Quadrant A Data is divided into 100 sec bins |
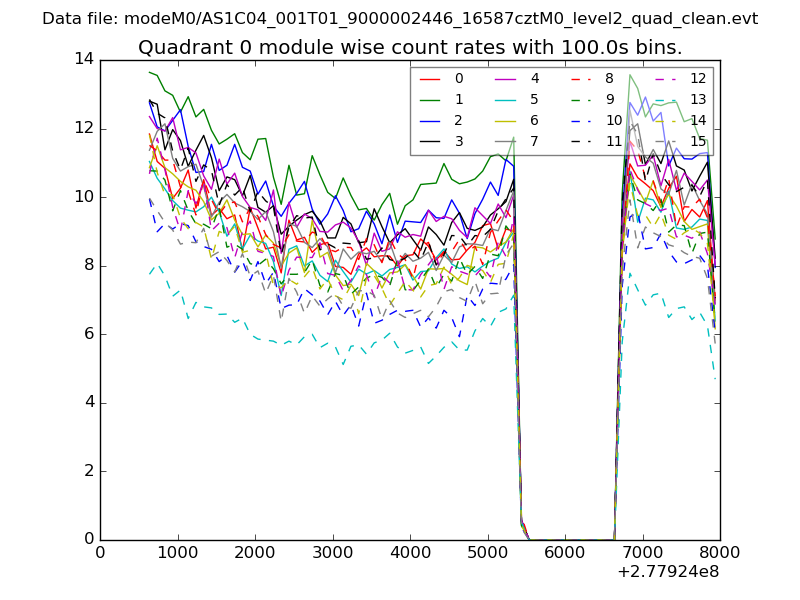 |
 |
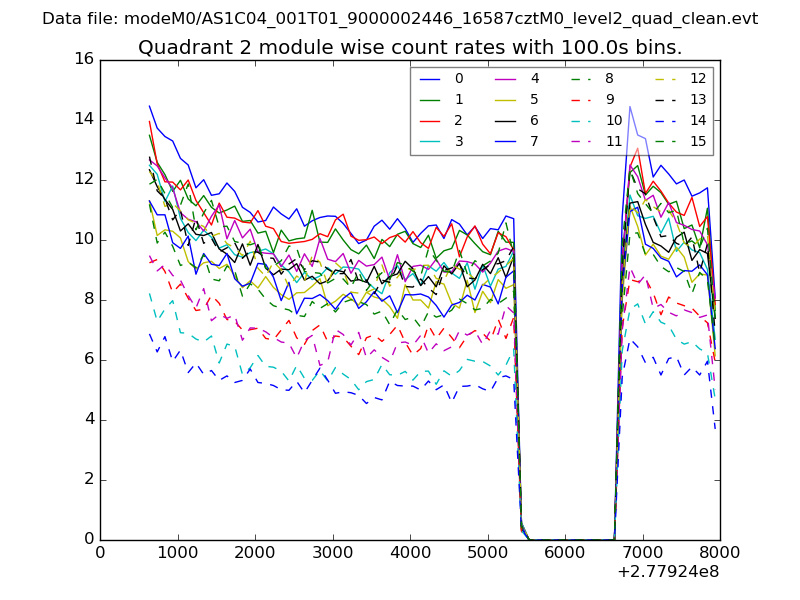
| Module-wise count rates for Quadrant B Data is divided into 100 sec bins |
 |
 |
| Module-wise count rates for Quadrant C Data is divided into 100 sec bins |
 |
 |
| Module-wise count rates for Quadrant D Data is divided into 100 sec bins |
 |
 |
| Parameter | Plot |
|---|---|
| CZT HV Monitor | 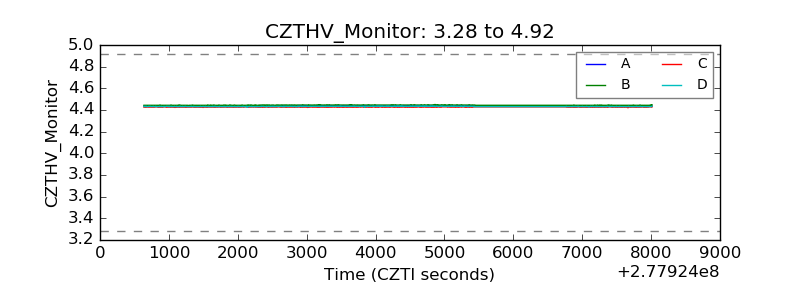 |
| D_VDD | 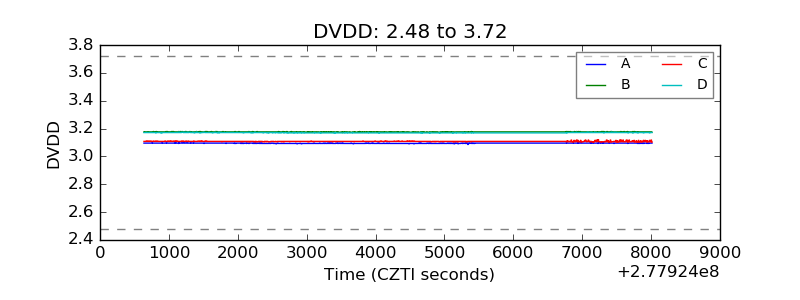 |
| Temperature 1 | 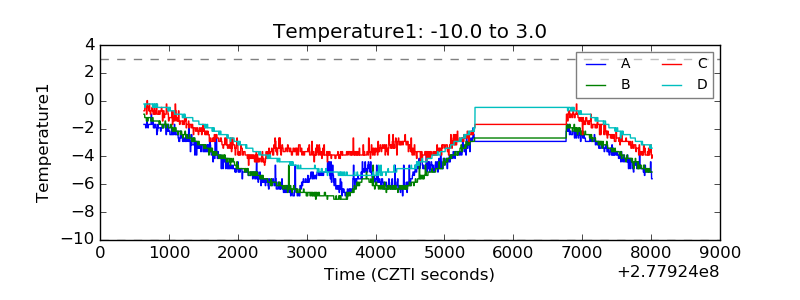 |
| Veto HV Monitor | 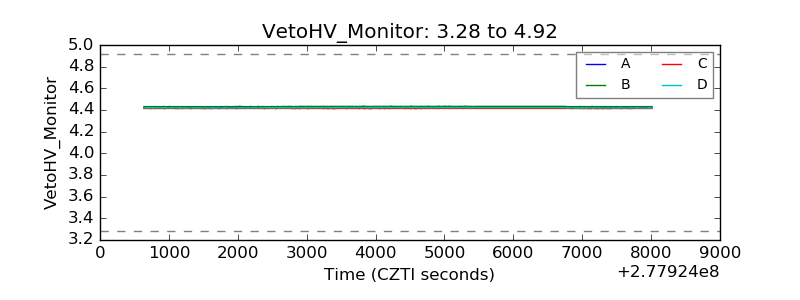 |
| Veto LLD | 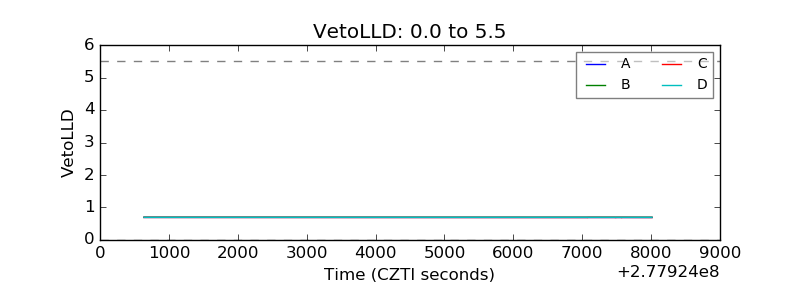 |
| Alpha Counter | 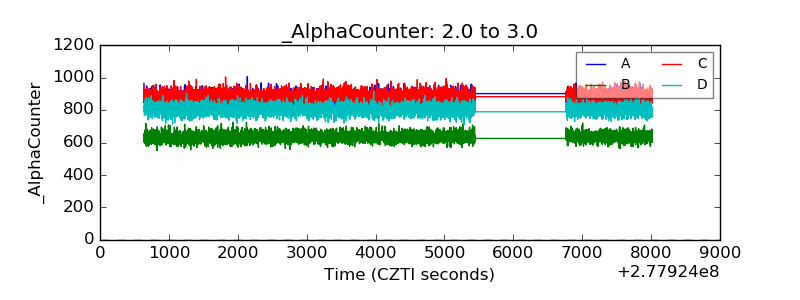 |
| _CPM_Rate | 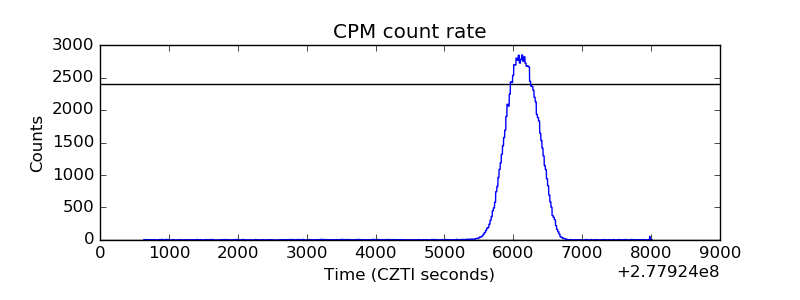 |
| CZT Counter | 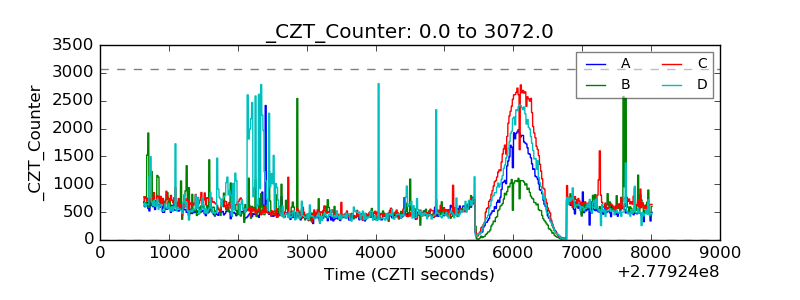 |
| +2.5 Volts monitor |  |
| +5 Volts monitor |  |
| _ROLL_ROT | 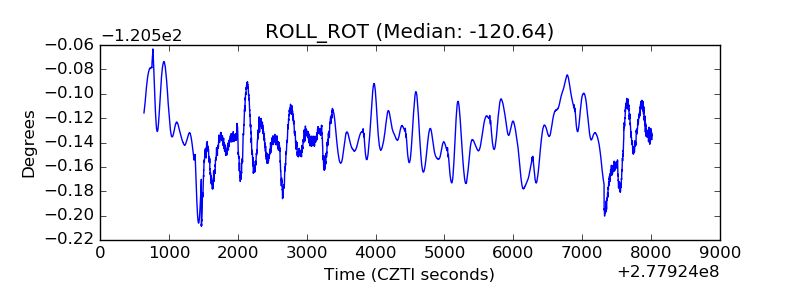 |
| _Roll_DEC | 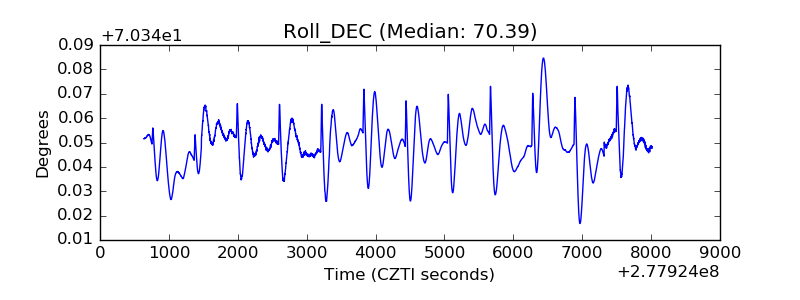 |
| _Roll_RA | 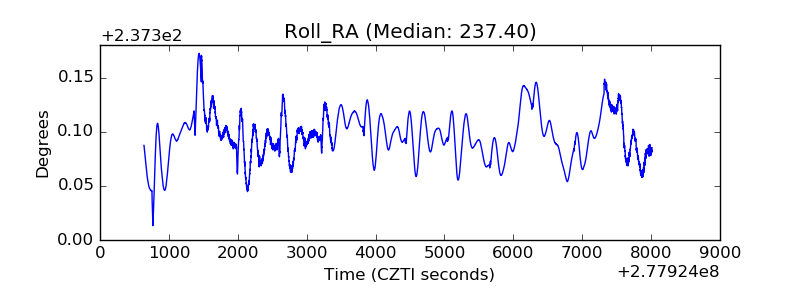 |
| Veto Counter | 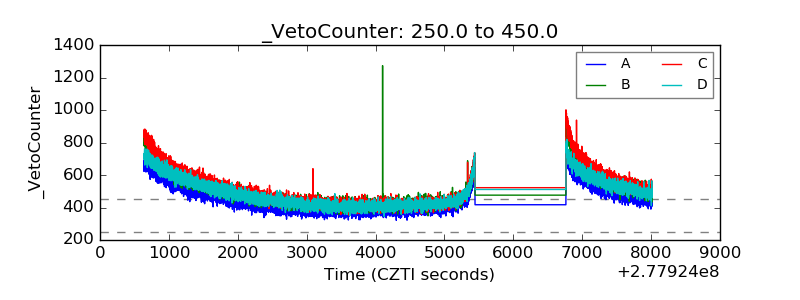 |