| Param | Original file | Final file |
|---|---|---|
| Filename | modeM0/AS1C04_001T01_9000002446_16588cztM0_level2.evt | modeM0/AS1C04_001T01_9000002446_16588cztM0_level2_quad_clean.evt |
| Size (bytes) | 453,916,800 | 128,522,880 |
| Size | 432.9 MB | 122.6 MB |
| Events in quadrant A | 2,966,272 | 874,331 |
| Events in quadrant B | 3,424,582 | 885,739 |
| Events in quadrant C | 3,341,608 | 865,834 |
| Events in quadrant D | 3,594,739 | 835,491 |
| Mode M9 | |||
|---|---|---|---|
| Quadrant | BADHDUFLAG | Total packets | Discarded packets |
| A | 0 | 19 | 0 |
| B | 0 | 19 | 0 |
| C | 0 | 19 | 0 |
| D | 0 | 20 | 0 |
| Mode SS | |||
|---|---|---|---|
| Quadrant | BADHDUFLAG | Total packets | Discarded packets |
| A | 0 | 124 | 0 |
| B | 0 | 124 | 0 |
| C | 0 | 124 | 0 |
| D | 0 | 124 | 0 |
| Mode M0 | |||
|---|---|---|---|
| Quadrant | BADHDUFLAG | Total packets | Discarded packets |
| A | 0 | 12930 | 3 |
| B | 0 | 14173 | 2 |
| C | 0 | 14088 | 2 |
| D | 0 | 14748 | 2 |
| Quadrant | Total seconds | Saturated seconds | Saturation percentage |
|---|---|---|---|
| A | 6185 | 33 | 0.533549% |
| B | 6185 | 75 | 1.212611% |
| C | 6185 | 78 | 1.261116% |
| D | 6185 | 87 | 1.406629% |
Noise dominated data is calculated using 1-second bins in cleaned event files. If a bin has >2000 counts, and if more than 50% of those come from <1% of pixels, then it is considered to be noise-dominated and hence unusable.
| Quadrant | # 1 sec bins | Bins with >0 counts | Bins with >2000 counts | High rate bins dominated by noise | Noise dominated (total time) | Noise dominated (detector-on time) | Marked lightcurve |
|---|---|---|---|---|---|---|---|
| A | 7522 | 6188 | 4 | 4 | 0.05% | 0.06% | 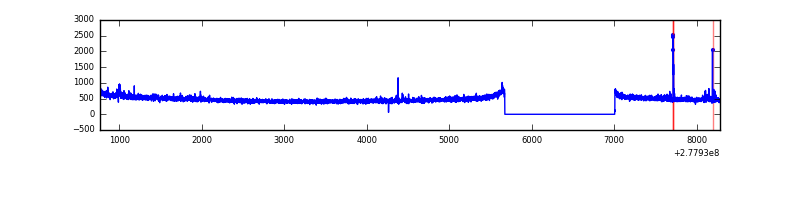 |
| B | 7522 | 6188 | 16 | 16 | 0.21% | 0.26% | 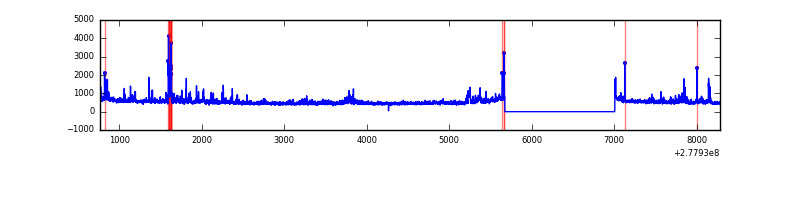 |
| C | 7522 | 6188 | 0 | 0 | 0.00% | 0.00% | 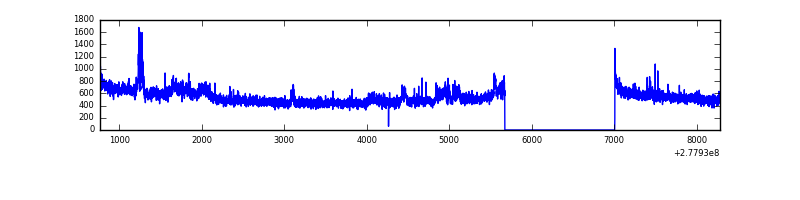 |
| D | 7522 | 6188 | 41 | 41 | 0.55% | 0.66% | 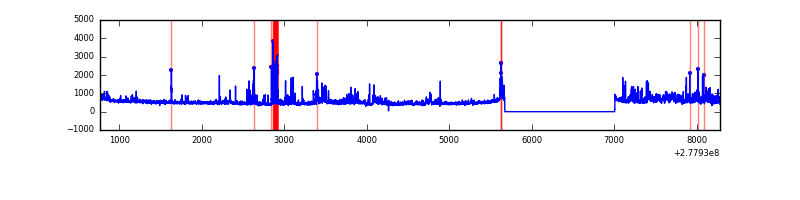 |
Top three noisy pixels from each quadrant. If the there are fewer than three noisy pixels in the level2.evt file, extra rows are filled as -1
| Pixel properties | Quadrant properties | ||||||
|---|---|---|---|---|---|---|---|
| Quadrant | DetID | PixID | Counts | Sigma | Mean | Median | Sigma |
| A | 9 | 143 | 29170 | 185.74 | 761 | 747 | 153.0 |
| A | 0 | 226 | 6668 | 38.69 | 761 | 747 | 153.0 |
| A | 12 | 194 | 5660 | 32.1 | 761 | 747 | 153.0 |
| B | 15 | 35 | 78217 | 551.69 | 766 | 750 | 140.4 |
| B | 10 | 16 | 73997 | 521.64 | 766 | 750 | 140.4 |
| B | 0 | 85 | 72829 | 513.32 | 766 | 750 | 140.4 |
| C | 3 | 233 | 275946 | 1587.22 | 749 | 755 | 173.4 |
| C | 14 | 238 | 117437 | 672.99 | 749 | 755 | 173.4 |
| C | 8 | 128 | 10613 | 56.86 | 749 | 755 | 173.4 |
| D | 5 | 222 | 532206 | 2953.99 | 751 | 732 | 179.9 |
| D | 1 | 52 | 86010 | 473.98 | 751 | 732 | 179.9 |
| D | 10 | 70 | 83808 | 461.74 | 751 | 732 | 179.9 |
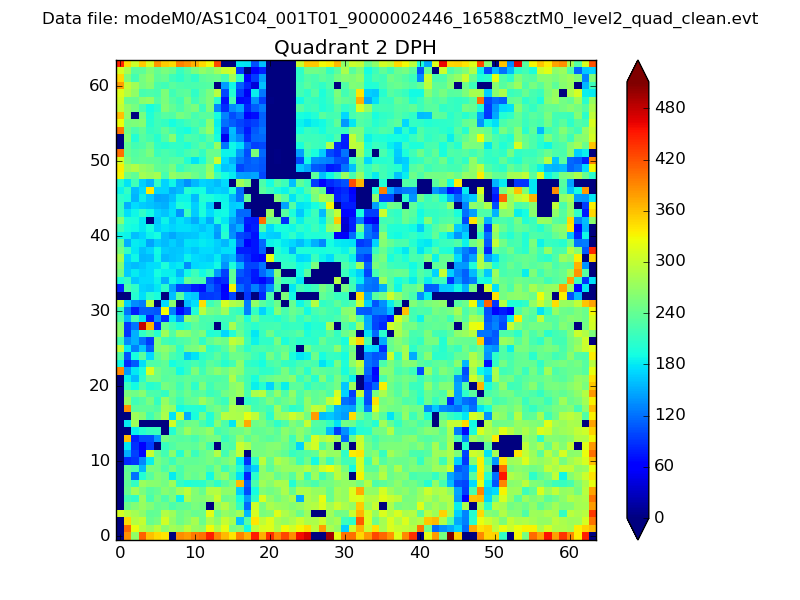
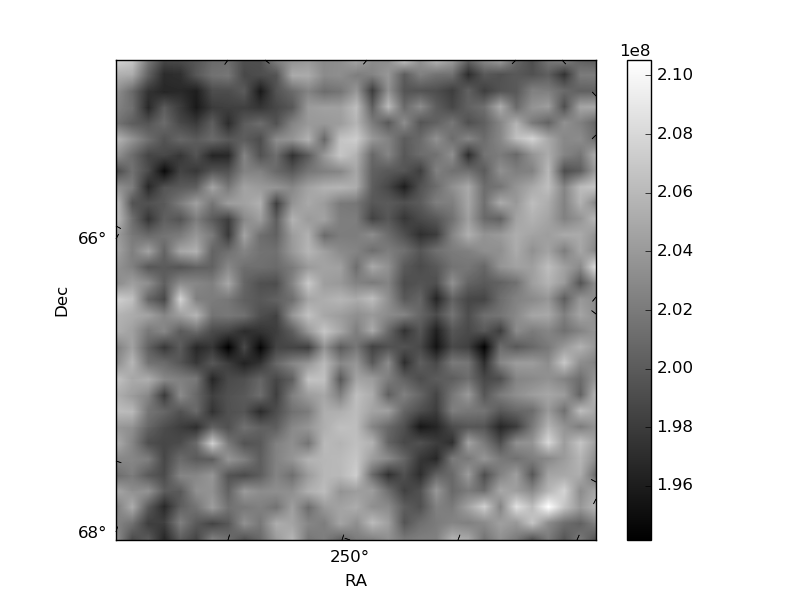
Histogram calculated using DETX and DETY for each event in the final _common_clean file
| Quadrant A | 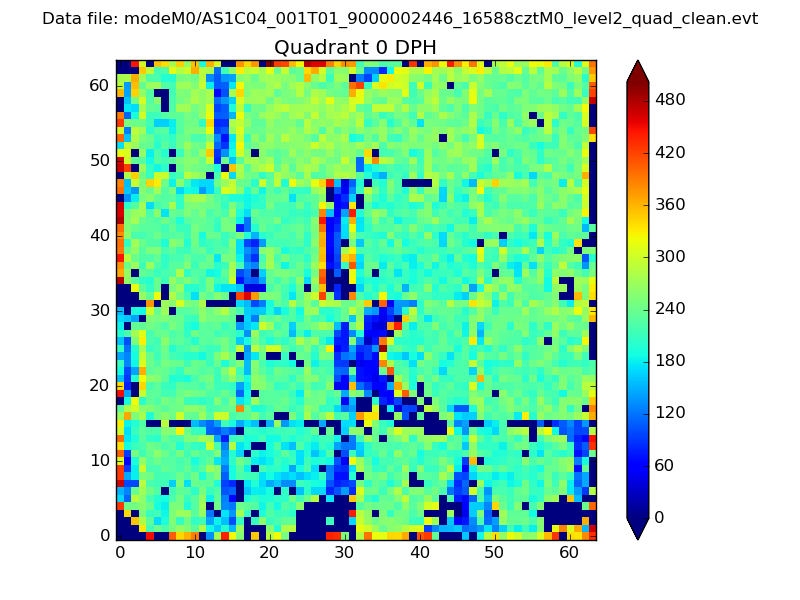 |
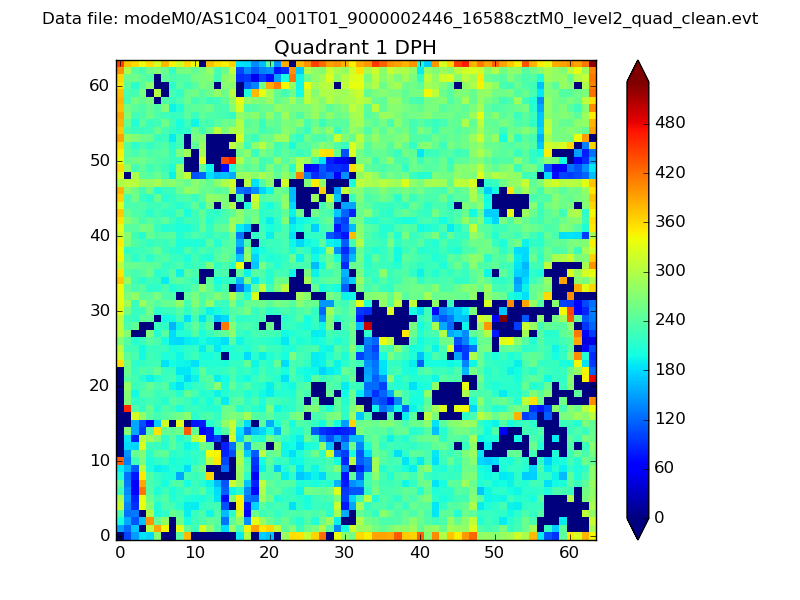 |
Quadrant B |
|---|---|---|---|
| Quadrant D | 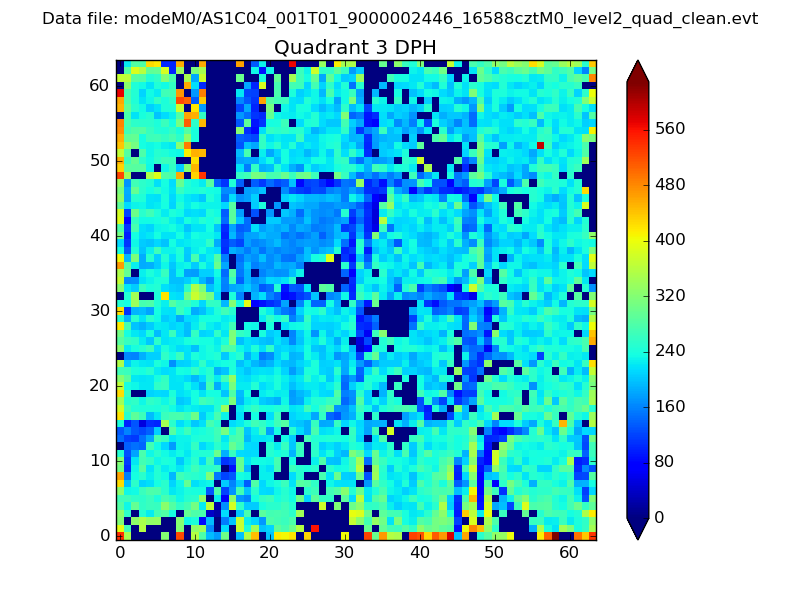 |
 |
Quadrant C |
| Plot type | Count rate plots | Images |
|---|---|---|
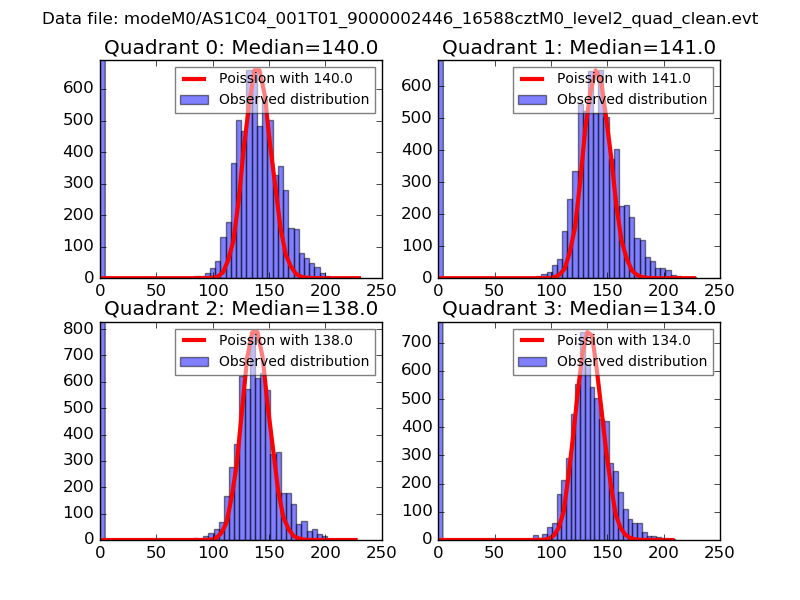
| Comparison with Poisson distribution Blue bars denote a histogram of data divided into 1 sec bins. Red curve is a Poisson curve with rate = median count rate of data. |
 |
 |
| Quadrant-wise count rates Data is divided into 100 sec bins |
 |
|
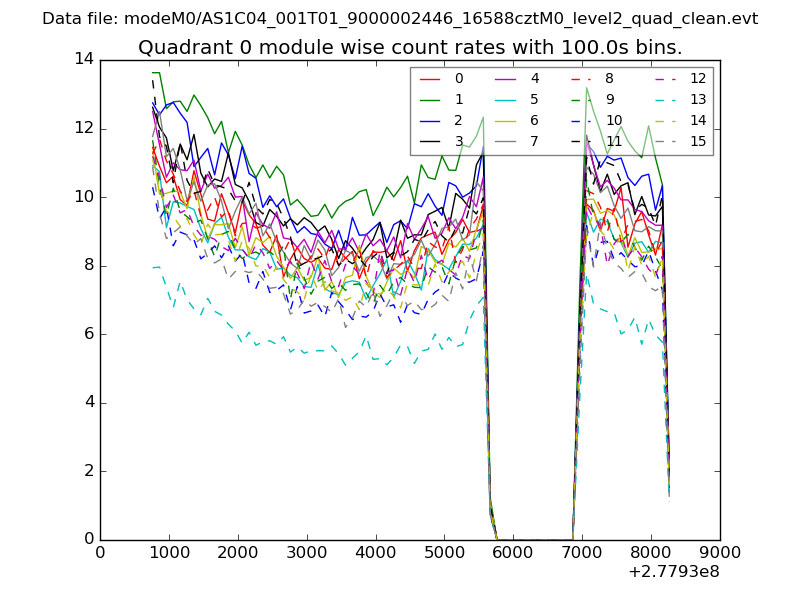
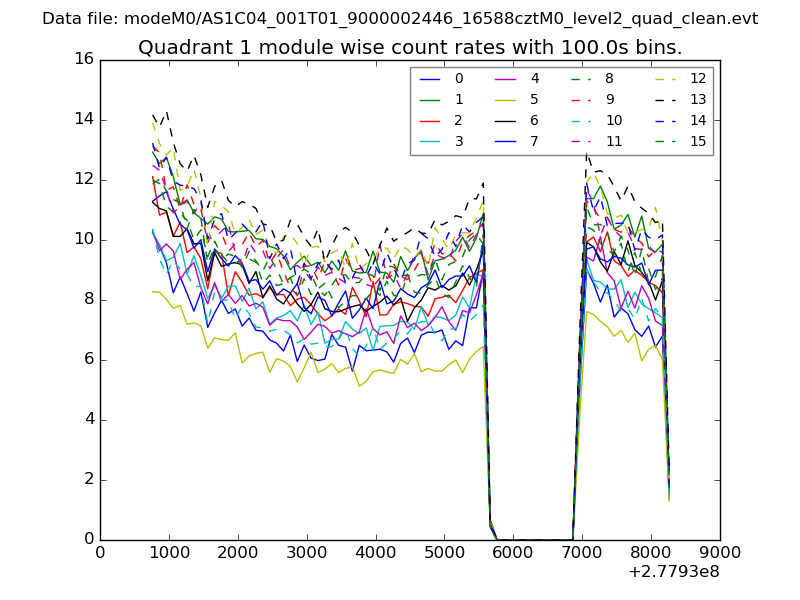
| Module-wise count rates for Quadrant A Data is divided into 100 sec bins |
 |
 |
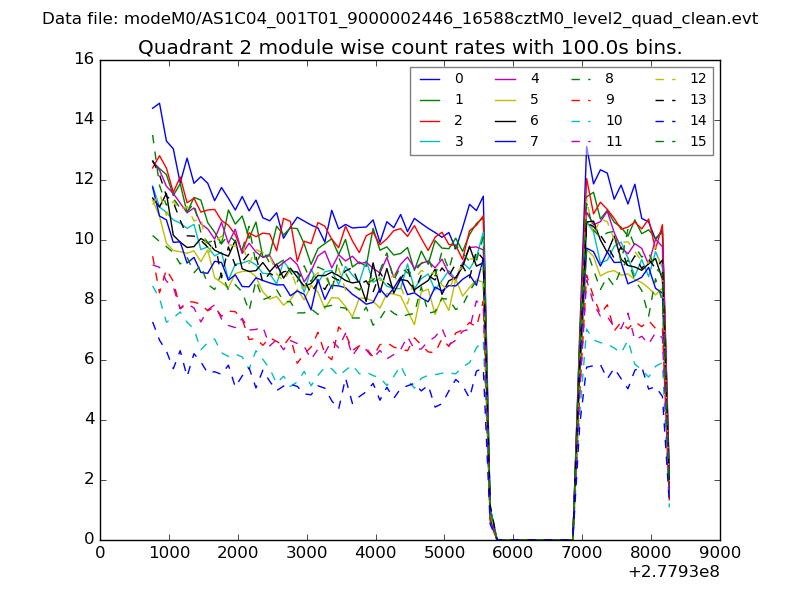
| Module-wise count rates for Quadrant B Data is divided into 100 sec bins |
 |
 |
| Module-wise count rates for Quadrant C Data is divided into 100 sec bins |
 |
 |
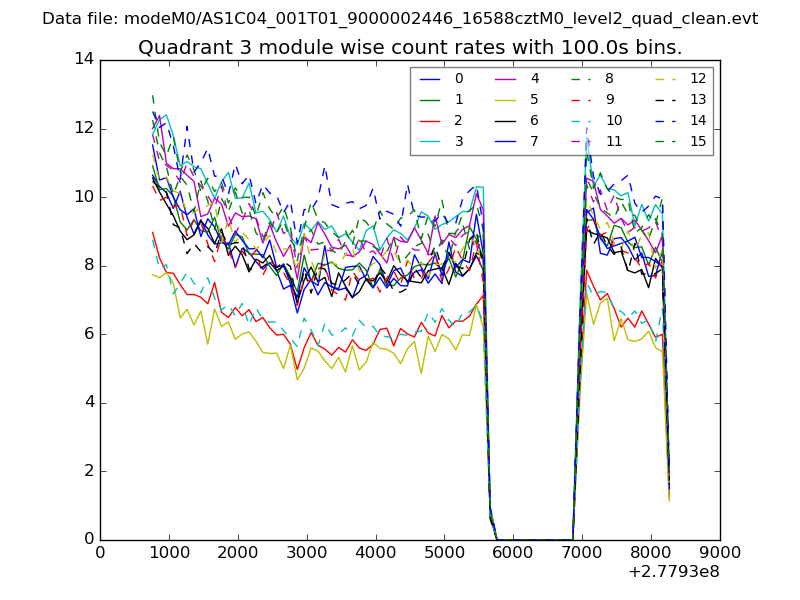
| Module-wise count rates for Quadrant D Data is divided into 100 sec bins |
 |
 |
| Parameter | Plot |
|---|---|
| CZT HV Monitor | 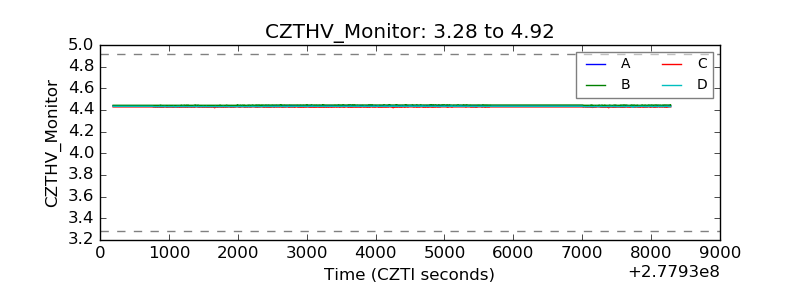 |
| D_VDD | 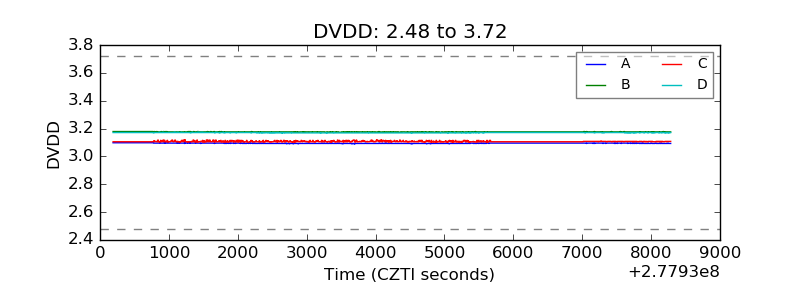 |
| Temperature 1 | 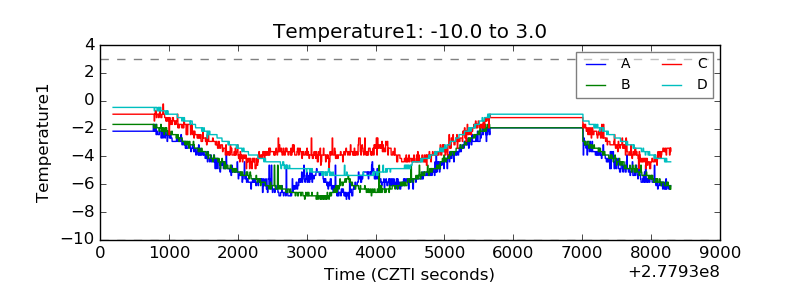 |
| Veto HV Monitor | 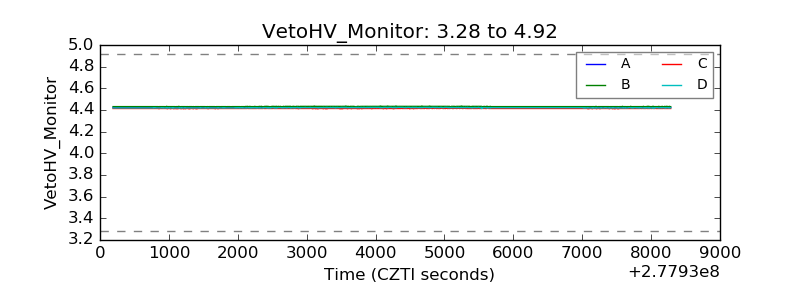 |
| Veto LLD |  |
| Alpha Counter |  |
| _CPM_Rate | 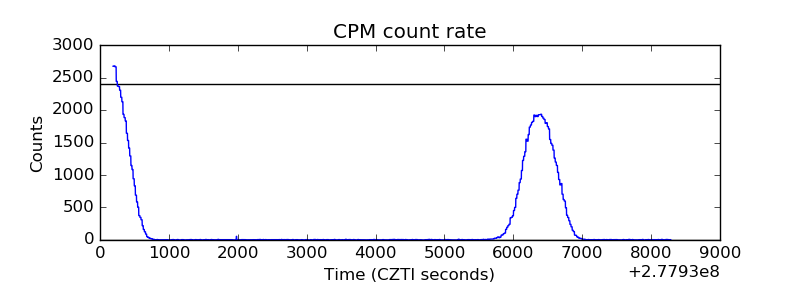 |
| CZT Counter |  |
| +2.5 Volts monitor |  |
| +5 Volts monitor |  |
| _ROLL_ROT | 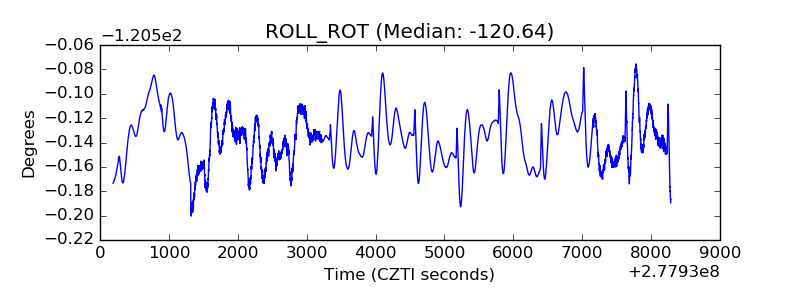 |
| _Roll_DEC | 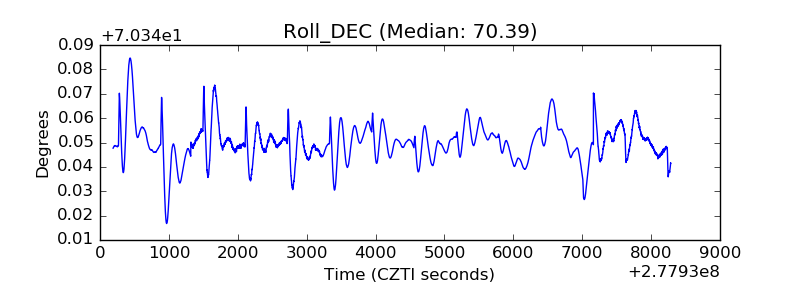 |
| _Roll_RA | 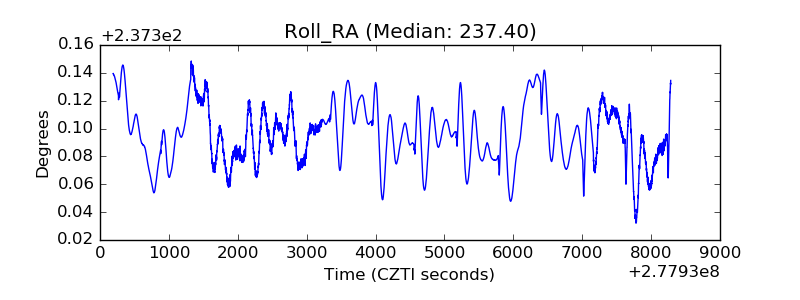 |
| Veto Counter | 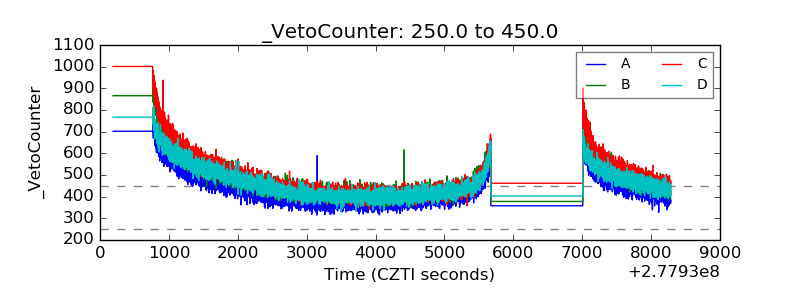 |