| Param | Original file | Final file |
|---|---|---|
| Filename | modeM0/AS1C04_001T01_9000002446_16589cztM0_level2.evt | modeM0/AS1C04_001T01_9000002446_16589cztM0_level2_quad_clean.evt |
| Size (bytes) | 468,878,400 | 125,487,360 |
| Size | 447.2 MB | 119.7 MB |
| Events in quadrant A | 3,055,298 | 850,990 |
| Events in quadrant B | 3,398,396 | 859,063 |
| Events in quadrant C | 3,753,722 | 834,331 |
| Events in quadrant D | 3,560,752 | 812,616 |
| Mode M9 | |||
|---|---|---|---|
| Quadrant | BADHDUFLAG | Total packets | Discarded packets |
| A | 0 | 26 | 0 |
| B | 0 | 26 | 0 |
| C | 0 | 26 | 0 |
| D | 0 | 26 | 0 |
| Mode SS | |||
|---|---|---|---|
| Quadrant | BADHDUFLAG | Total packets | Discarded packets |
| A | 0 | 130 | 0 |
| B | 0 | 130 | 0 |
| C | 0 | 130 | 0 |
| D | 0 | 130 | 0 |
| Mode M0 | |||
|---|---|---|---|
| Quadrant | BADHDUFLAG | Total packets | Discarded packets |
| A | 0 | 13397 | 3 |
| B | 0 | 14257 | 2 |
| C | 0 | 15462 | 2 |
| D | 0 | 15139 | 2 |
| Quadrant | Total seconds | Saturated seconds | Saturation percentage |
|---|---|---|---|
| A | 6363 | 43 | 0.675782% |
| B | 6363 | 72 | 1.131542% |
| C | 6363 | 139 | 2.184504% |
| D | 6363 | 71 | 1.115826% |
Noise dominated data is calculated using 1-second bins in cleaned event files. If a bin has >2000 counts, and if more than 50% of those come from <1% of pixels, then it is considered to be noise-dominated and hence unusable.
| Quadrant | # 1 sec bins | Bins with >0 counts | Bins with >2000 counts | High rate bins dominated by noise | Noise dominated (total time) | Noise dominated (detector-on time) | Marked lightcurve |
|---|---|---|---|---|---|---|---|
| A | 8899 | 6366 | 4 | 4 | 0.04% | 0.06% | 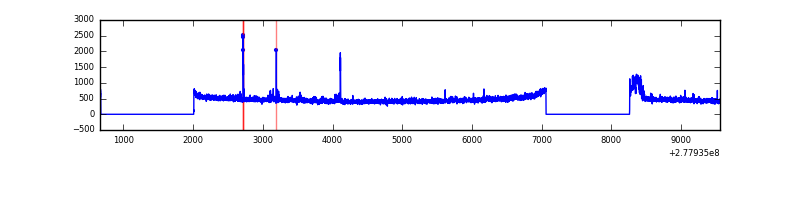 |
| B | 8899 | 6366 | 7 | 7 | 0.08% | 0.11% | 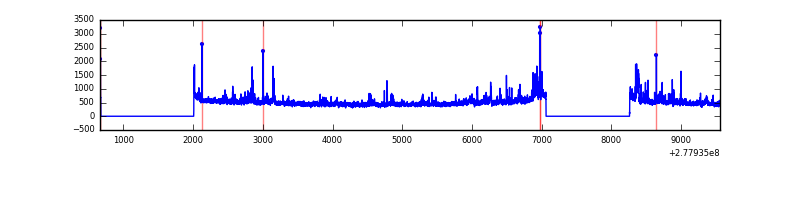 |
| C | 8899 | 6366 | 0 | 0 | 0.00% | 0.00% | 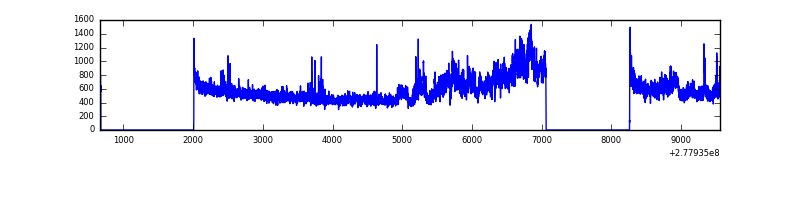 |
| D | 8899 | 6365 | 29 | 29 | 0.33% | 0.46% | 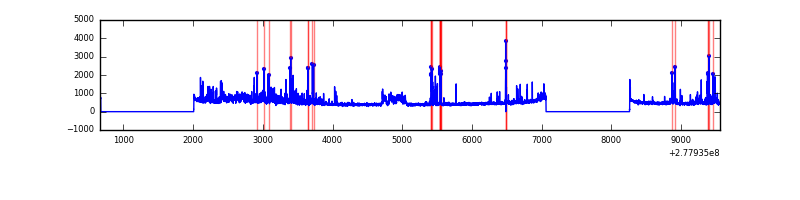 |
Top three noisy pixels from each quadrant. If the there are fewer than three noisy pixels in the level2.evt file, extra rows are filled as -1
| Pixel properties | Quadrant properties | ||||||
|---|---|---|---|---|---|---|---|
| Quadrant | DetID | PixID | Counts | Sigma | Mean | Median | Sigma |
| A | 15 | 174 | 104368 | 693.58 | 758 | 743 | 149.4 |
| A | 9 | 143 | 23561 | 152.72 | 758 | 743 | 149.4 |
| A | 15 | 223 | 7452 | 44.9 | 758 | 743 | 149.4 |
| B | 15 | 35 | 105596 | 737.67 | 763 | 742 | 142.1 |
| B | 0 | 85 | 88221 | 615.43 | 763 | 742 | 142.1 |
| B | 0 | 189 | 63779 | 443.48 | 763 | 742 | 142.1 |
| C | 3 | 233 | 744934 | 4357.89 | 741 | 744 | 170.8 |
| C | 14 | 238 | 114501 | 666.15 | 741 | 744 | 170.8 |
| C | 7 | 247 | 6810 | 35.52 | 741 | 744 | 170.8 |
| D | 5 | 222 | 372938 | 2070.28 | 743 | 721 | 179.8 |
| D | 1 | 52 | 147505 | 816.42 | 743 | 721 | 179.8 |
| D | 10 | 70 | 104027 | 574.59 | 743 | 721 | 179.8 |
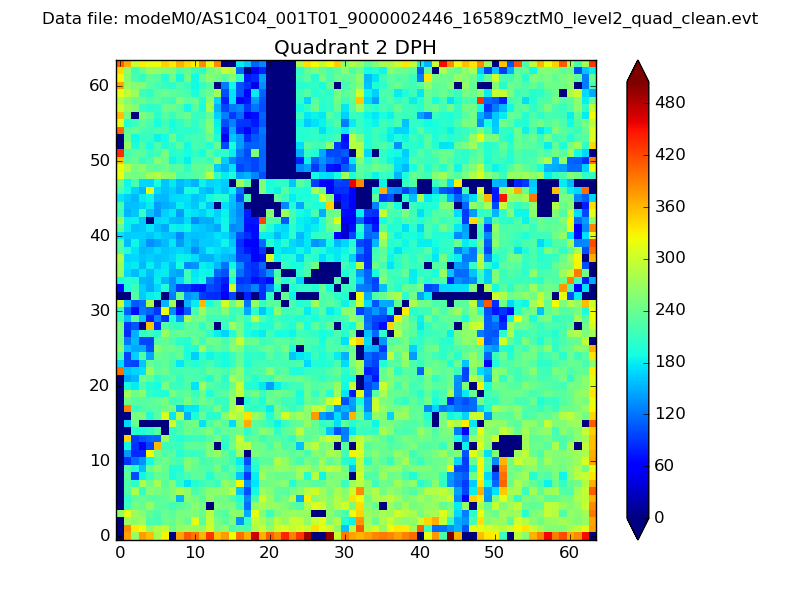
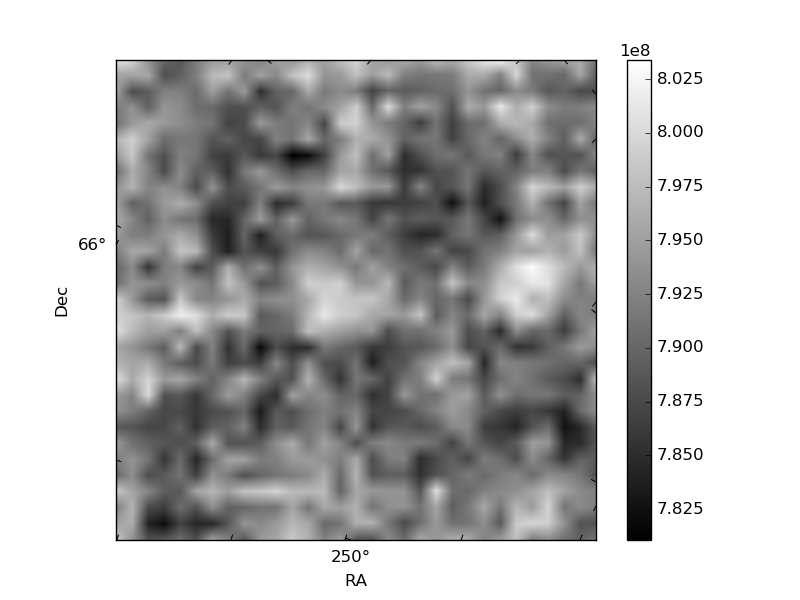
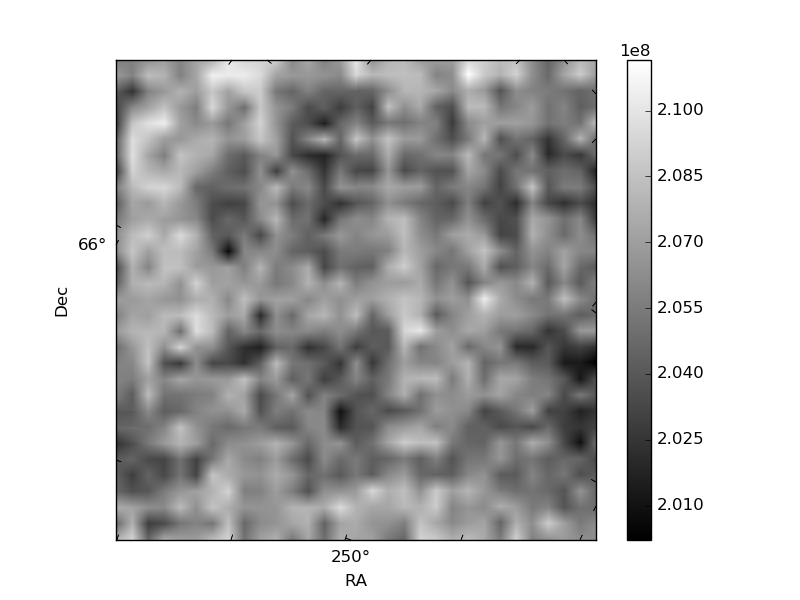
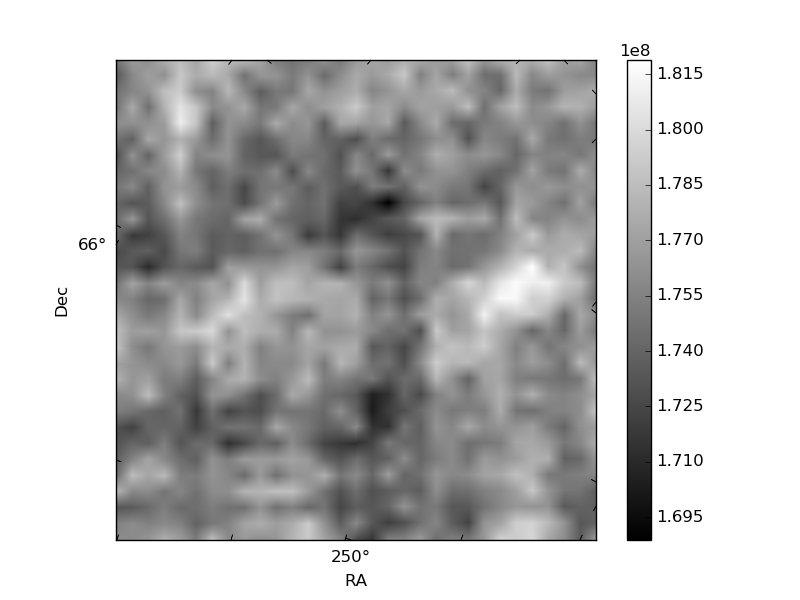
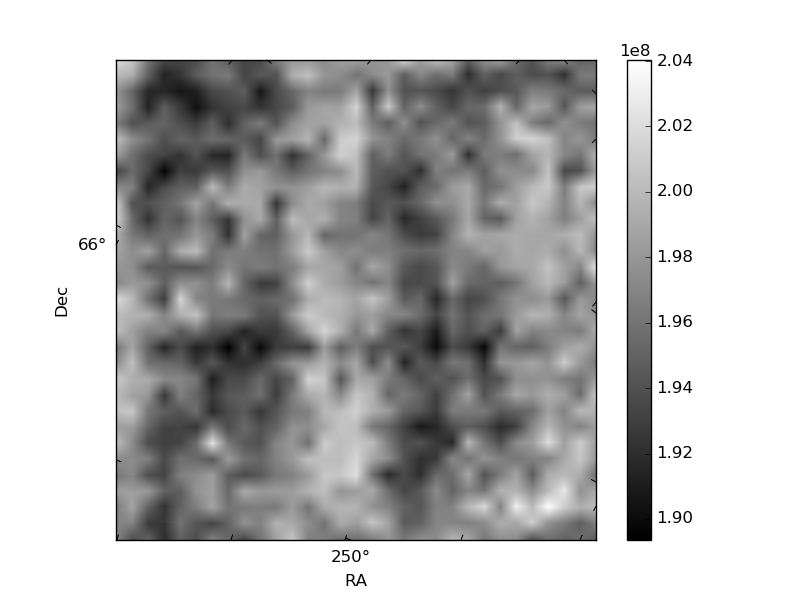
Histogram calculated using DETX and DETY for each event in the final _common_clean file
| Quadrant A | 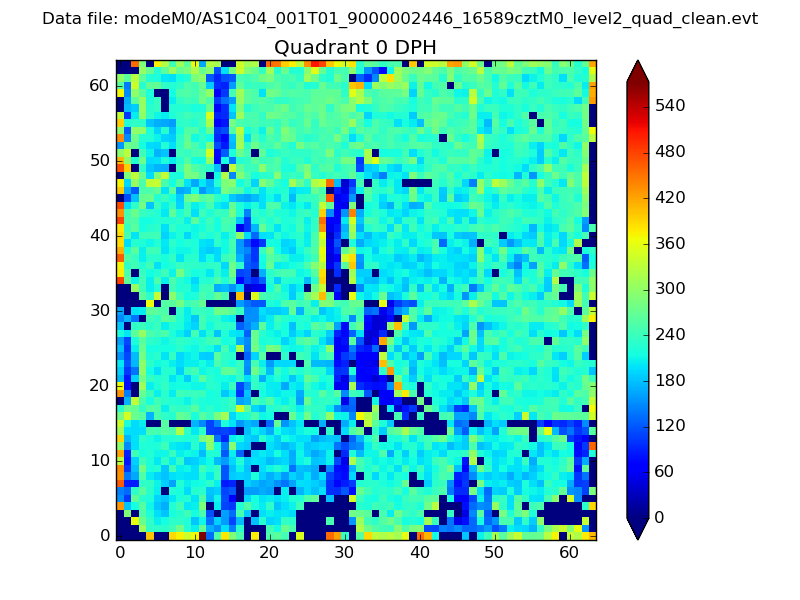 |
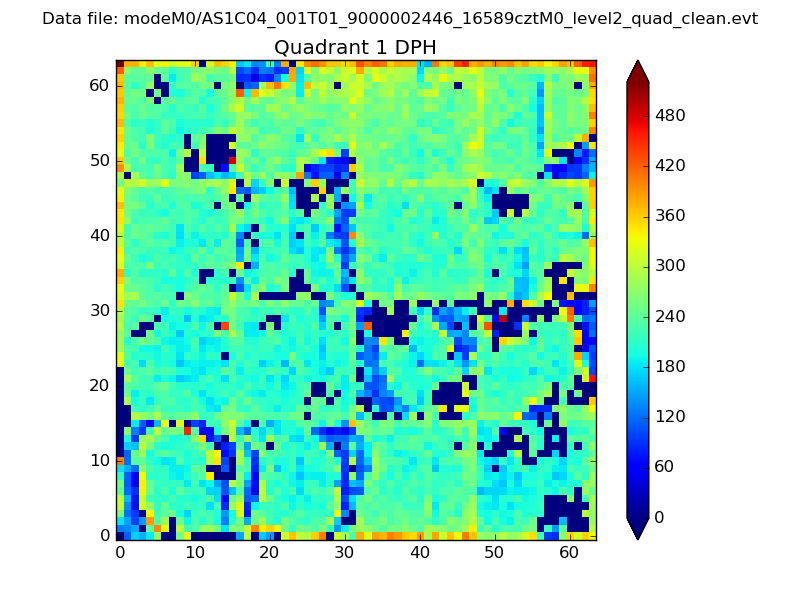 |
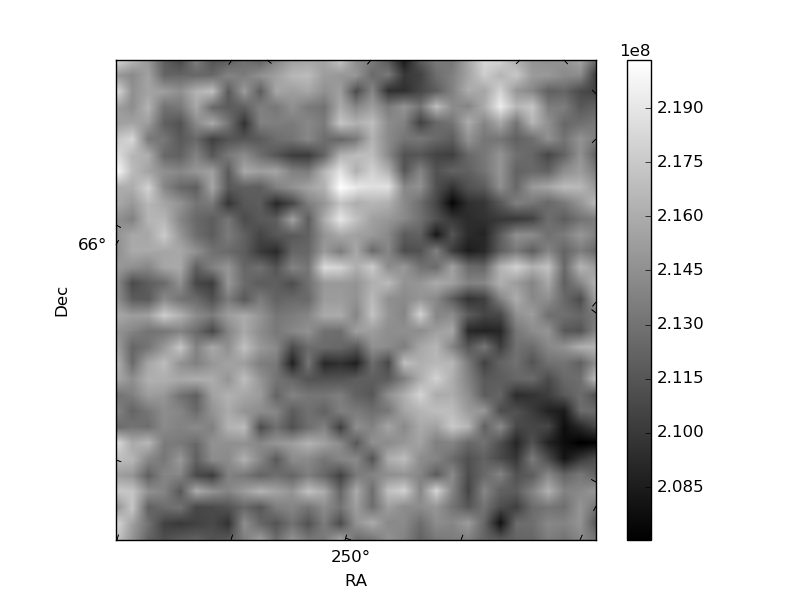
Quadrant B |
|---|---|---|---|
| Quadrant D | 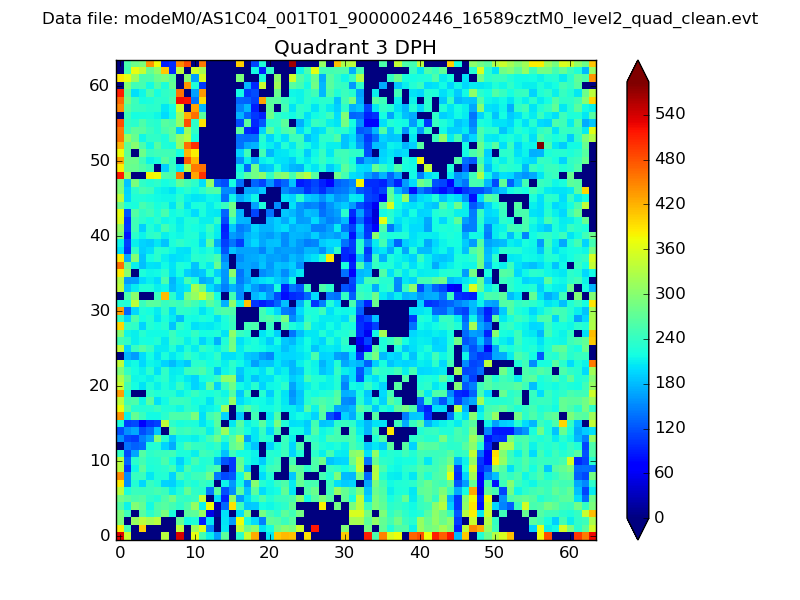 |
 |
Quadrant C |
| Plot type | Count rate plots | Images |
|---|---|---|
| Comparison with Poisson distribution Blue bars denote a histogram of data divided into 1 sec bins. Red curve is a Poisson curve with rate = median count rate of data. |
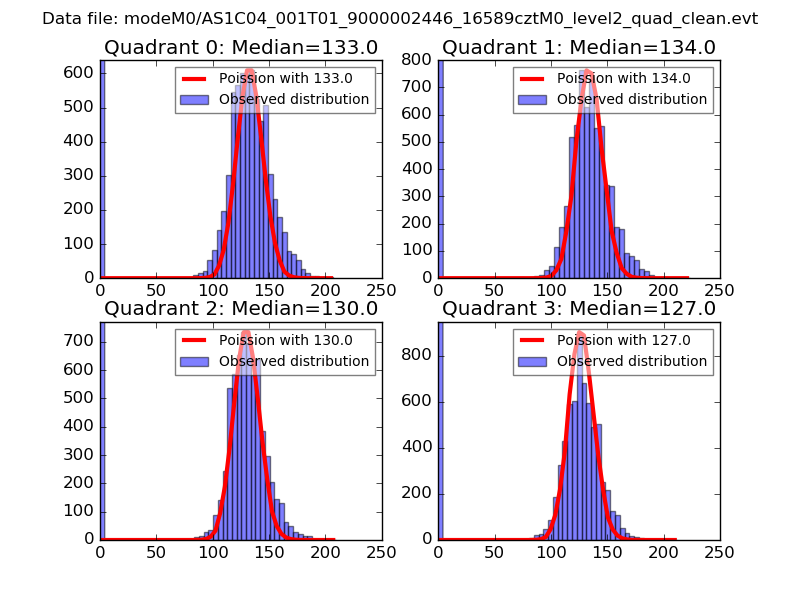 |
 |
| Quadrant-wise count rates Data is divided into 100 sec bins |
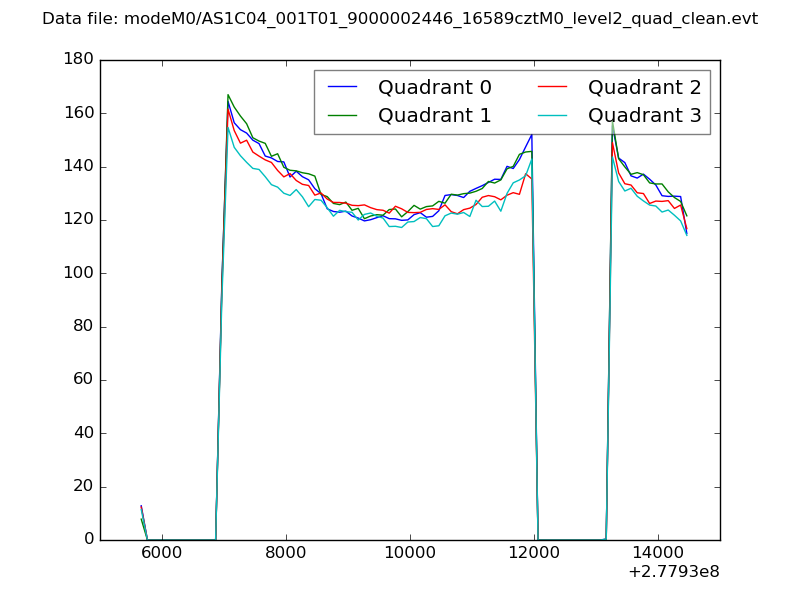 |
|
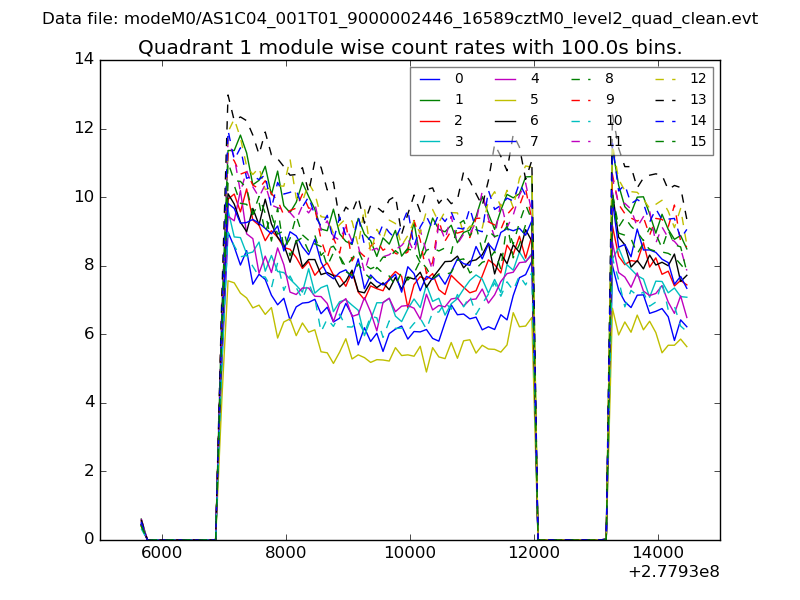
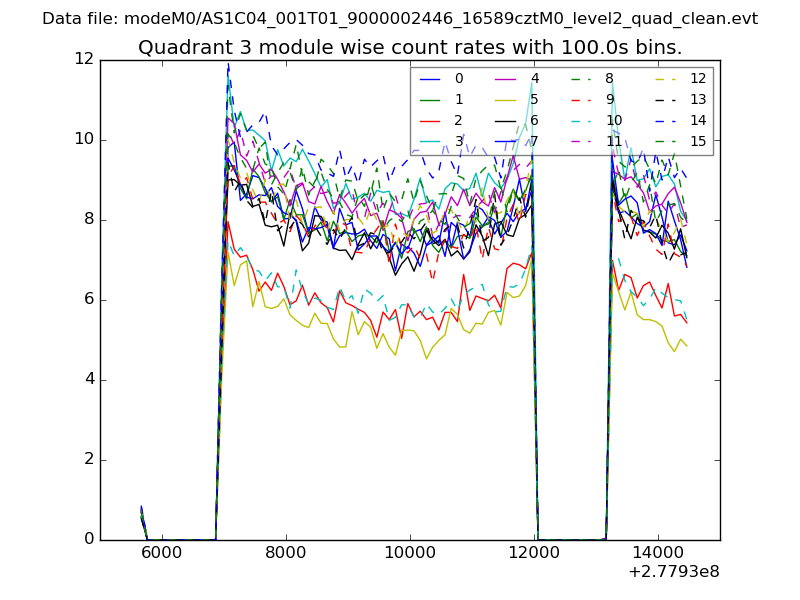
| Module-wise count rates for Quadrant A Data is divided into 100 sec bins |
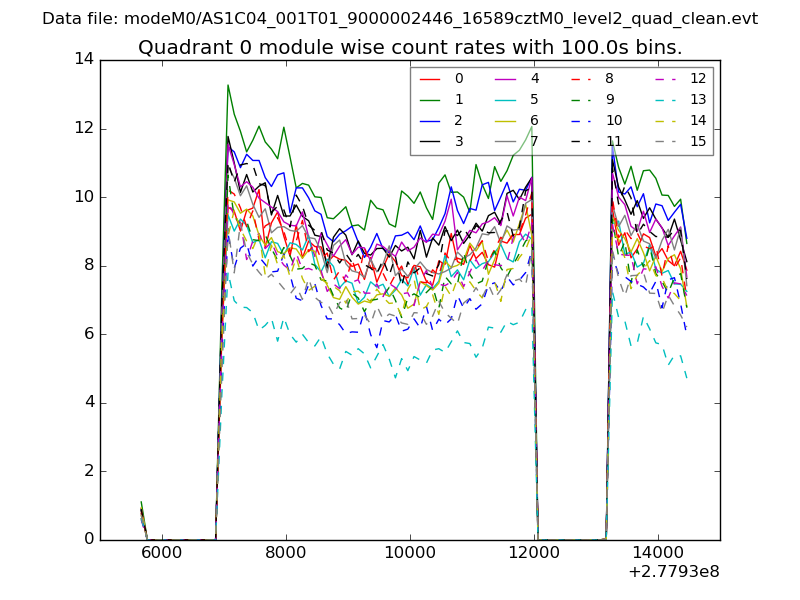 |
 |
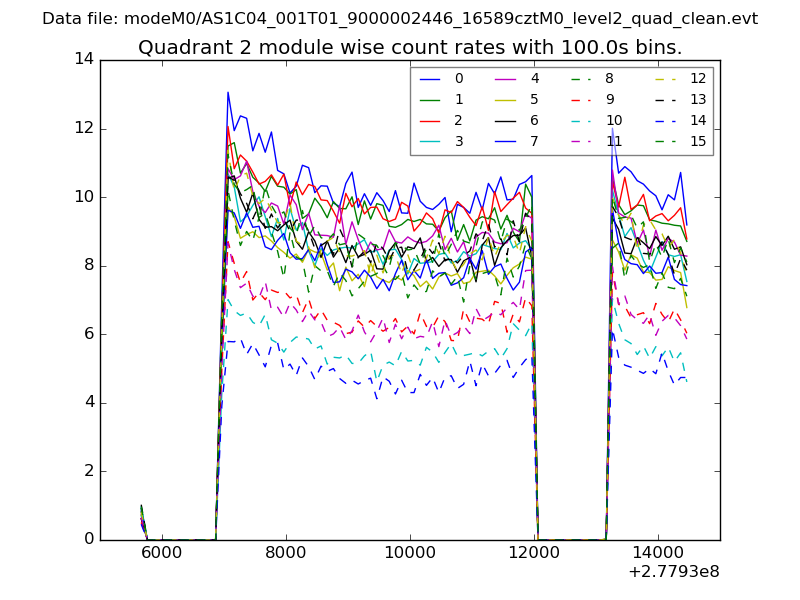
| Module-wise count rates for Quadrant B Data is divided into 100 sec bins |
 |
 |
| Module-wise count rates for Quadrant C Data is divided into 100 sec bins |
 |
 |
| Module-wise count rates for Quadrant D Data is divided into 100 sec bins |
 |
 |
| Parameter | Plot |
|---|---|
| CZT HV Monitor | 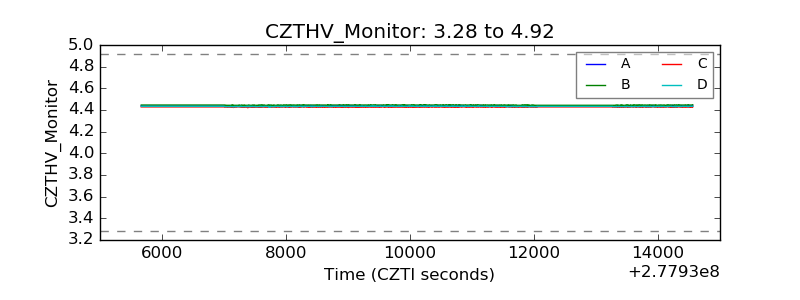 |
| D_VDD | 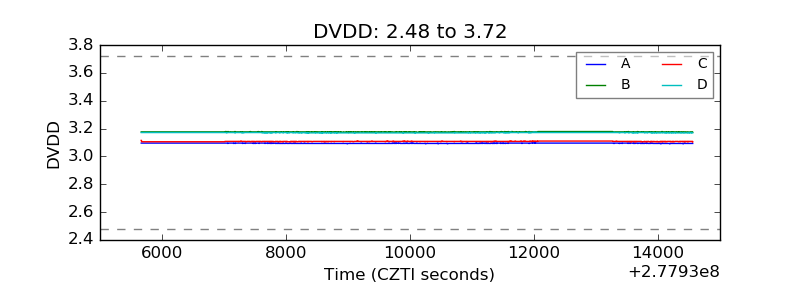 |
| Temperature 1 | 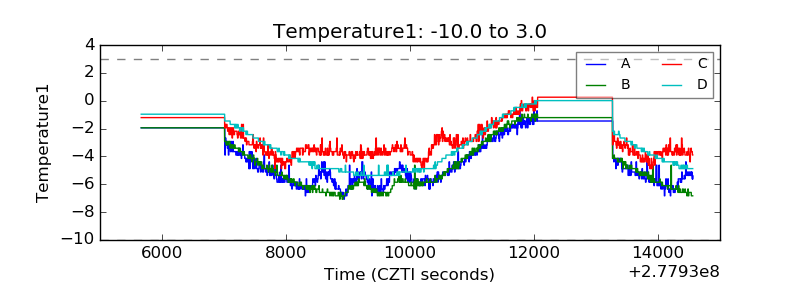 |
| Veto HV Monitor | 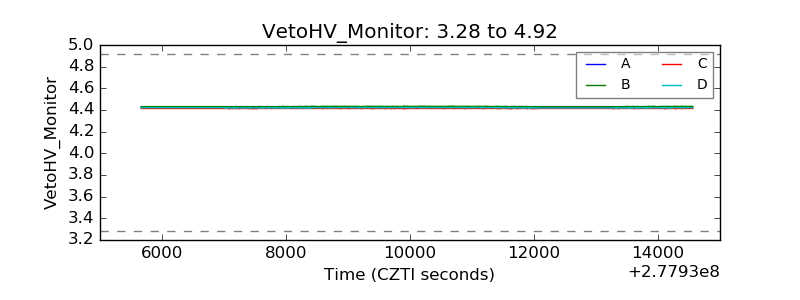 |
| Veto LLD | 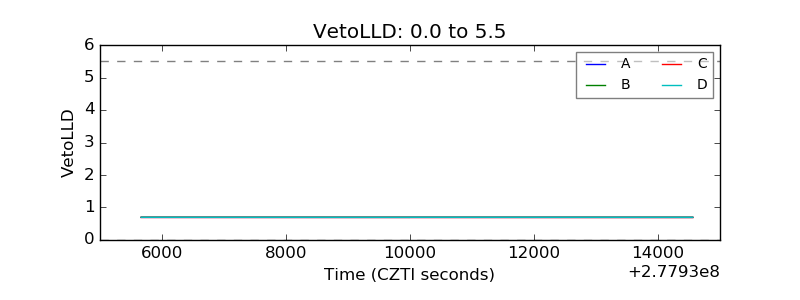 |
| Alpha Counter | 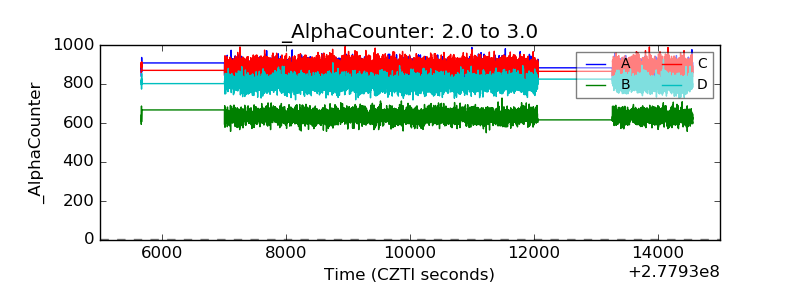 |
| _CPM_Rate | 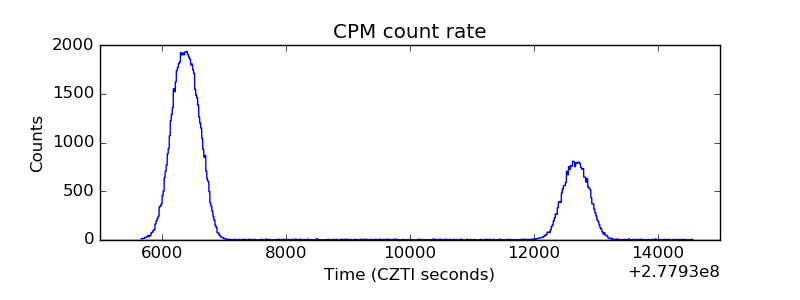 |
| CZT Counter |  |
| +2.5 Volts monitor |  |
| +5 Volts monitor | 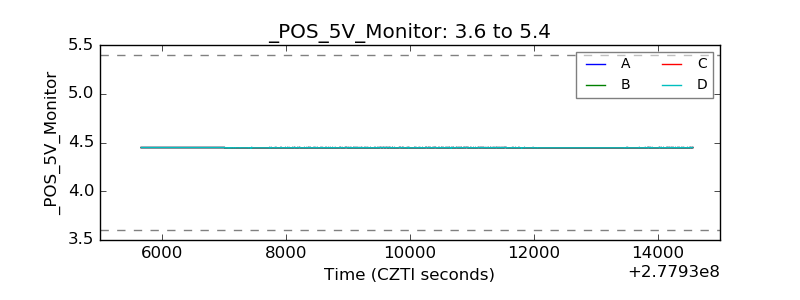 |
| _ROLL_ROT | 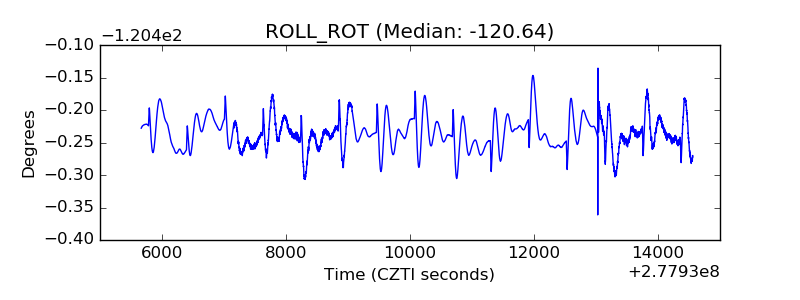 |
| _Roll_DEC | 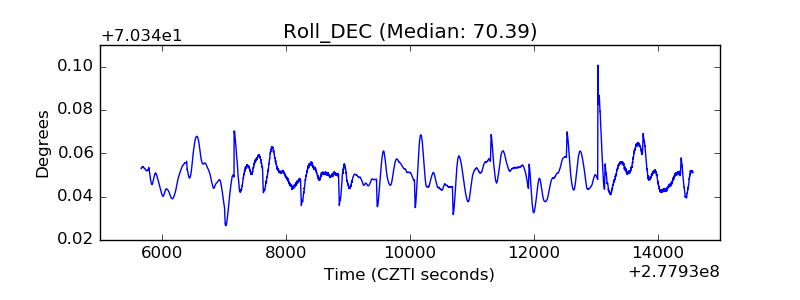 |
| _Roll_RA |  |
| Veto Counter | 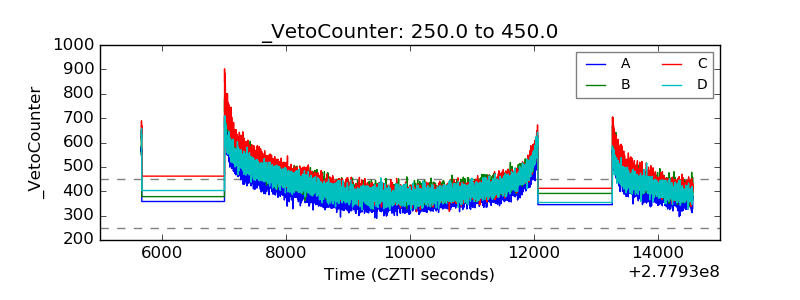 |