| Param | Original file | Final file |
|---|---|---|
| Filename | modeM0/AS1C04_001T01_9000002446_16590cztM0_level2.evt | modeM0/AS1C04_001T01_9000002446_16590cztM0_level2_quad_clean.evt |
| Size (bytes) | 495,576,000 | 131,546,880 |
| Size | 472.6 MB | 125.5 MB |
| Events in quadrant A | 3,369,826 | 885,429 |
| Events in quadrant B | 3,741,335 | 890,929 |
| Events in quadrant C | 4,048,854 | 866,863 |
| Events in quadrant D | 3,371,780 | 852,056 |
| Mode M9 | |||
|---|---|---|---|
| Quadrant | BADHDUFLAG | Total packets | Discarded packets |
| A | 0 | 17 | 0 |
| B | 0 | 17 | 0 |
| C | 0 | 17 | 0 |
| D | 0 | 18 | 0 |
| Mode SS | |||
|---|---|---|---|
| Quadrant | BADHDUFLAG | Total packets | Discarded packets |
| A | 0 | 144 | 0 |
| B | 0 | 144 | 0 |
| C | 0 | 144 | 0 |
| D | 0 | 144 | 0 |
| Mode M0 | |||
|---|---|---|---|
| Quadrant | BADHDUFLAG | Total packets | Discarded packets |
| A | 0 | 14868 | 3 |
| B | 0 | 15803 | 2 |
| C | 0 | 16694 | 2 |
| D | 0 | 15124 | 2 |
| Quadrant | Total seconds | Saturated seconds | Saturation percentage |
|---|---|---|---|
| A | 7017 | 48 | 0.684053% |
| B | 7017 | 122 | 1.738635% |
| C | 7017 | 98 | 1.396608% |
| D | 7017 | 43 | 0.612797% |
Noise dominated data is calculated using 1-second bins in cleaned event files. If a bin has >2000 counts, and if more than 50% of those come from <1% of pixels, then it is considered to be noise-dominated and hence unusable.
| Quadrant | # 1 sec bins | Bins with >0 counts | Bins with >2000 counts | High rate bins dominated by noise | Noise dominated (total time) | Noise dominated (detector-on time) | Marked lightcurve |
|---|---|---|---|---|---|---|---|
| A | 7868 | 7019 | 5 | 5 | 0.06% | 0.07% | 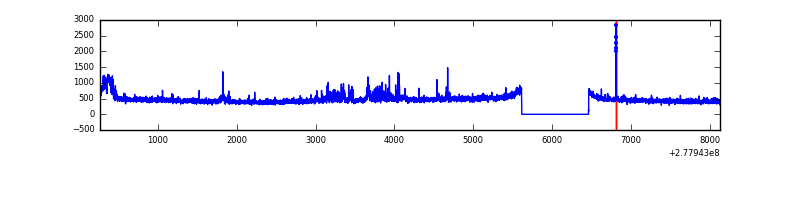 |
| B | 7868 | 7019 | 14 | 14 | 0.18% | 0.20% | 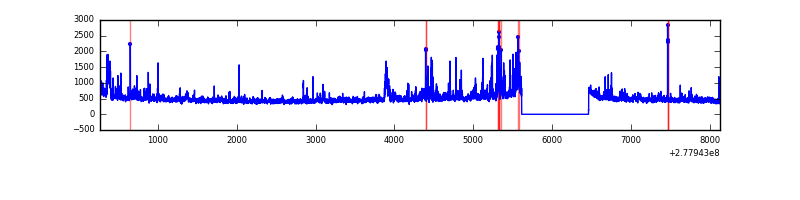 |
| C | 7868 | 7019 | 0 | 0 | 0.00% | 0.00% | 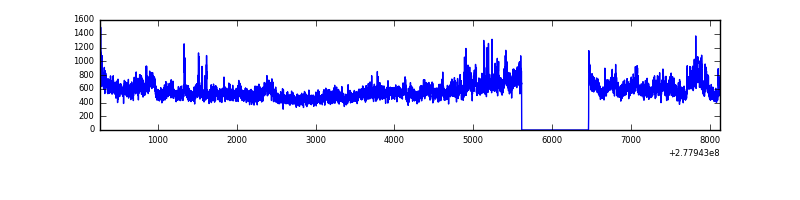 |
| D | 7868 | 7019 | 23 | 23 | 0.29% | 0.33% | 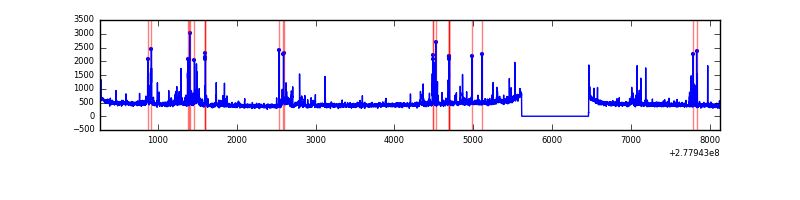 |
Top three noisy pixels from each quadrant. If the there are fewer than three noisy pixels in the level2.evt file, extra rows are filled as -1
| Pixel properties | Quadrant properties | ||||||
|---|---|---|---|---|---|---|---|
| Quadrant | DetID | PixID | Counts | Sigma | Mean | Median | Sigma |
| A | 15 | 174 | 224176 | 1394.02 | 810 | 792 | 160.2 |
| A | 9 | 143 | 20894 | 125.45 | 810 | 792 | 160.2 |
| A | 0 | 226 | 7029 | 38.92 | 810 | 792 | 160.2 |
| B | 15 | 35 | 171758 | 1130.65 | 812 | 791 | 151.2 |
| B | 7 | 220 | 86832 | 569.01 | 812 | 791 | 151.2 |
| B | 0 | 189 | 54112 | 352.63 | 812 | 791 | 151.2 |
| C | 3 | 233 | 849376 | 4649.63 | 786 | 789 | 182.5 |
| C | 14 | 238 | 121754 | 662.8 | 786 | 789 | 182.5 |
| C | 7 | 247 | 13779 | 71.18 | 786 | 789 | 182.5 |
| D | 5 | 222 | 150599 | 788.43 | 790 | 767 | 190.0 |
| D | 1 | 52 | 70834 | 368.7 | 790 | 767 | 190.0 |
| D | 10 | 70 | 51516 | 267.05 | 790 | 767 | 190.0 |
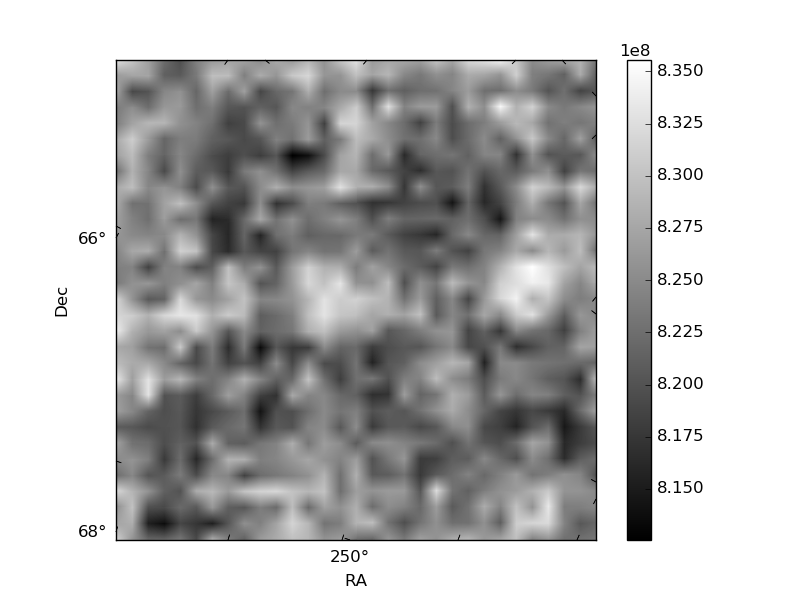
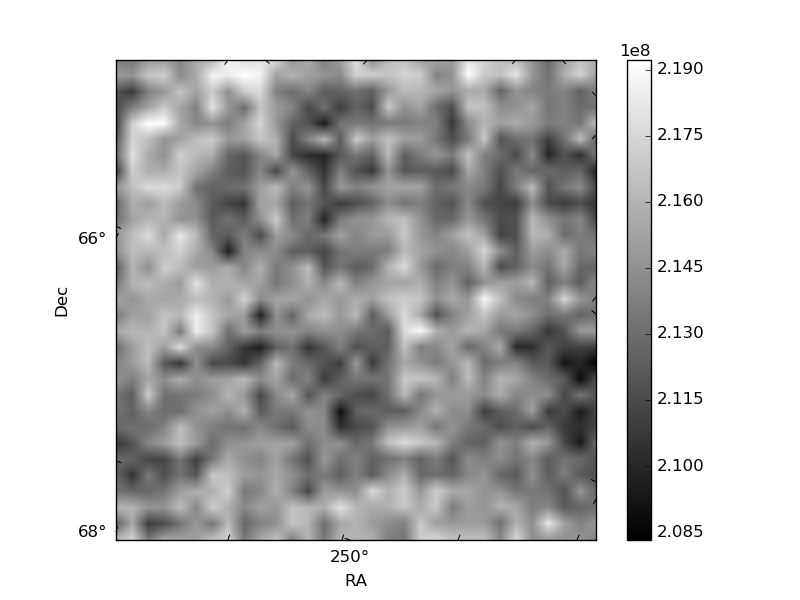
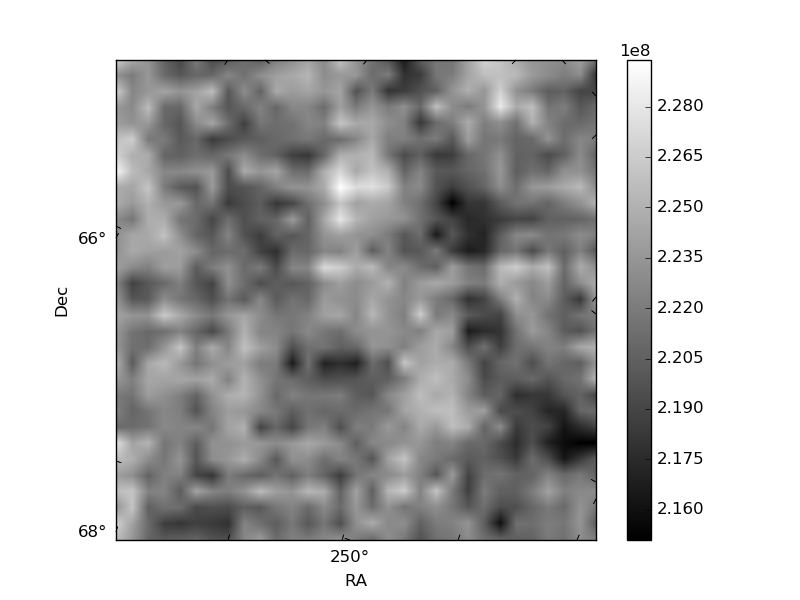
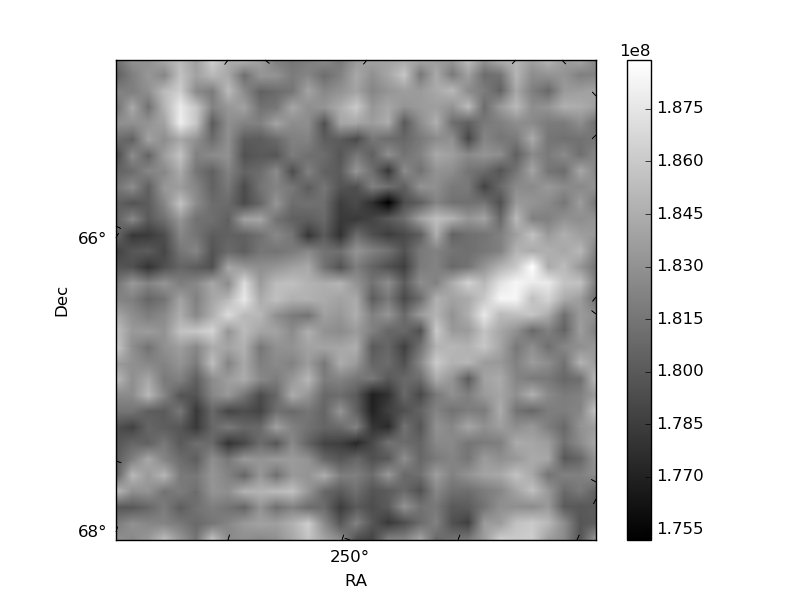
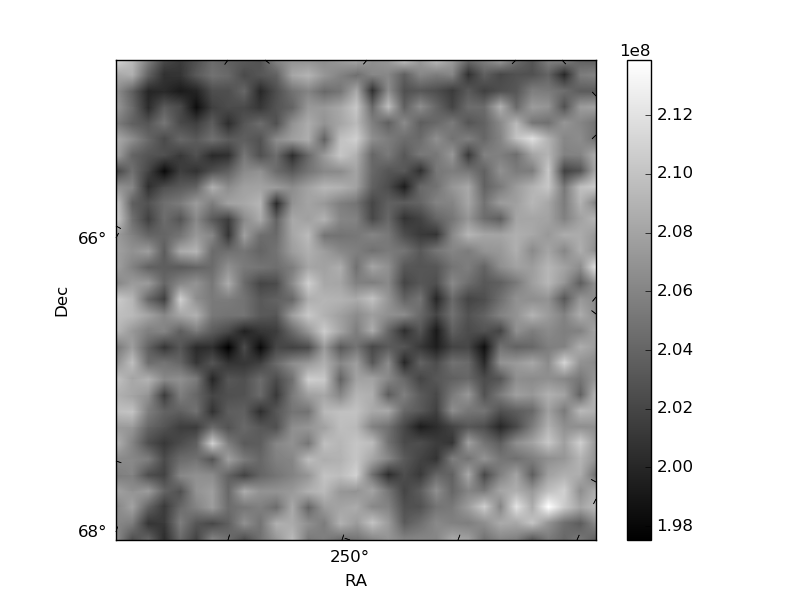
Histogram calculated using DETX and DETY for each event in the final _common_clean file
| Quadrant A | 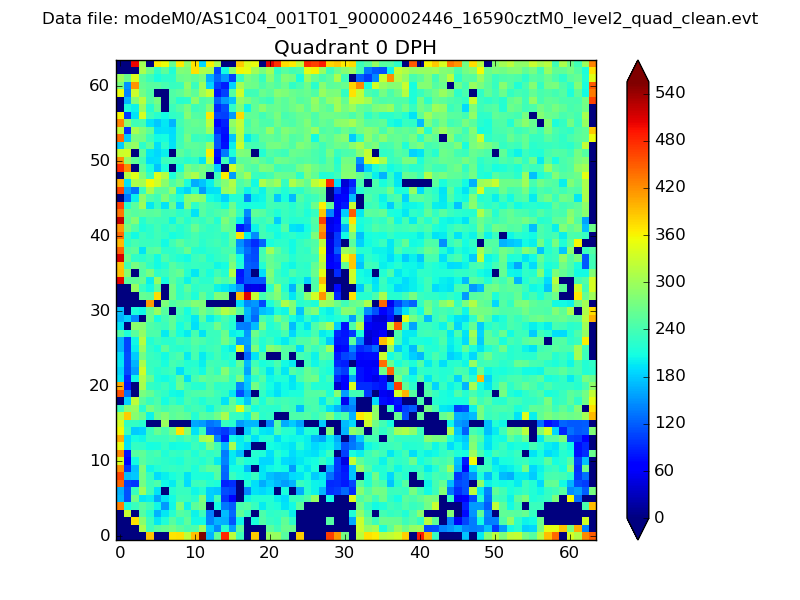 |
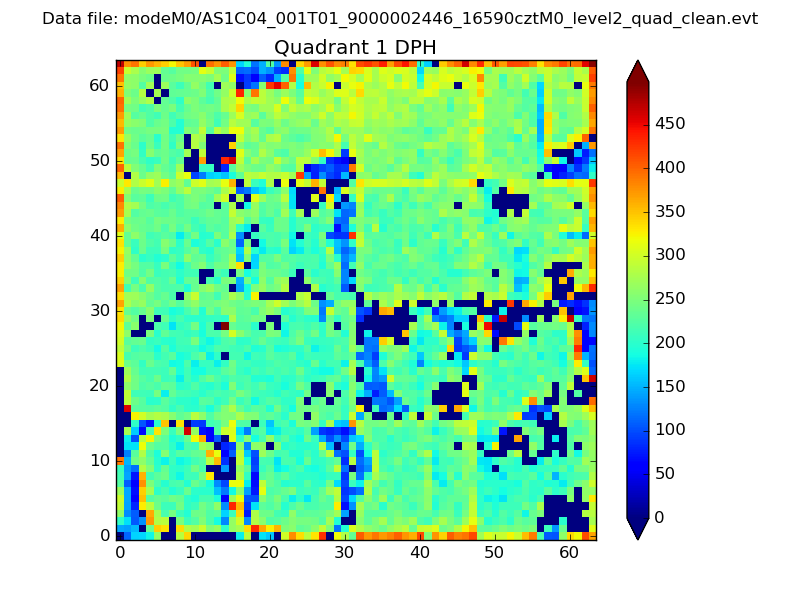 |
Quadrant B |
|---|---|---|---|
| Quadrant D | 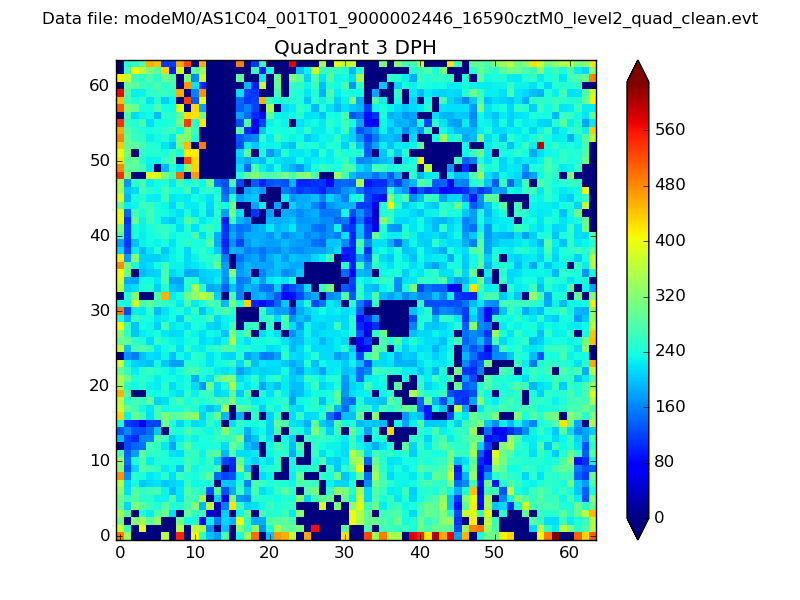 |
 |
Quadrant C |
| Plot type | Count rate plots | Images |
|---|---|---|
| Comparison with Poisson distribution Blue bars denote a histogram of data divided into 1 sec bins. Red curve is a Poisson curve with rate = median count rate of data. |
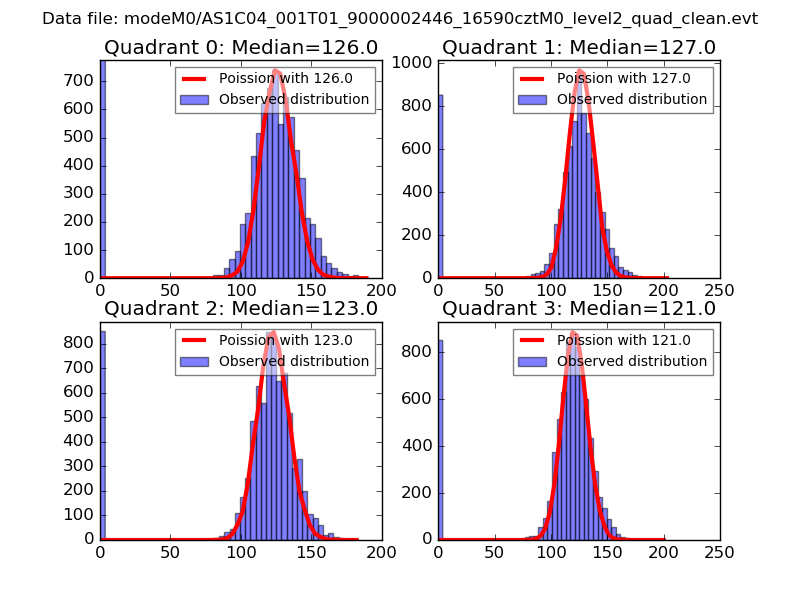 |
 |
| Quadrant-wise count rates Data is divided into 100 sec bins |
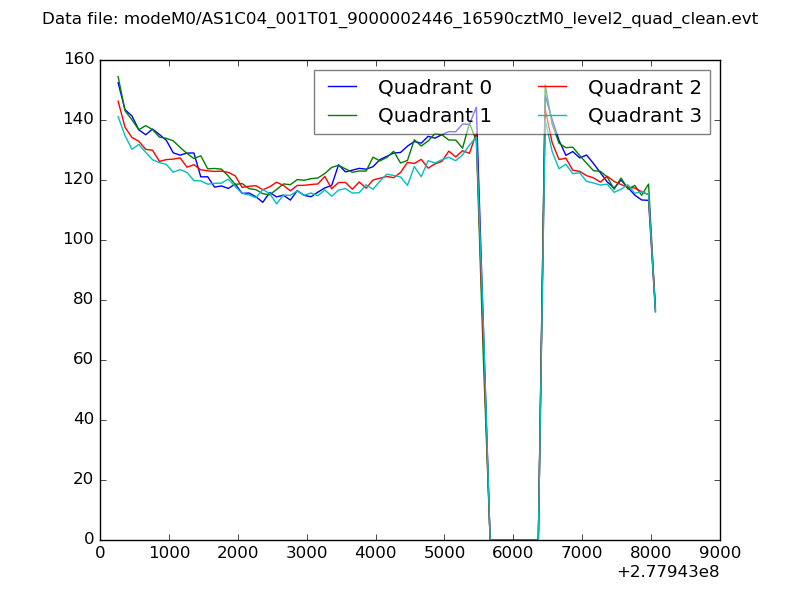 |
|
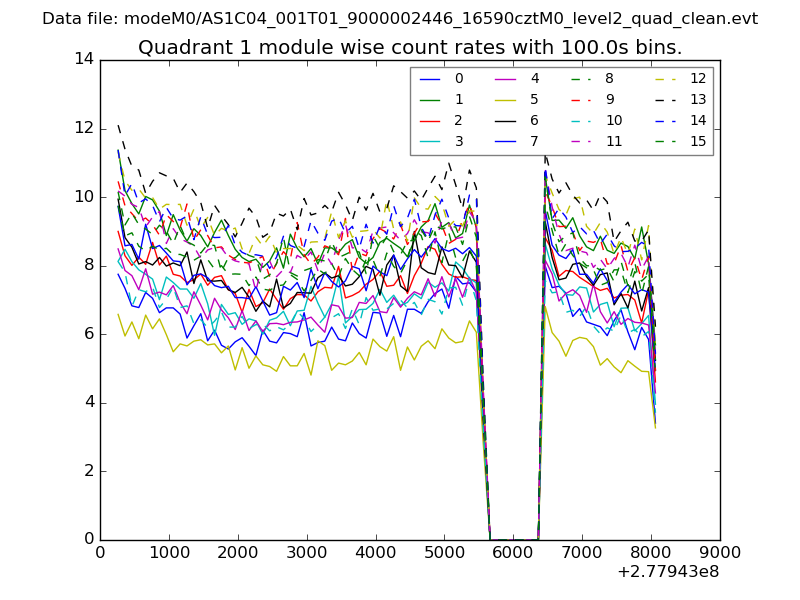
| Module-wise count rates for Quadrant A Data is divided into 100 sec bins |
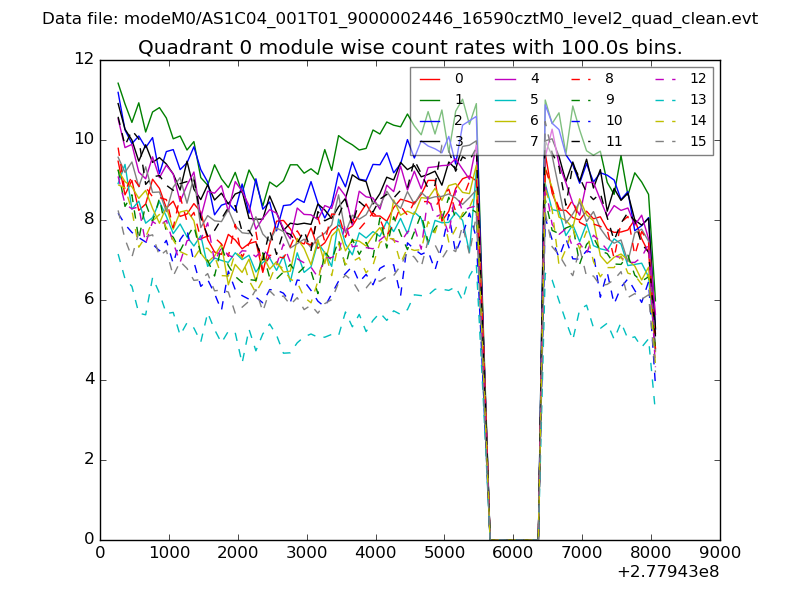 |
 |
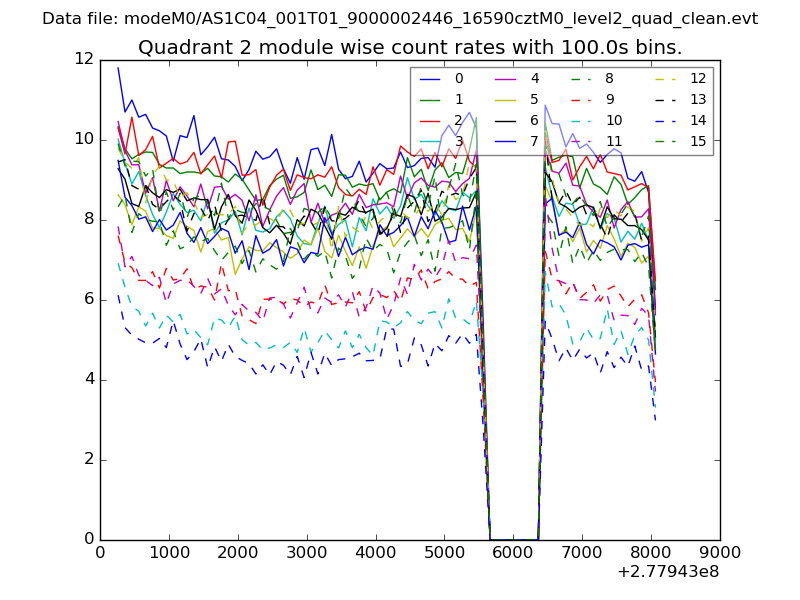
| Module-wise count rates for Quadrant B Data is divided into 100 sec bins |
 |
 |
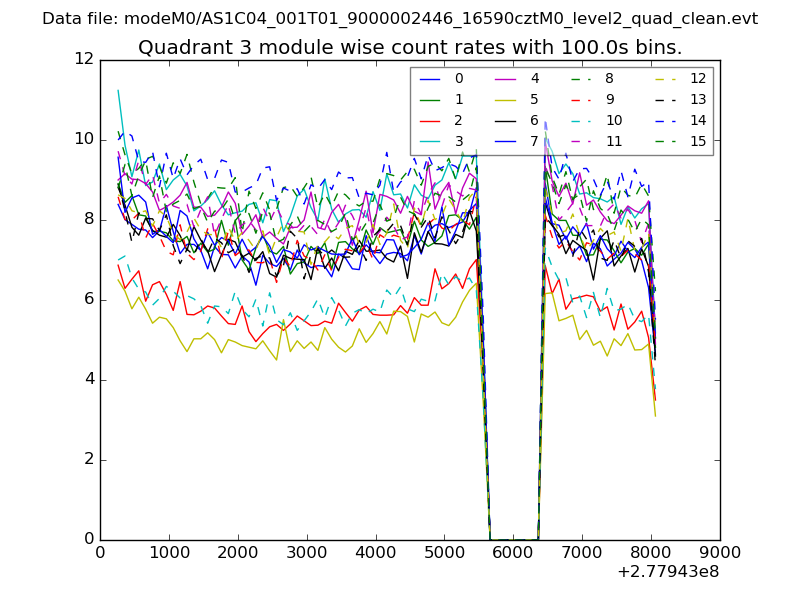
| Module-wise count rates for Quadrant C Data is divided into 100 sec bins |
 |
 |
| Module-wise count rates for Quadrant D Data is divided into 100 sec bins |
 |
 |
| Parameter | Plot |
|---|---|
| CZT HV Monitor | 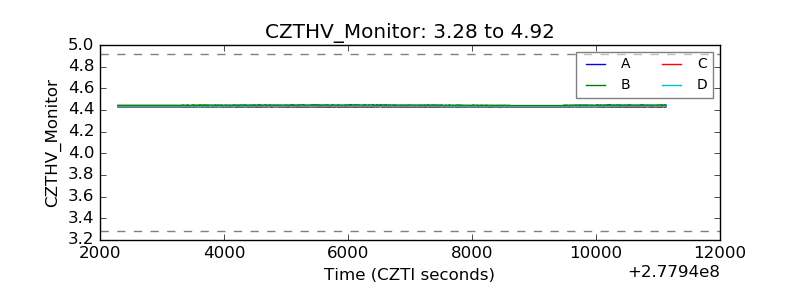 |
| D_VDD |  |
| Temperature 1 | 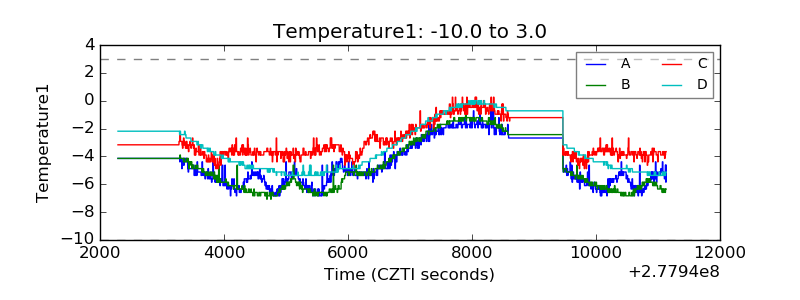 |
| Veto HV Monitor | 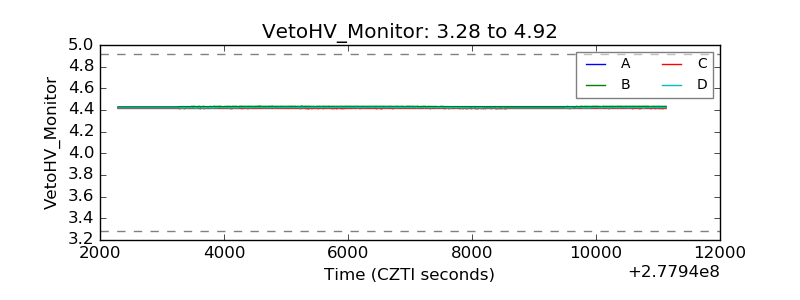 |
| Veto LLD | 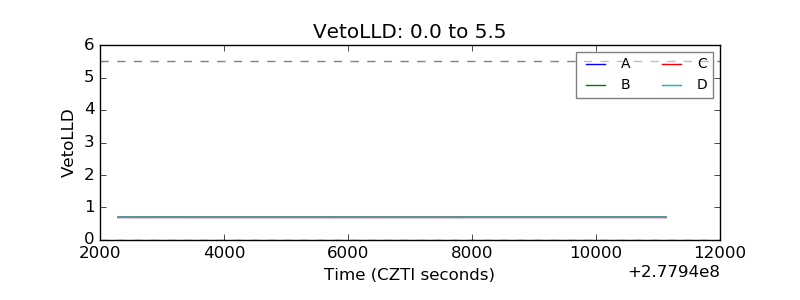 |
| Alpha Counter | 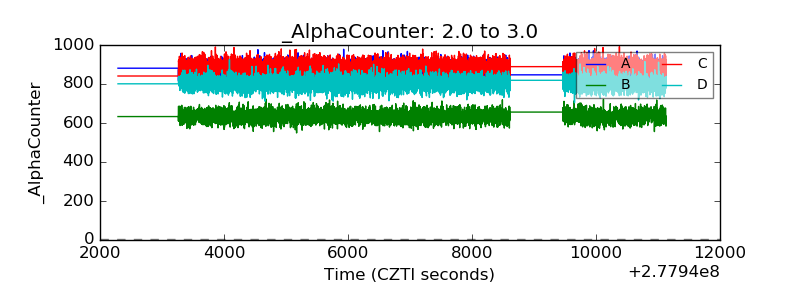 |
| _CPM_Rate | 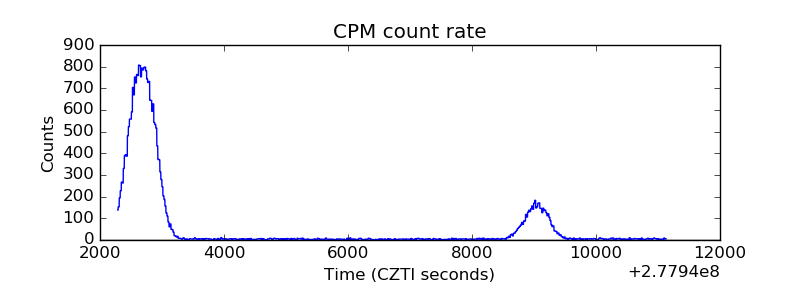 |
| CZT Counter | 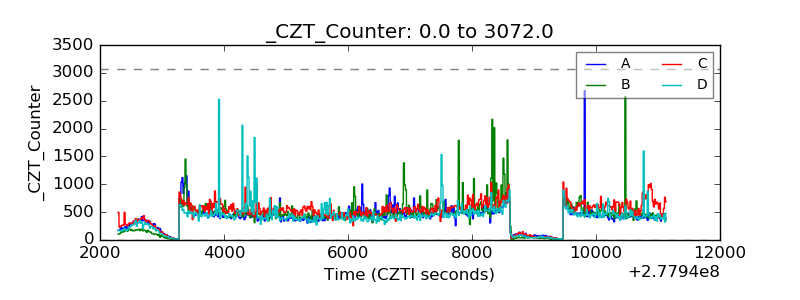 |
| +2.5 Volts monitor | 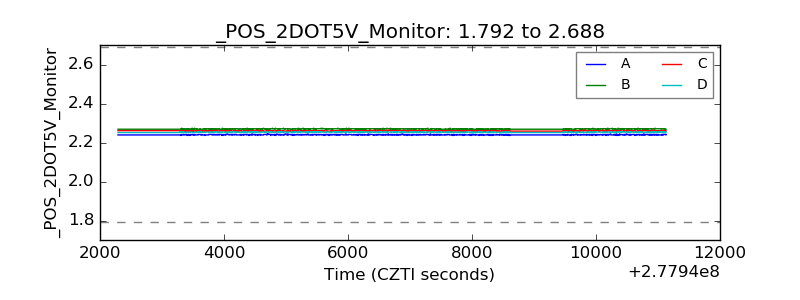 |
| +5 Volts monitor | 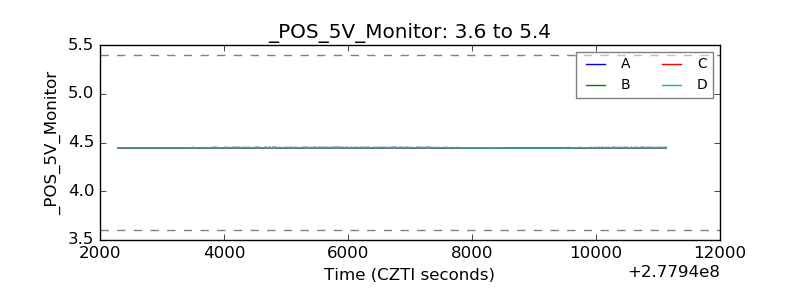 |
| _ROLL_ROT | 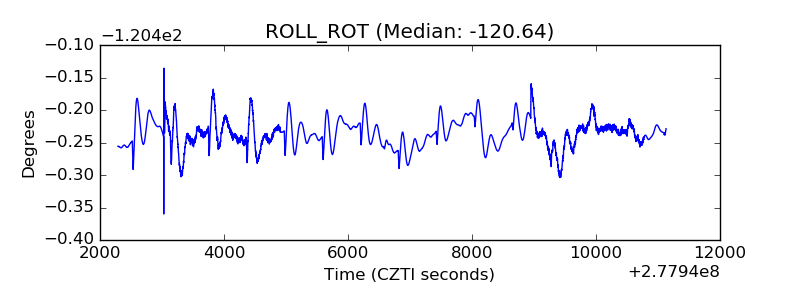 |
| _Roll_DEC | 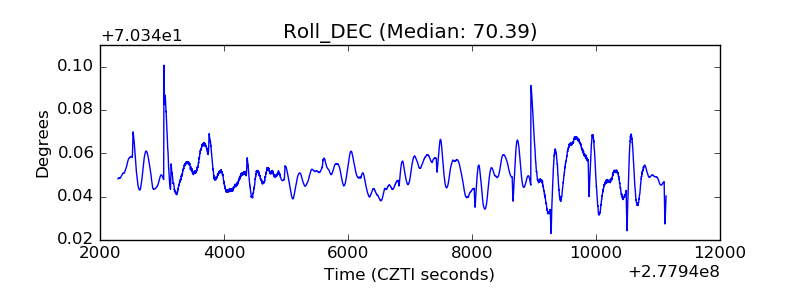 |
| _Roll_RA | 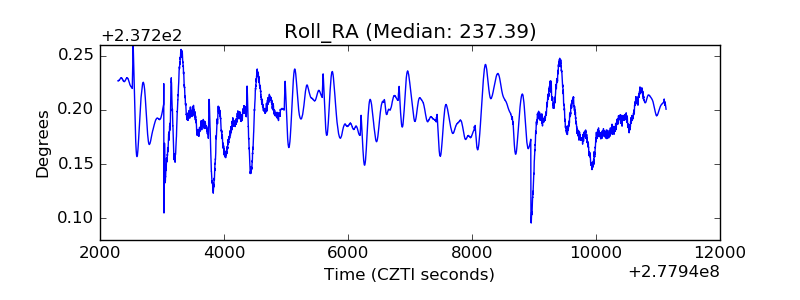 |
| Veto Counter | 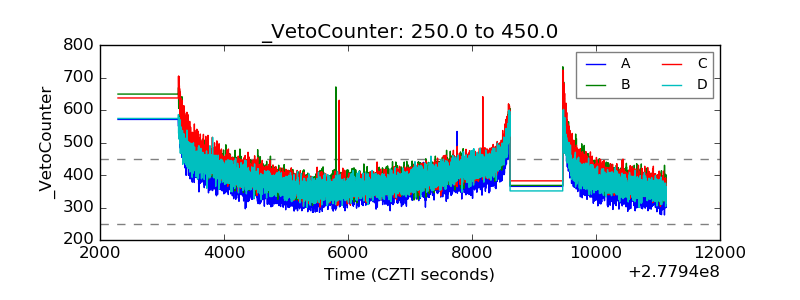 |