| Param | Original file | Final file |
|---|---|---|
| Filename | modeM0/AS1C04_001T01_9000002446_16592cztM0_level2.evt | modeM0/AS1C04_001T01_9000002446_16592cztM0_level2_quad_clean.evt |
| Size (bytes) | 530,775,360 | 136,419,840 |
| Size | 506.2 MB | 130.1 MB |
| Events in quadrant A | 3,605,202 | 914,625 |
| Events in quadrant B | 3,953,197 | 924,795 |
| Events in quadrant C | 4,306,796 | 889,958 |
| Events in quadrant D | 3,698,761 | 879,171 |
| Mode SS | |||
|---|---|---|---|
| Quadrant | BADHDUFLAG | Total packets | Discarded packets |
| A | 0 | 150 | 0 |
| B | 0 | 150 | 0 |
| C | 0 | 150 | 0 |
| D | 0 | 150 | 0 |
| Mode M0 | |||
|---|---|---|---|
| Quadrant | BADHDUFLAG | Total packets | Discarded packets |
| A | 0 | 15991 | 1 |
| B | 0 | 16756 | 0 |
| C | 0 | 17983 | 0 |
| D | 0 | 16669 | 0 |
| Quadrant | Total seconds | Saturated seconds | Saturation percentage |
|---|---|---|---|
| A | 7521 | 112 | 1.489164% |
| B | 7521 | 185 | 2.459779% |
| C | 7521 | 135 | 1.794974% |
| D | 7521 | 155 | 2.060896% |
Noise dominated data is calculated using 1-second bins in cleaned event files. If a bin has >2000 counts, and if more than 50% of those come from <1% of pixels, then it is considered to be noise-dominated and hence unusable.
| Quadrant | # 1 sec bins | Bins with >0 counts | Bins with >2000 counts | High rate bins dominated by noise | Noise dominated (total time) | Noise dominated (detector-on time) | Marked lightcurve |
|---|---|---|---|---|---|---|---|
| A | 7522 | 7522 | 4 | 4 | 0.05% | 0.05% | 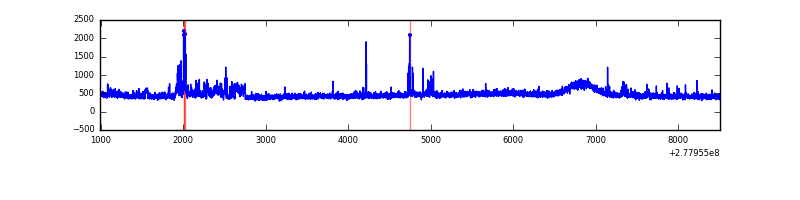 |
| B | 7522 | 7522 | 17 | 17 | 0.23% | 0.23% | 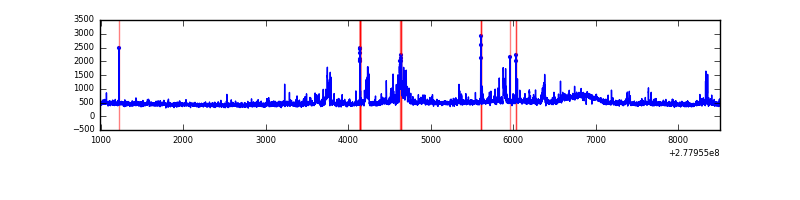 |
| C | 7522 | 7522 | 11 | 11 | 0.15% | 0.15% | 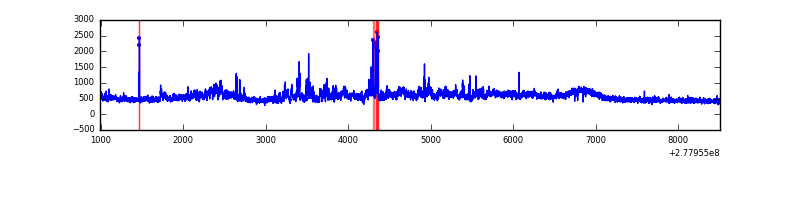 |
| D | 7522 | 7522 | 95 | 95 | 1.26% | 1.26% | 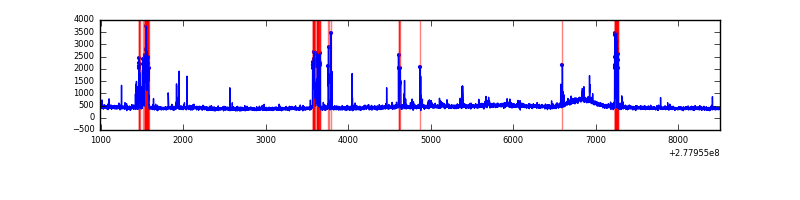 |
Top three noisy pixels from each quadrant. If the there are fewer than three noisy pixels in the level2.evt file, extra rows are filled as -1
| Pixel properties | Quadrant properties | ||||||
|---|---|---|---|---|---|---|---|
| Quadrant | DetID | PixID | Counts | Sigma | Mean | Median | Sigma |
| A | 15 | 174 | 216659 | 1227.96 | 872 | 853 | 175.7 |
| A | 9 | 143 | 24325 | 133.56 | 872 | 853 | 175.7 |
| A | 15 | 223 | 10306 | 53.79 | 872 | 853 | 175.7 |
| B | 15 | 35 | 163656 | 982.86 | 874 | 850 | 165.6 |
| B | 0 | 85 | 118811 | 712.13 | 874 | 850 | 165.6 |
| B | 0 | 189 | 51379 | 305.04 | 874 | 850 | 165.6 |
| C | 3 | 233 | 875239 | 4474.89 | 838 | 841 | 195.4 |
| C | 14 | 238 | 128540 | 653.52 | 838 | 841 | 195.4 |
| C | 8 | 128 | 14081 | 67.76 | 838 | 841 | 195.4 |
| D | 10 | 70 | 287728 | 1396.53 | 846 | 818 | 205.4 |
| D | 2 | 14 | 128026 | 619.18 | 846 | 818 | 205.4 |
| D | 2 | 33 | 34005 | 161.54 | 846 | 818 | 205.4 |
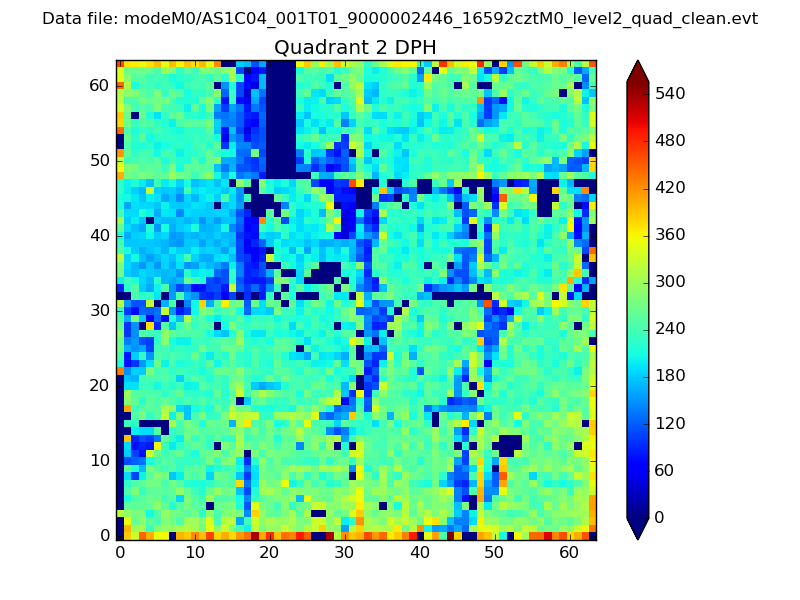
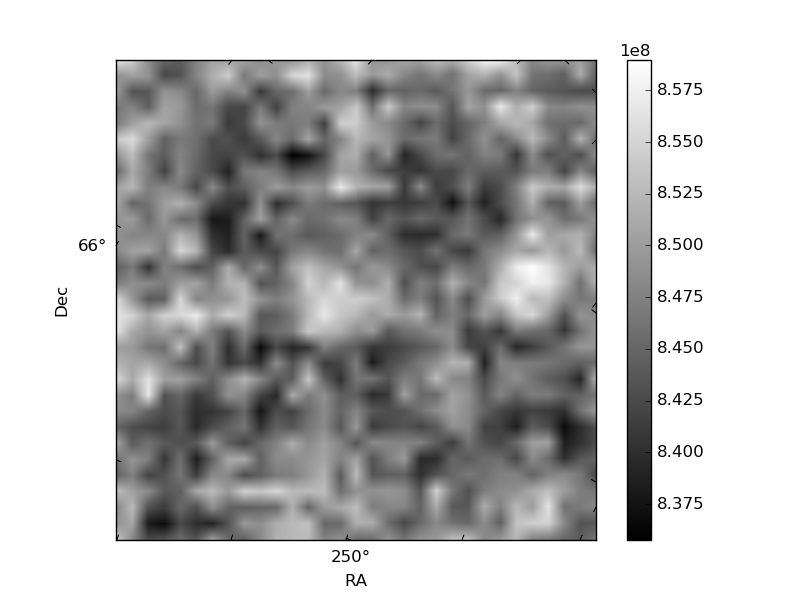
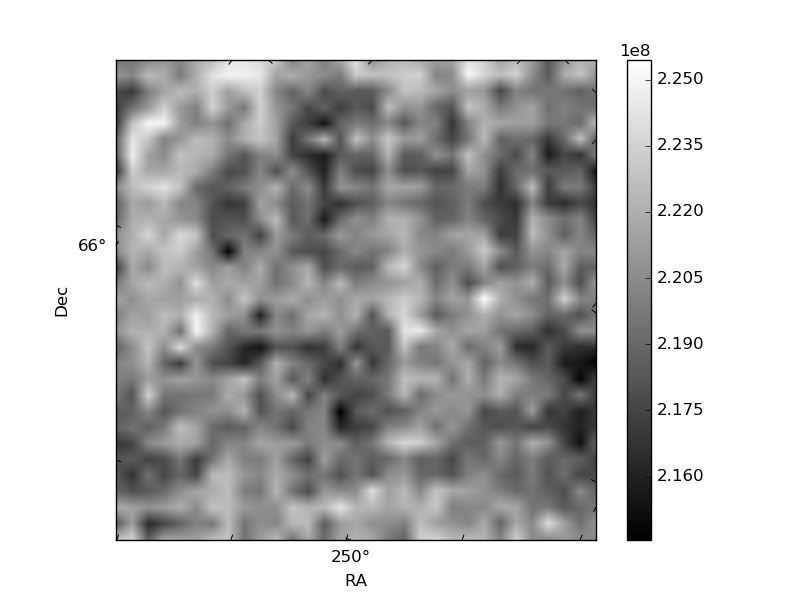
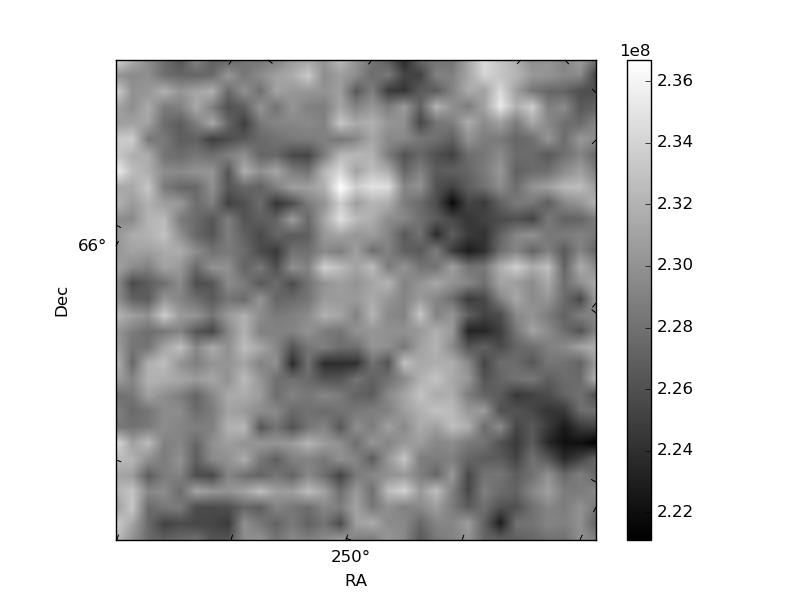
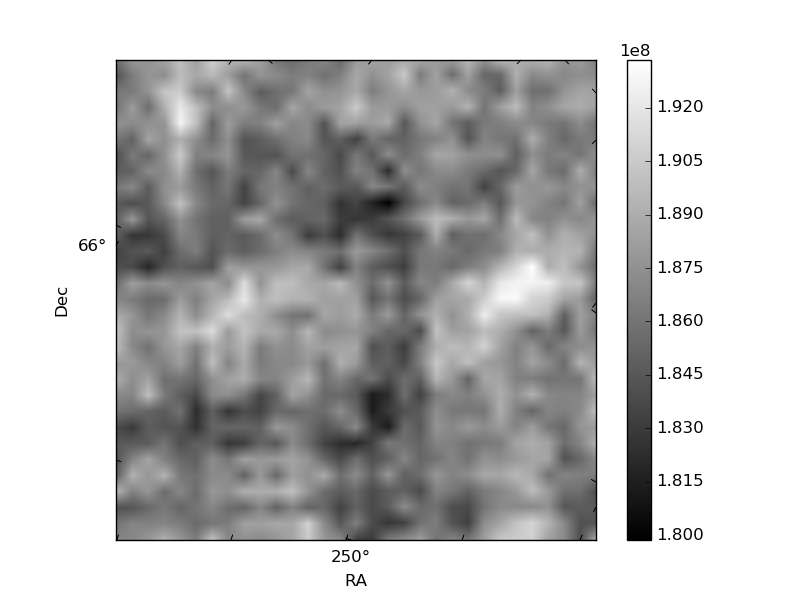
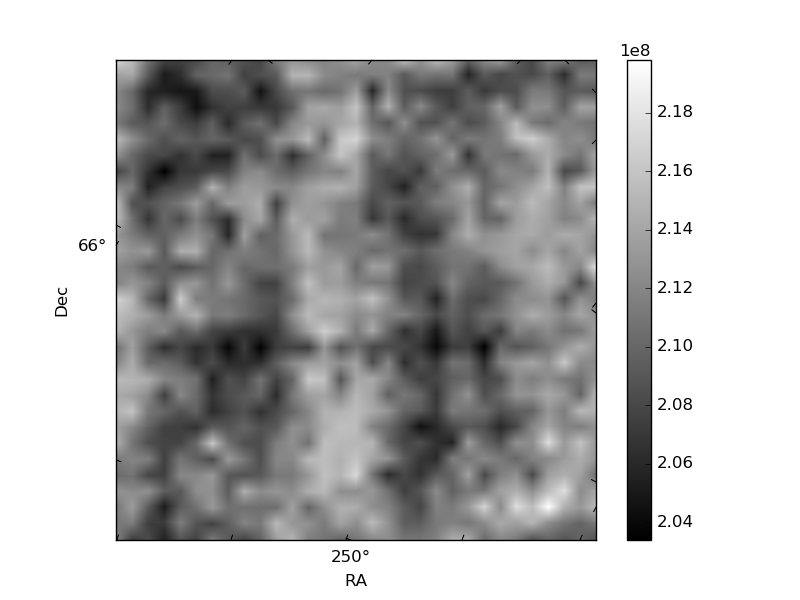
Histogram calculated using DETX and DETY for each event in the final _common_clean file
| Quadrant A | 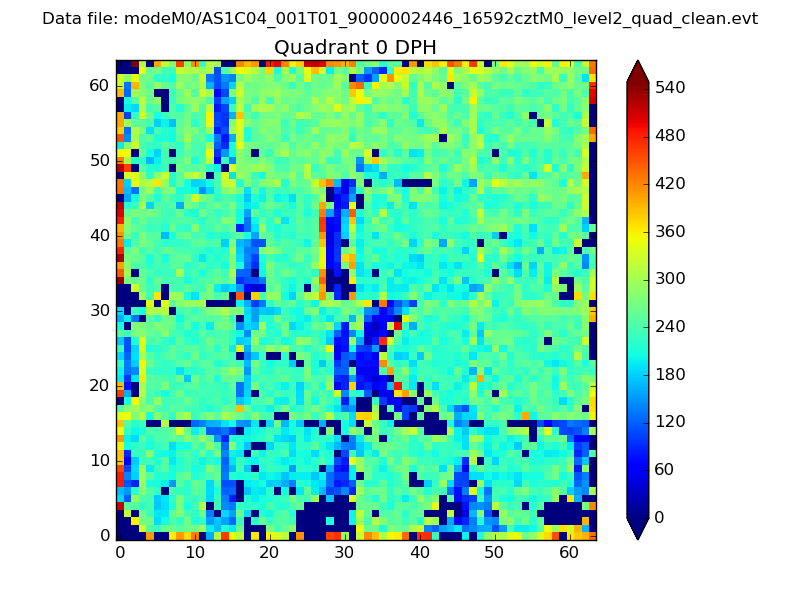 |
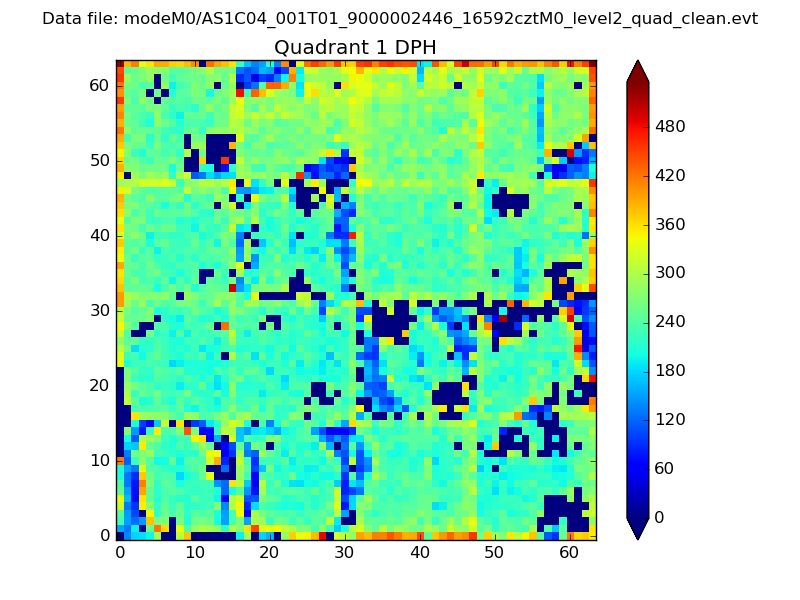 |
Quadrant B |
|---|---|---|---|
| Quadrant D | 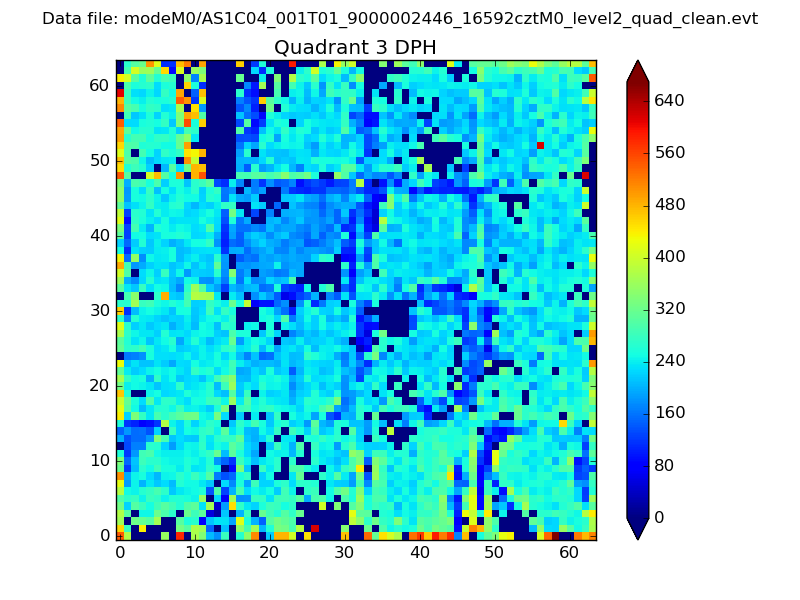 |
 |
Quadrant C |
| Plot type | Count rate plots | Images |
|---|---|---|
| Comparison with Poisson distribution Blue bars denote a histogram of data divided into 1 sec bins. Red curve is a Poisson curve with rate = median count rate of data. |
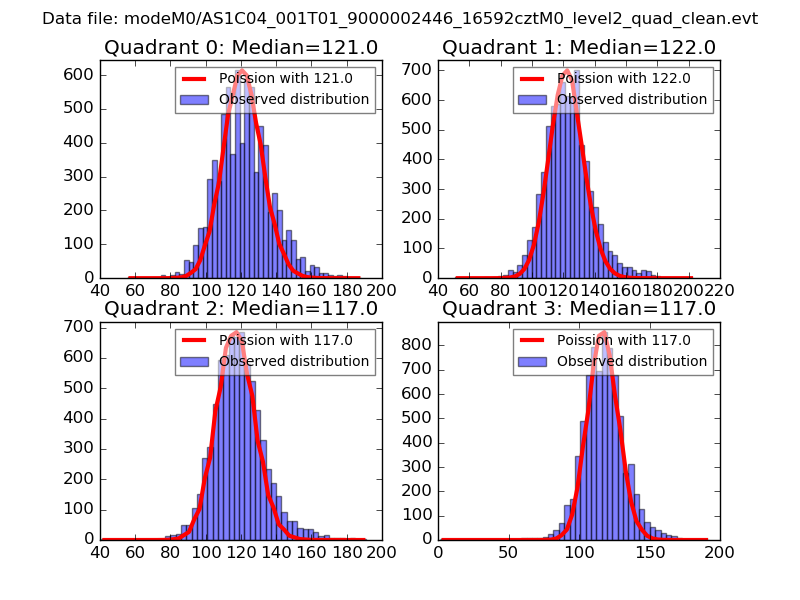 |
 |
| Quadrant-wise count rates Data is divided into 100 sec bins |
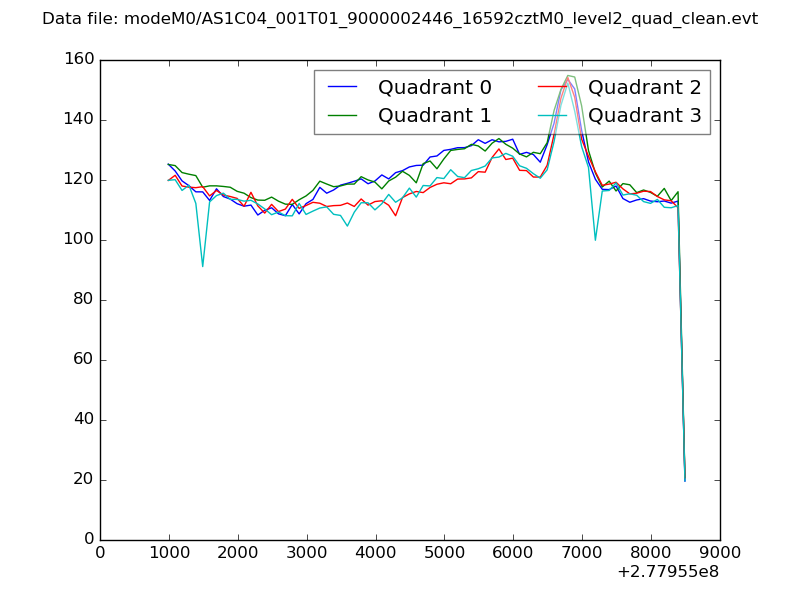 |
|
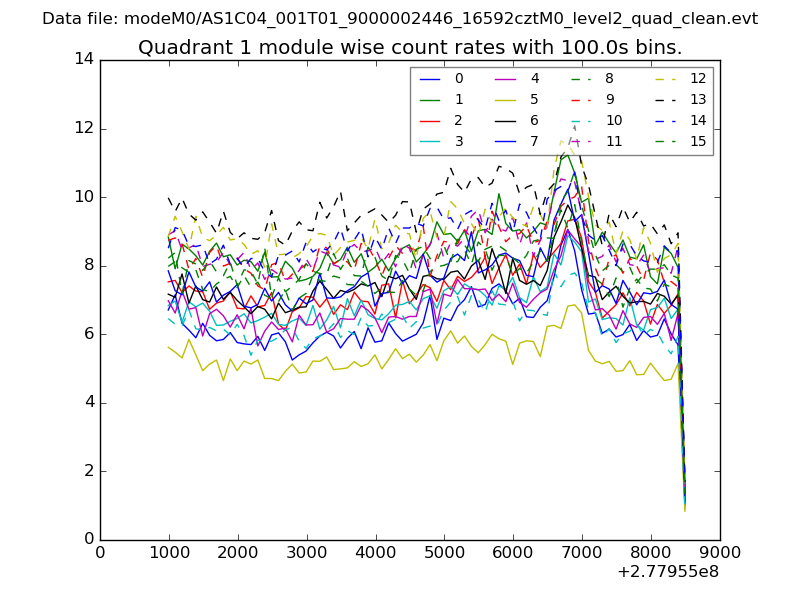
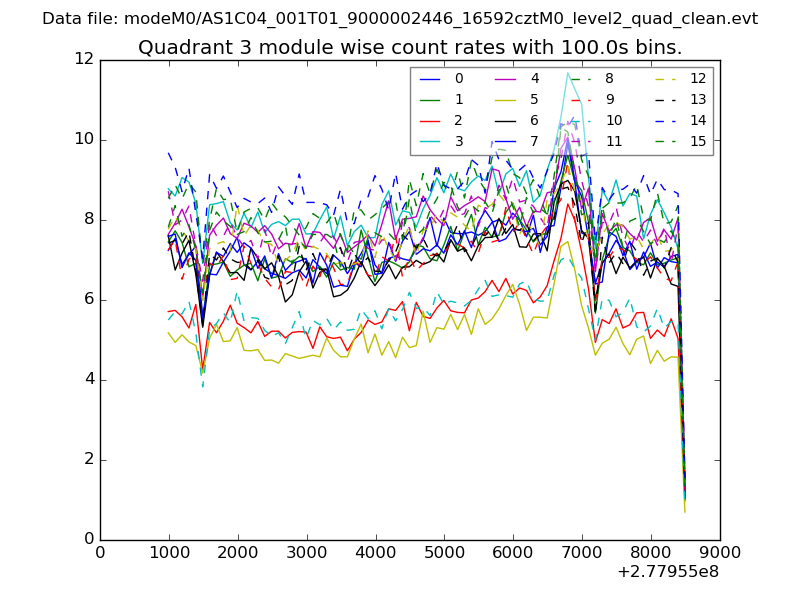
| Module-wise count rates for Quadrant A Data is divided into 100 sec bins |
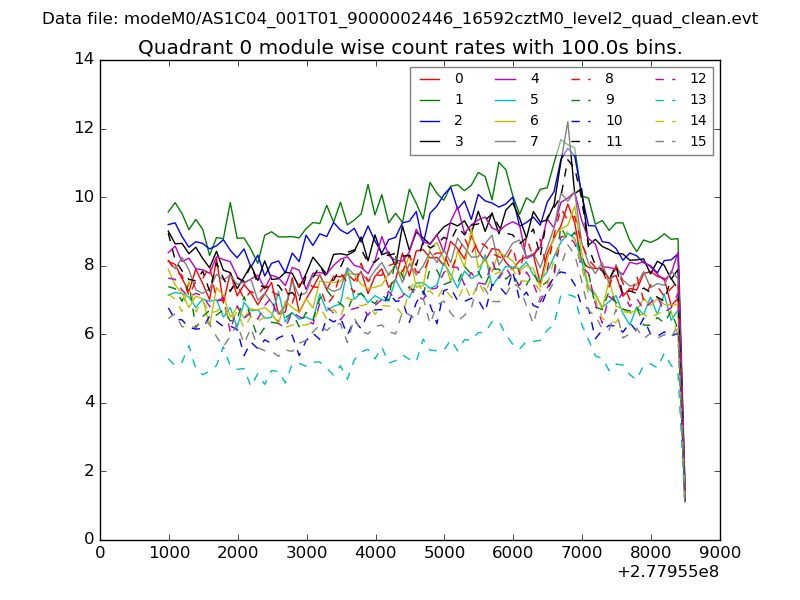 |
 |
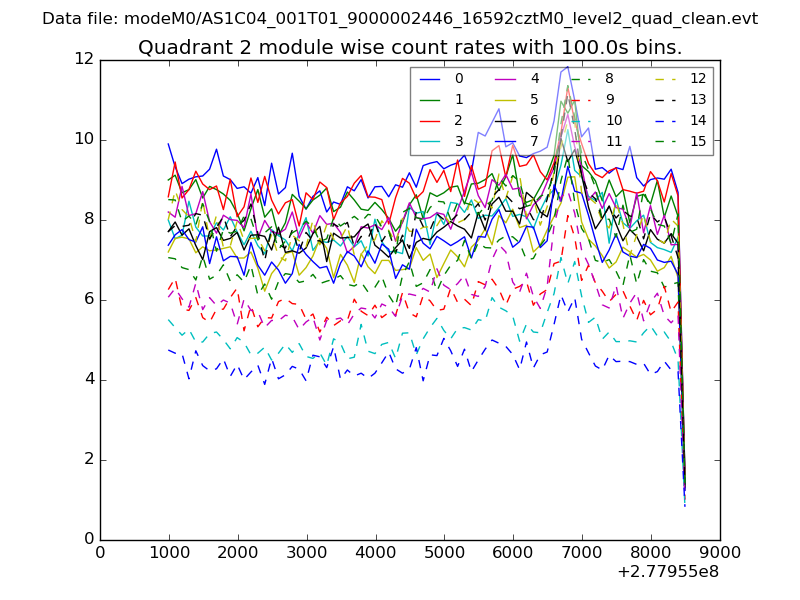
| Module-wise count rates for Quadrant B Data is divided into 100 sec bins |
 |
 |
| Module-wise count rates for Quadrant C Data is divided into 100 sec bins |
 |
 |
| Module-wise count rates for Quadrant D Data is divided into 100 sec bins |
 |
 |
| Parameter | Plot |
|---|---|
| CZT HV Monitor | 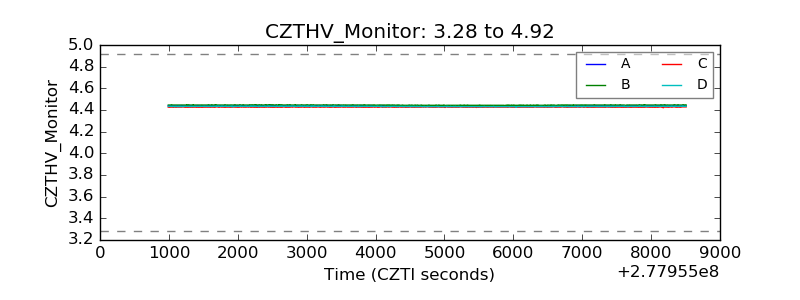 |
| D_VDD | 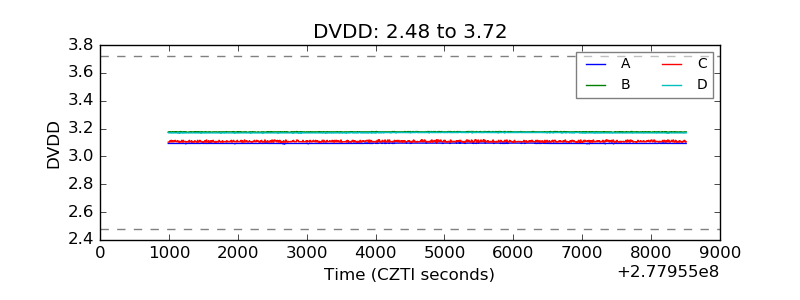 |
| Temperature 1 | 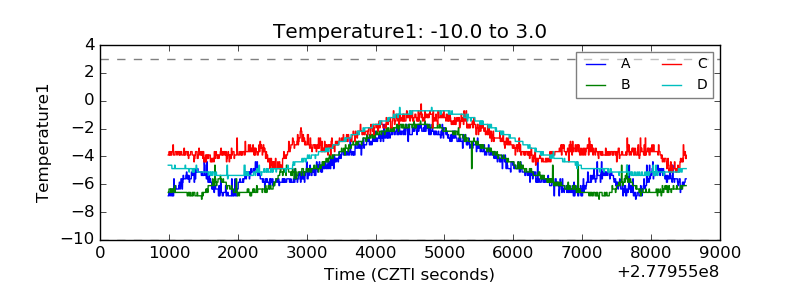 |
| Veto HV Monitor | 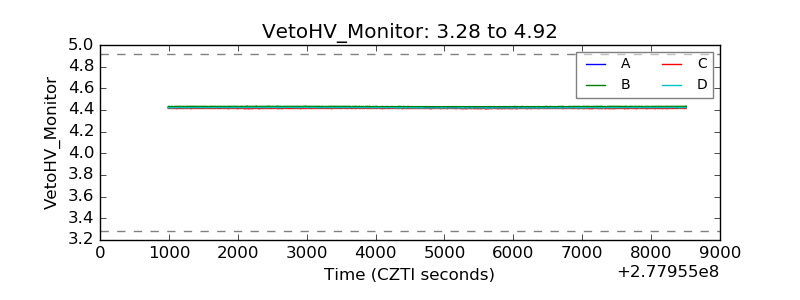 |
| Veto LLD | 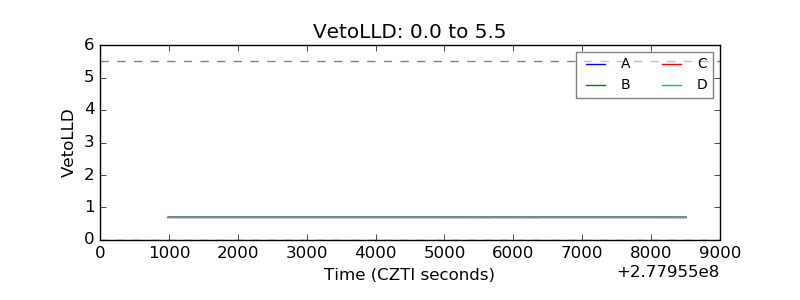 |
| Alpha Counter | 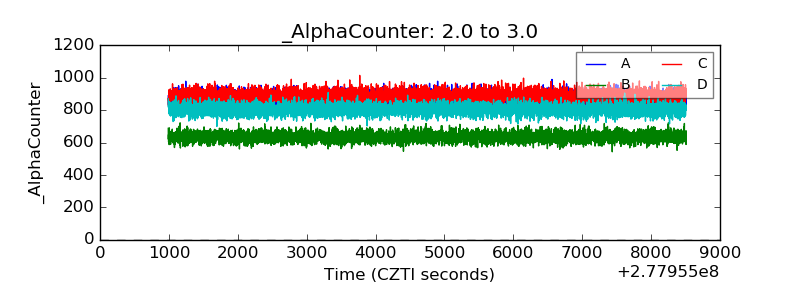 |
| _CPM_Rate | 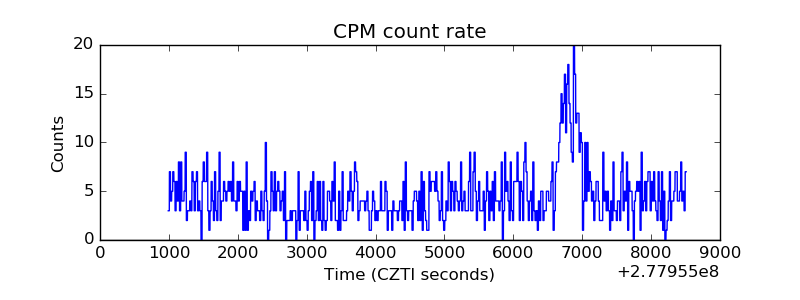 |
| CZT Counter | 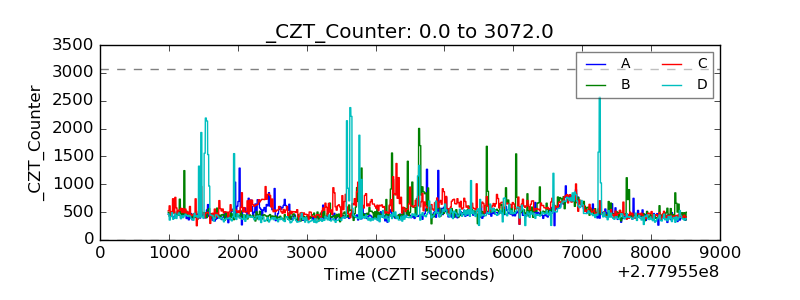 |
| +2.5 Volts monitor |  |
| +5 Volts monitor | 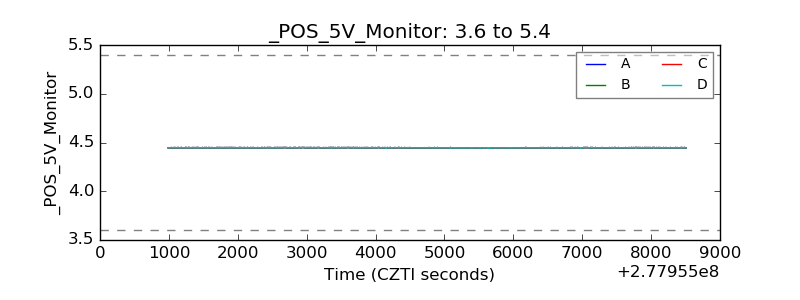 |
| _ROLL_ROT | 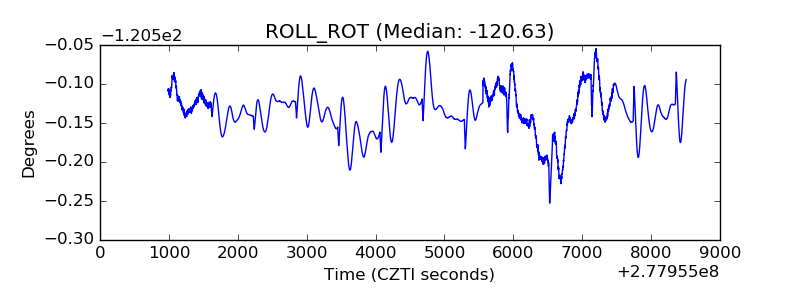 |
| _Roll_DEC | 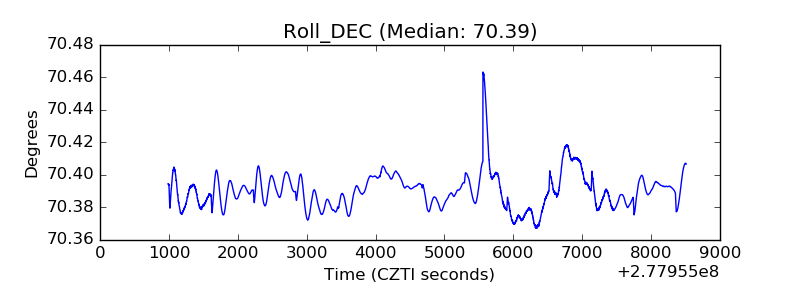 |
| _Roll_RA |  |
| Veto Counter | 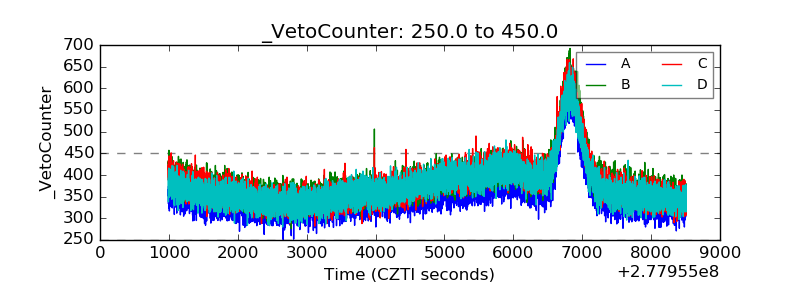 |