| Param | Original file | Final file |
|---|---|---|
| Filename | modeM0/AS1C04_001T01_9000002446_16596cztM0_level2.evt | modeM0/AS1C04_001T01_9000002446_16596cztM0_level2_quad_clean.evt |
| Size (bytes) | 463,803,840 | 126,501,120 |
| Size | 442.3 MB | 120.6 MB |
| Events in quadrant A | 3,194,904 | 853,061 |
| Events in quadrant B | 3,486,432 | 856,611 |
| Events in quadrant C | 3,222,501 | 824,953 |
| Events in quadrant D | 3,661,964 | 804,595 |
| Mode M9 | |||
|---|---|---|---|
| Quadrant | BADHDUFLAG | Total packets | Discarded packets |
| A | 0 | 5 | 0 |
| B | 0 | 5 | 0 |
| C | 0 | 5 | 0 |
| D | 0 | 5 | 0 |
| Mode SS | |||
|---|---|---|---|
| Quadrant | BADHDUFLAG | Total packets | Discarded packets |
| A | 0 | 142 | 0 |
| B | 0 | 142 | 0 |
| C | 0 | 142 | 0 |
| D | 0 | 142 | 0 |
| Mode M0 | |||
|---|---|---|---|
| Quadrant | BADHDUFLAG | Total packets | Discarded packets |
| A | 0 | 14429 | 1 |
| B | 0 | 15013 | 1 |
| C | 0 | 14350 | 1 |
| D | 0 | 16182 | 1 |
| Quadrant | Total seconds | Saturated seconds | Saturation percentage |
|---|---|---|---|
| A | 7074 | 80 | 1.130902% |
| B | 7074 | 79 | 1.116766% |
| C | 7074 | 81 | 1.145038% |
| D | 7074 | 89 | 1.258128% |
Noise dominated data is calculated using 1-second bins in cleaned event files. If a bin has >2000 counts, and if more than 50% of those come from <1% of pixels, then it is considered to be noise-dominated and hence unusable.
| Quadrant | # 1 sec bins | Bins with >0 counts | Bins with >2000 counts | High rate bins dominated by noise | Noise dominated (total time) | Noise dominated (detector-on time) | Marked lightcurve |
|---|---|---|---|---|---|---|---|
| A | 7551 | 7076 | 4 | 4 | 0.05% | 0.06% | 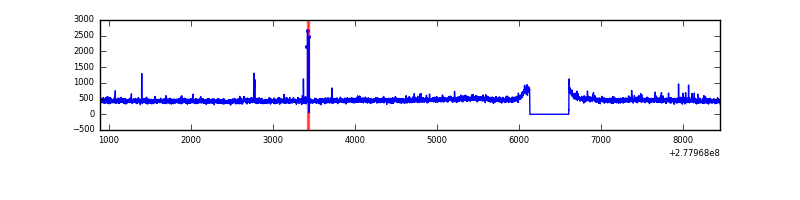 |
| B | 7551 | 7076 | 2 | 2 | 0.03% | 0.03% | 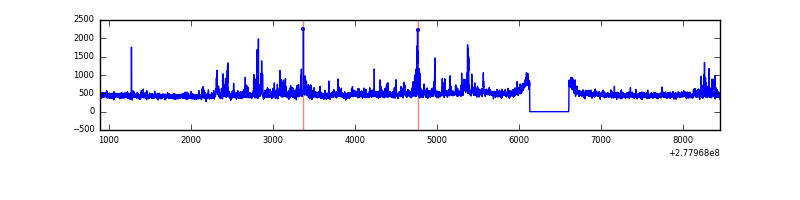 |
| C | 7551 | 7076 | 0 | 0 | 0.00% | 0.00% | 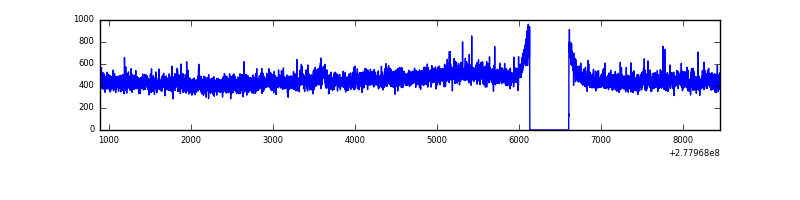 |
| D | 7551 | 7076 | 25 | 25 | 0.33% | 0.35% | 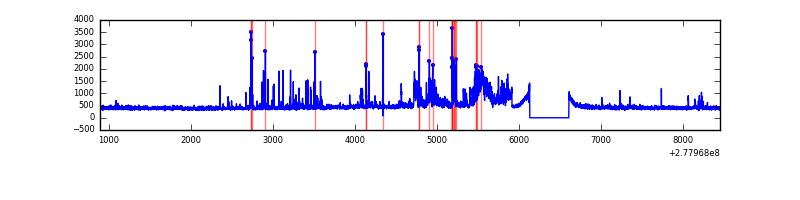 |
Top three noisy pixels from each quadrant. If the there are fewer than three noisy pixels in the level2.evt file, extra rows are filled as -1
| Pixel properties | Quadrant properties | ||||||
|---|---|---|---|---|---|---|---|
| Quadrant | DetID | PixID | Counts | Sigma | Mean | Median | Sigma |
| A | 15 | 174 | 34895 | 206.18 | 812 | 794 | 165.4 |
| A | 9 | 143 | 33810 | 199.62 | 812 | 794 | 165.4 |
| A | 0 | 226 | 7067 | 37.93 | 812 | 794 | 165.4 |
| B | 15 | 35 | 103894 | 663.66 | 809 | 784 | 155.4 |
| B | 0 | 229 | 66398 | 422.32 | 809 | 784 | 155.4 |
| B | 0 | 85 | 43215 | 273.1 | 809 | 784 | 155.4 |
| C | 14 | 238 | 120639 | 660.58 | 773 | 777 | 181.4 |
| C | 3 | 233 | 78695 | 429.42 | 773 | 777 | 181.4 |
| C | 7 | 247 | 9014 | 45.39 | 773 | 777 | 181.4 |
| D | 1 | 52 | 549787 | 2846.95 | 783 | 757 | 192.8 |
| D | 10 | 70 | 77071 | 395.72 | 783 | 757 | 192.8 |
| D | 2 | 33 | 35710 | 181.25 | 783 | 757 | 192.8 |
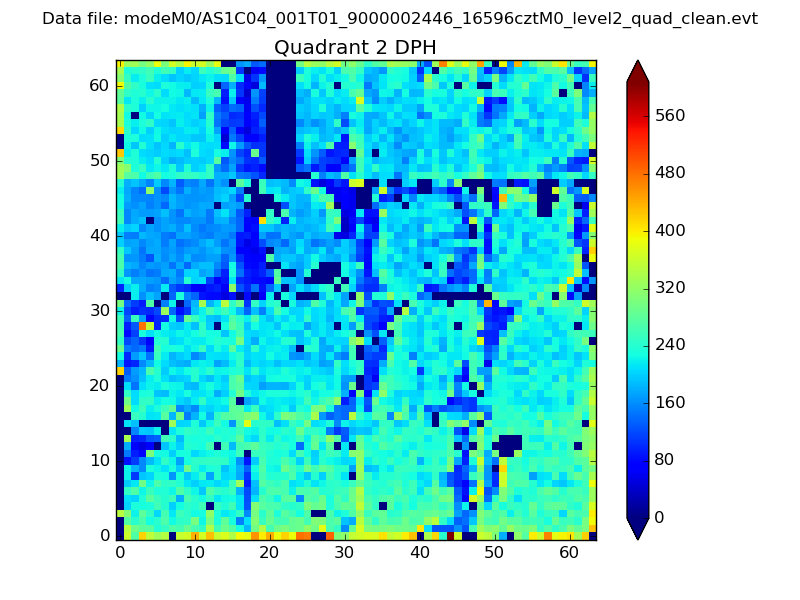
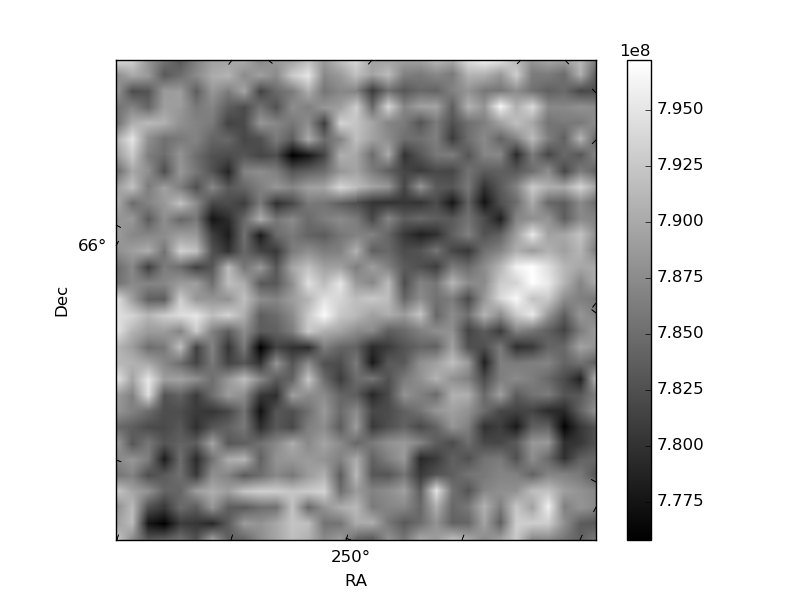
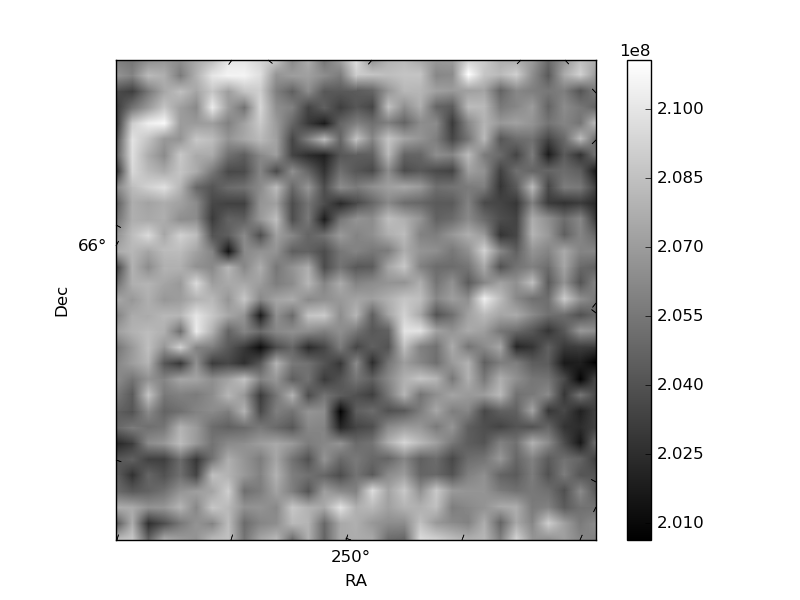
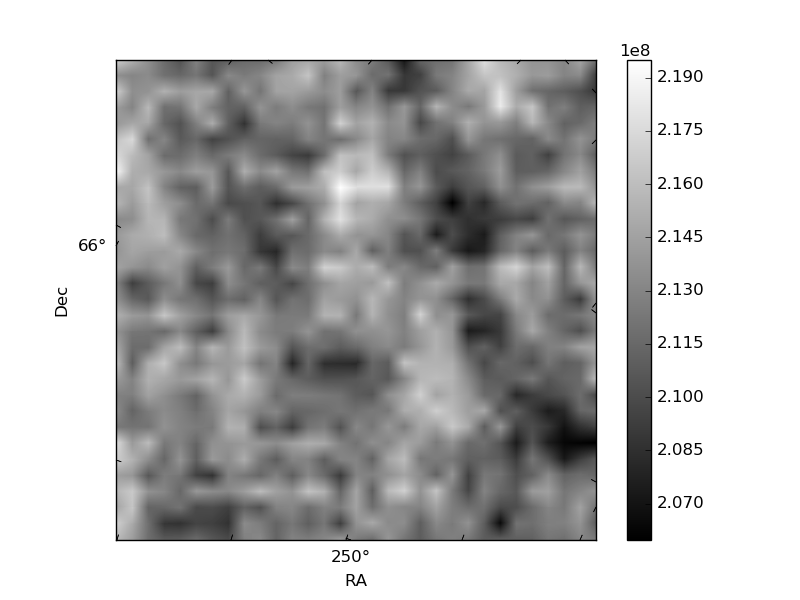
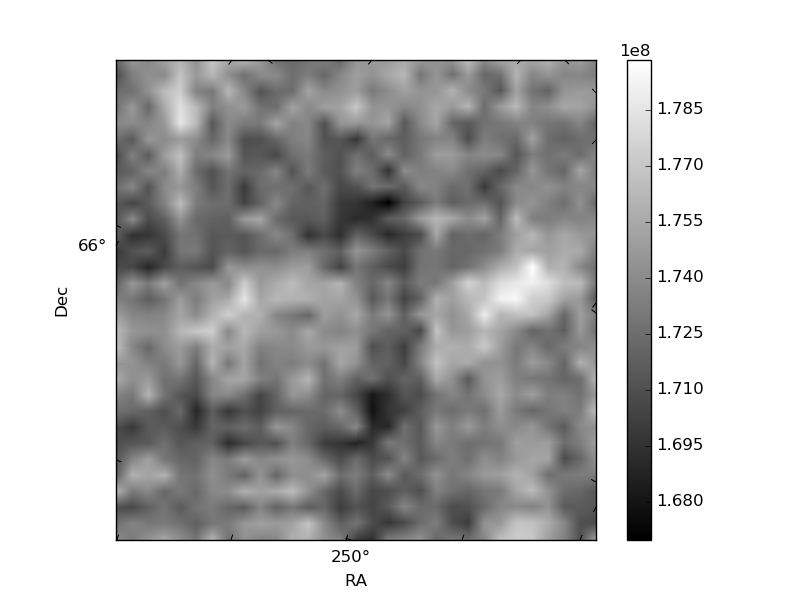
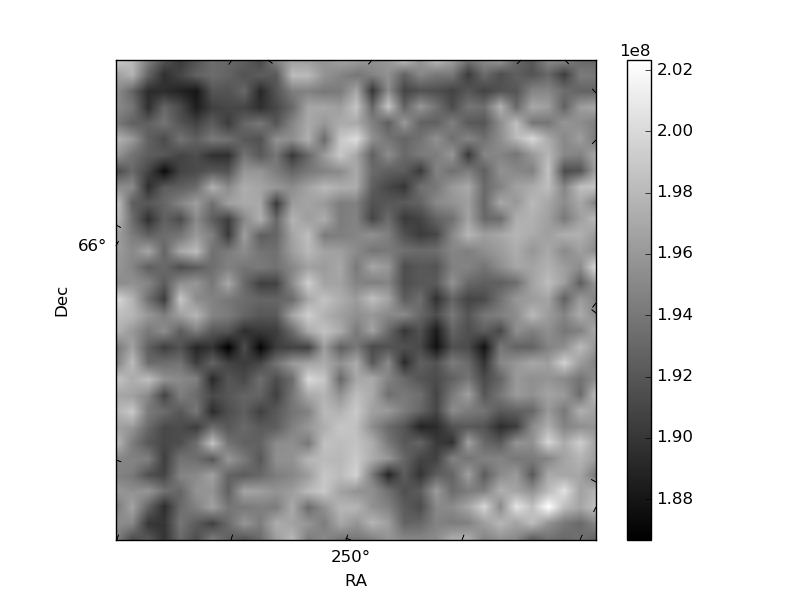
Histogram calculated using DETX and DETY for each event in the final _common_clean file
| Quadrant A | 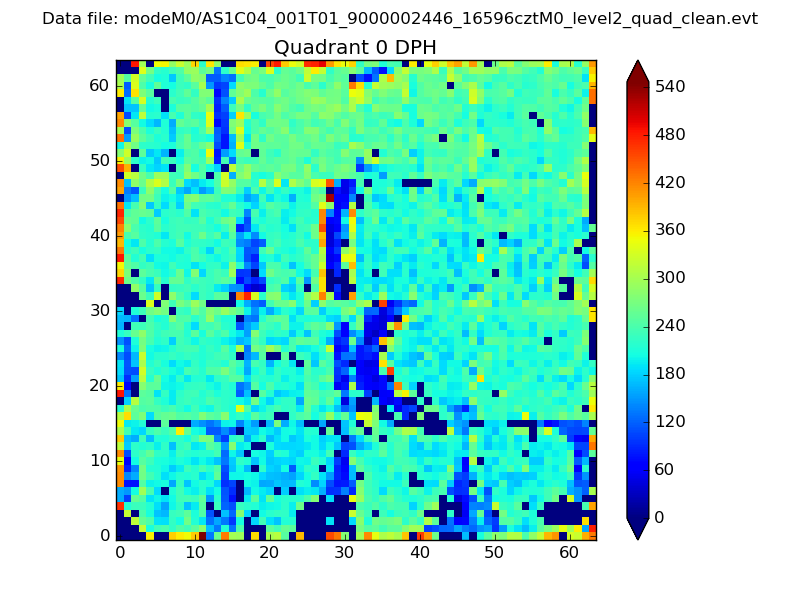 |
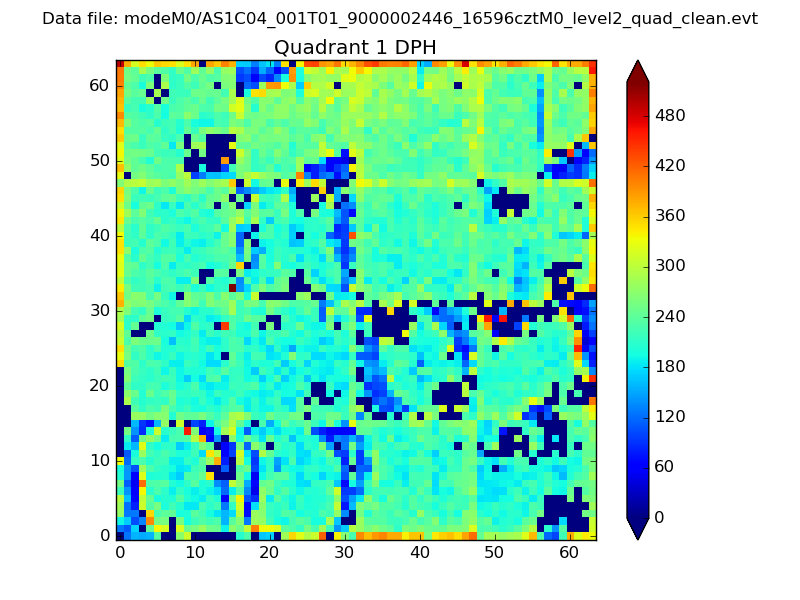 |
Quadrant B |
|---|---|---|---|
| Quadrant D | 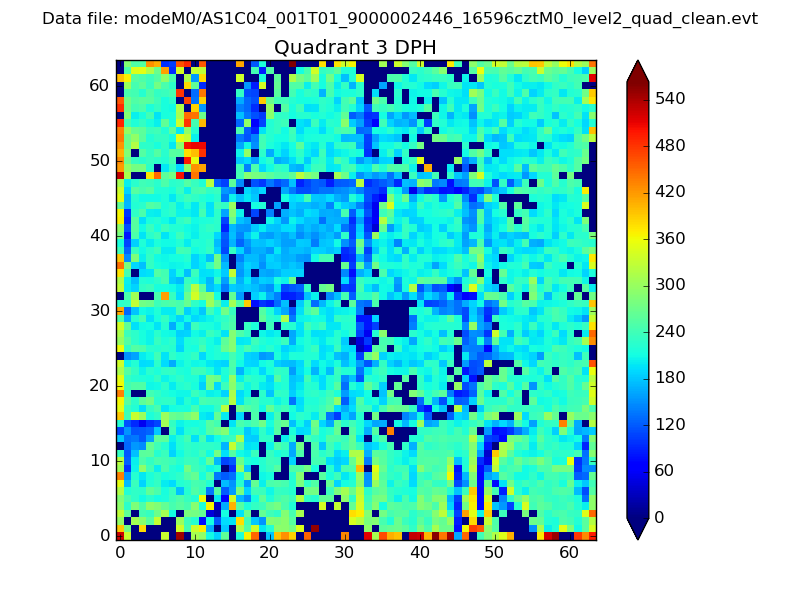 |
 |
Quadrant C |
| Plot type | Count rate plots | Images |
|---|---|---|
| Comparison with Poisson distribution Blue bars denote a histogram of data divided into 1 sec bins. Red curve is a Poisson curve with rate = median count rate of data. |
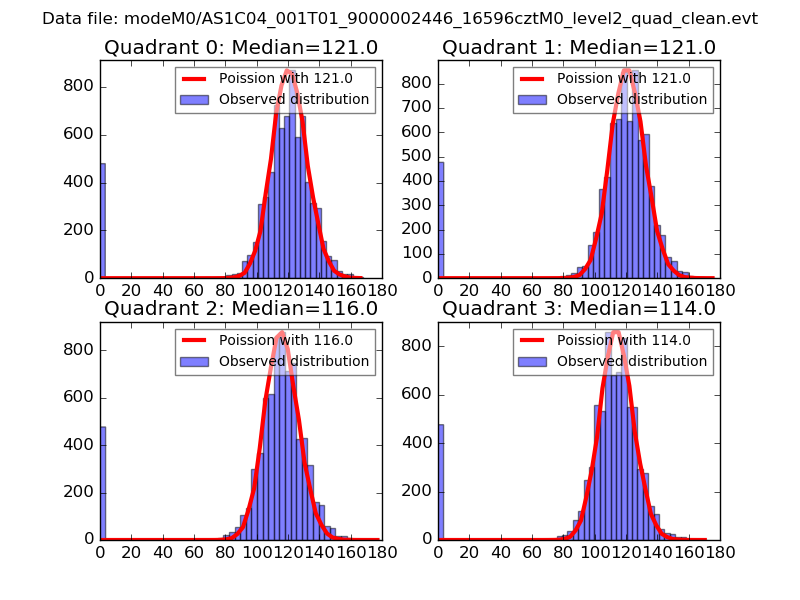 |
 |
| Quadrant-wise count rates Data is divided into 100 sec bins |
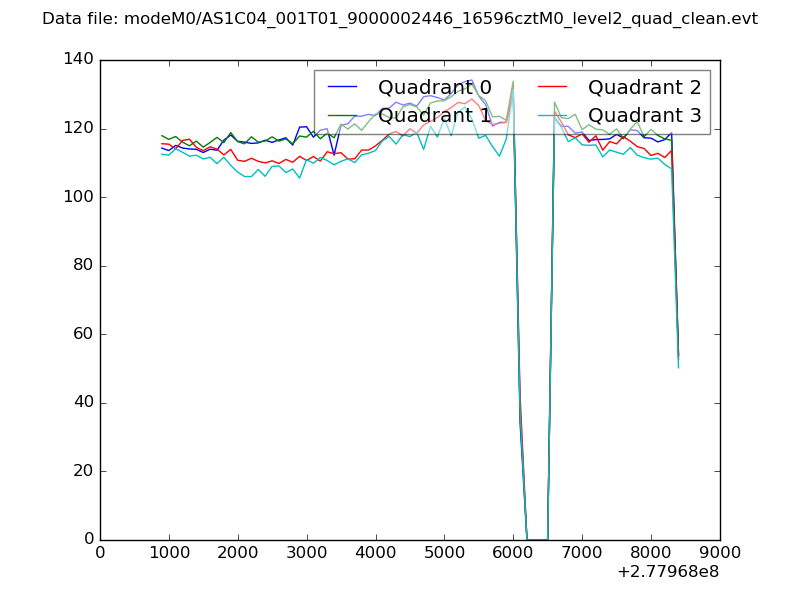 |
|
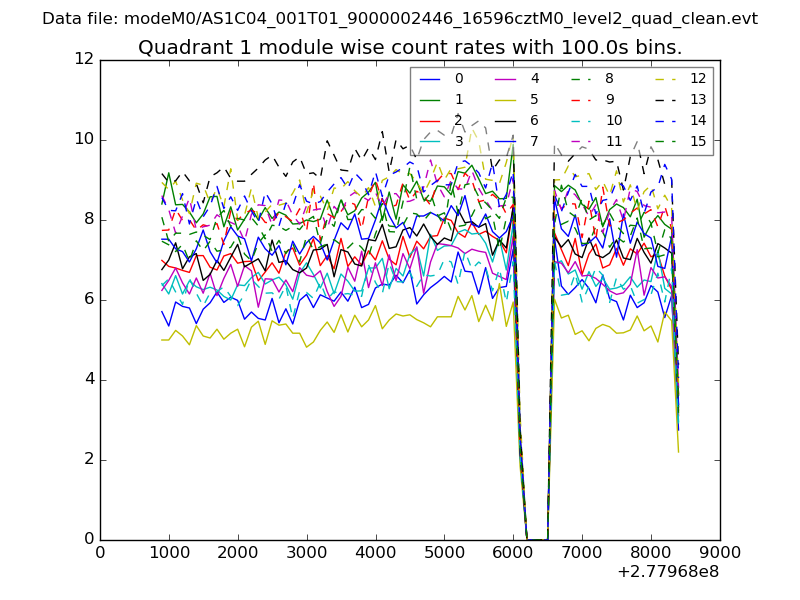
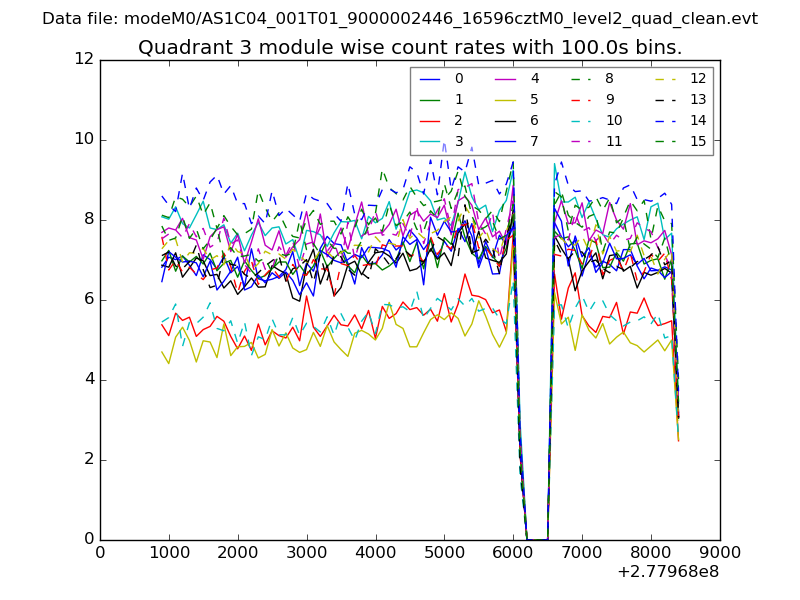
| Module-wise count rates for Quadrant A Data is divided into 100 sec bins |
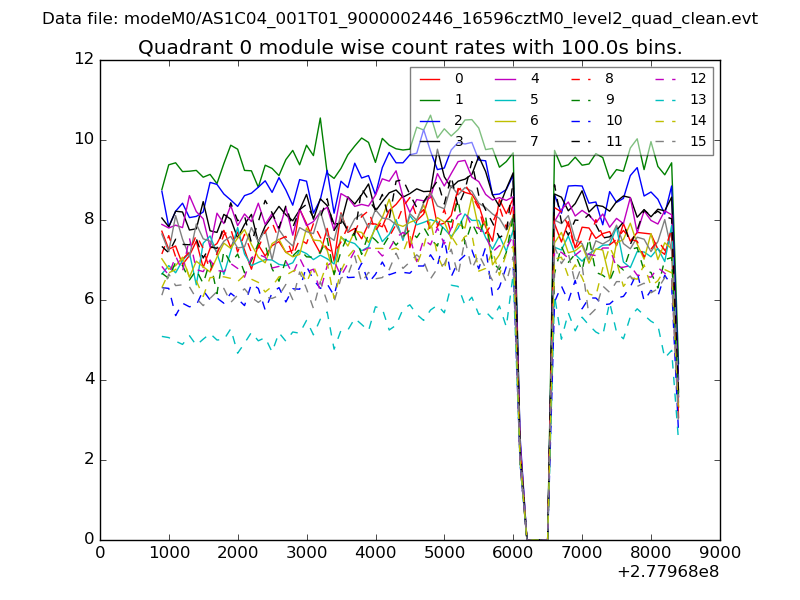 |
 |
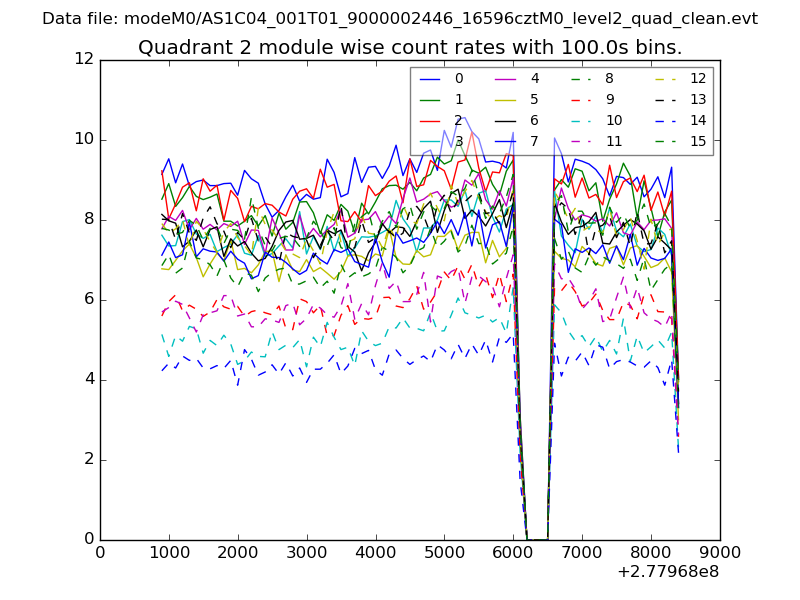
| Module-wise count rates for Quadrant B Data is divided into 100 sec bins |
 |
 |
| Module-wise count rates for Quadrant C Data is divided into 100 sec bins |
 |
 |
| Module-wise count rates for Quadrant D Data is divided into 100 sec bins |
 |
 |
| Parameter | Plot |
|---|---|
| CZT HV Monitor |  |
| D_VDD | 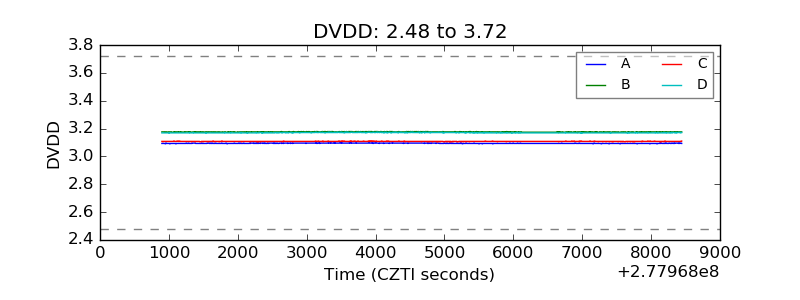 |
| Temperature 1 | 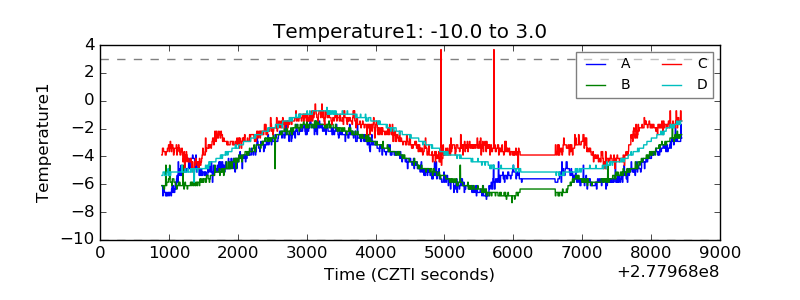 |
| Veto HV Monitor | 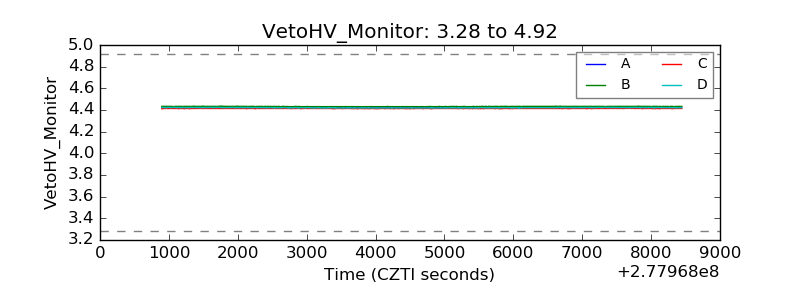 |
| Veto LLD | 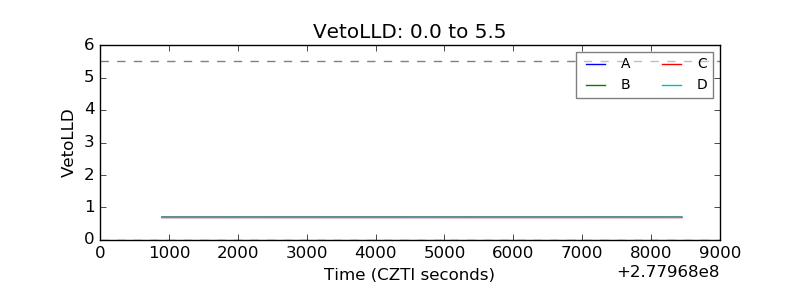 |
| Alpha Counter | 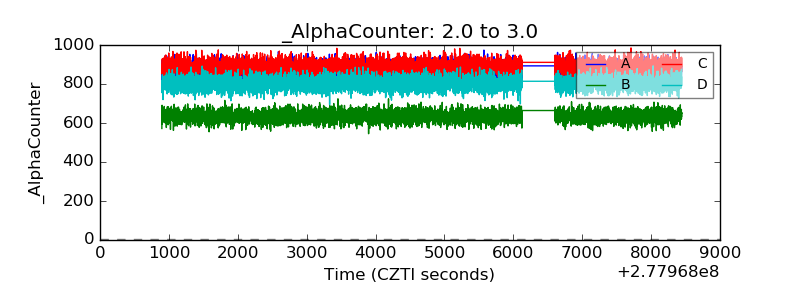 |
| _CPM_Rate | 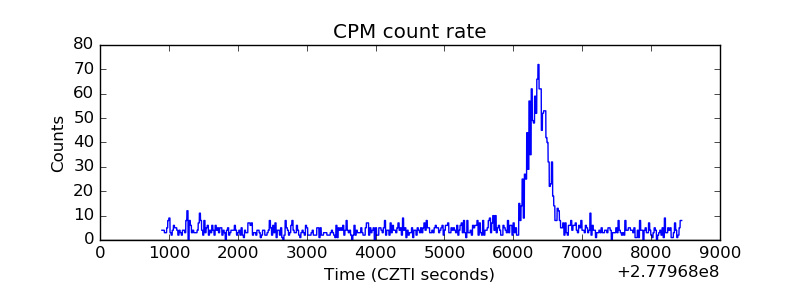 |
| CZT Counter | 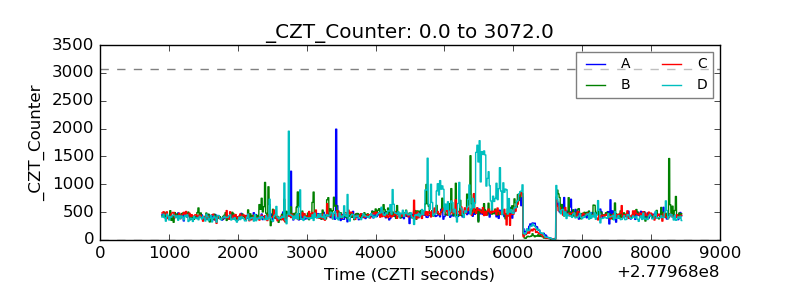 |
| +2.5 Volts monitor |  |
| +5 Volts monitor |  |
| _ROLL_ROT | 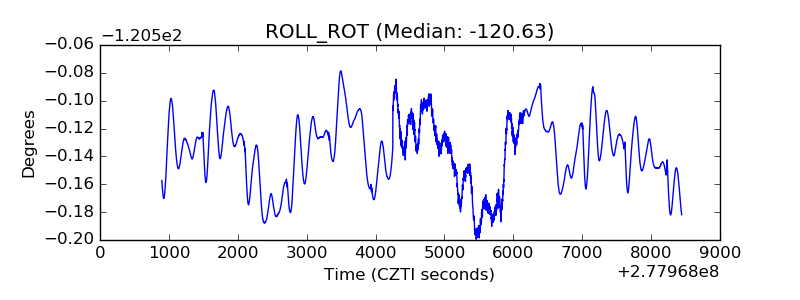 |
| _Roll_DEC | 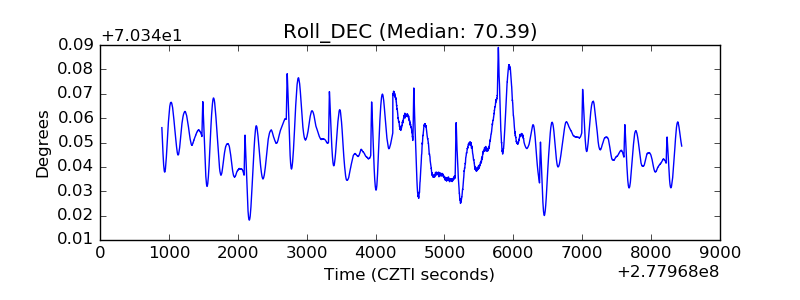 |
| _Roll_RA | 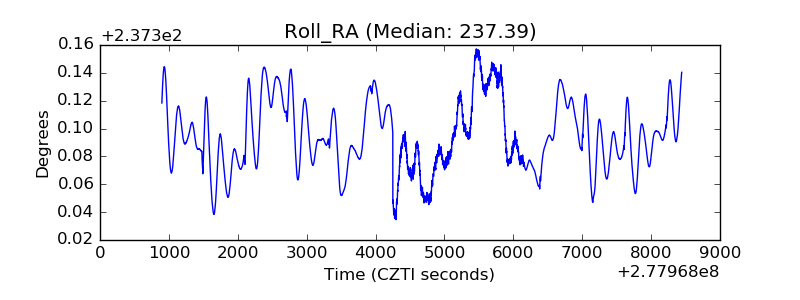 |
| Veto Counter | 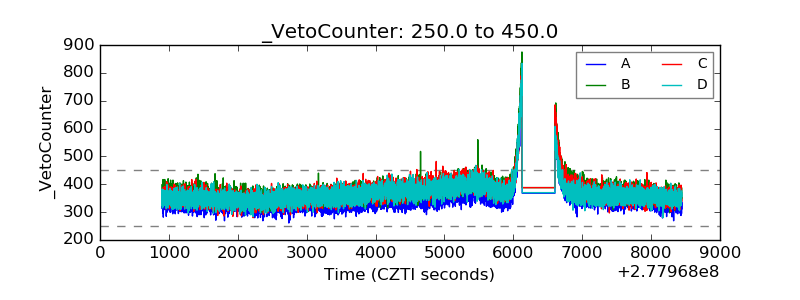 |