| Param | Original file | Final file |
|---|---|---|
| Filename | modeM0/AS1C04_009T01_9000002448_16596cztM0_level2.evt | modeM0/AS1C04_009T01_9000002448_16596cztM0_level2_quad_clean.evt |
| Size (bytes) | 755,850,240 | 187,130,880 |
| Size | 720.8 MB | 178.5 MB |
| Events in quadrant A | 4,730,794 | 1,257,819 |
| Events in quadrant B | 5,982,405 | 1,277,147 |
| Events in quadrant C | 6,408,279 | 1,221,077 |
| Events in quadrant D | 5,070,532 | 1,196,885 |
| Mode M0 | |||
|---|---|---|---|
| Quadrant | BADHDUFLAG | Total packets | Discarded packets |
| A | 0 | 21142 | 3 |
| B | 0 | 24263 | 2 |
| C | 0 | 25869 | 2 |
| D | 0 | 22246 | 2 |
| Mode SS | |||
|---|---|---|---|
| Quadrant | BADHDUFLAG | Total packets | Discarded packets |
| A | 0 | 210 | 0 |
| B | 0 | 210 | 0 |
| C | 0 | 210 | 0 |
| D | 0 | 210 | 0 |
| Mode M9 | |||
|---|---|---|---|
| Quadrant | BADHDUFLAG | Total packets | Discarded packets |
| A | 0 | 16 | 0 |
| B | 0 | 16 | 0 |
| C | 0 | 16 | 0 |
| D | 0 | 16 | 0 |
| Quadrant | Total seconds | Saturated seconds | Saturation percentage |
|---|---|---|---|
| A | 10328 | 47 | 0.455074% |
| B | 10328 | 129 | 1.249032% |
| C | 10328 | 108 | 1.045701% |
| D | 10328 | 70 | 0.677769% |
Noise dominated data is calculated using 1-second bins in cleaned event files. If a bin has >2000 counts, and if more than 50% of those come from <1% of pixels, then it is considered to be noise-dominated and hence unusable.
| Quadrant | # 1 sec bins | Bins with >0 counts | Bins with >2000 counts | High rate bins dominated by noise | Noise dominated (total time) | Noise dominated (detector-on time) | Marked lightcurve |
|---|---|---|---|---|---|---|---|
| A | 11894 | 10331 | 1 | 1 | 0.01% | 0.01% | 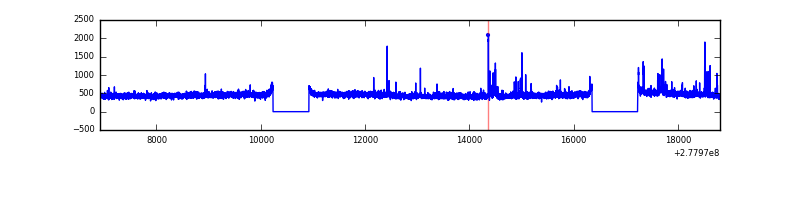 |
| B | 11894 | 10331 | 58 | 58 | 0.49% | 0.56% | 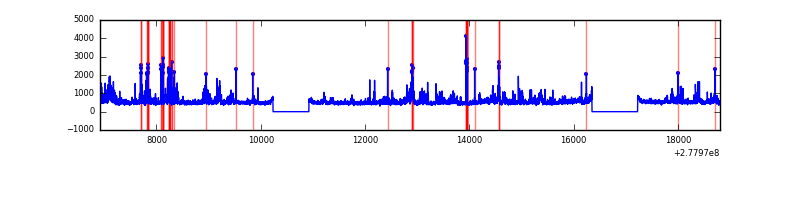 |
| C | 11894 | 10331 | 1 | 1 | 0.01% | 0.01% | 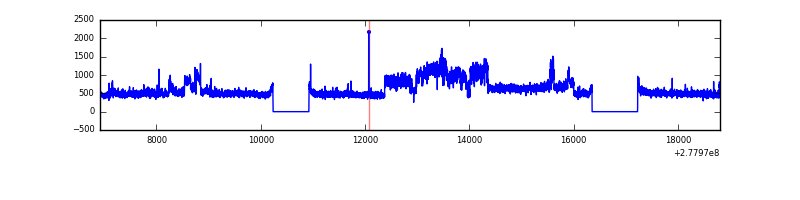 |
| D | 11894 | 10331 | 35 | 35 | 0.29% | 0.34% | 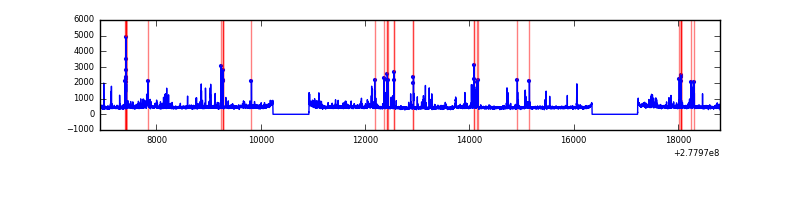 |
Top three noisy pixels from each quadrant. If the there are fewer than three noisy pixels in the level2.evt file, extra rows are filled as -1
| Pixel properties | Quadrant properties | ||||||
|---|---|---|---|---|---|---|---|
| Quadrant | DetID | PixID | Counts | Sigma | Mean | Median | Sigma |
| A | 15 | 174 | 74015 | 304.03 | 1197 | 1170 | 239.6 |
| A | 9 | 143 | 47734 | 194.34 | 1197 | 1170 | 239.6 |
| A | 0 | 226 | 10506 | 38.96 | 1197 | 1170 | 239.6 |
| B | 0 | 229 | 470486 | 2075.13 | 1199 | 1169 | 226.2 |
| B | 15 | 35 | 305728 | 1346.64 | 1199 | 1169 | 226.2 |
| B | 0 | 85 | 240488 | 1058.17 | 1199 | 1169 | 226.2 |
| C | 3 | 233 | 1685055 | 6281.18 | 1152 | 1156 | 268.1 |
| C | 14 | 238 | 177402 | 657.42 | 1152 | 1156 | 268.1 |
| C | 3 | 232 | 45612 | 165.83 | 1152 | 1156 | 268.1 |
| D | 1 | 52 | 266757 | 930.46 | 1165 | 1128 | 285.5 |
| D | 10 | 70 | 216272 | 753.62 | 1165 | 1128 | 285.5 |
| D | 2 | 33 | 66969 | 230.63 | 1165 | 1128 | 285.5 |
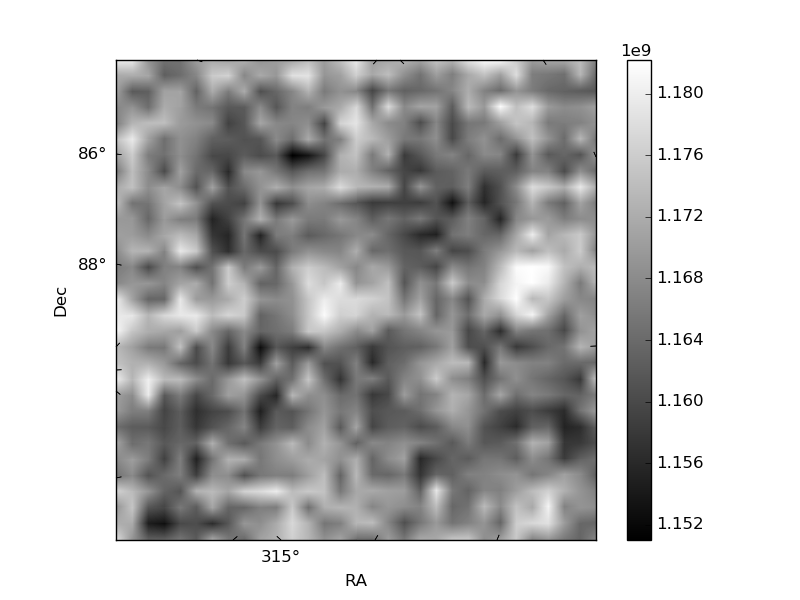
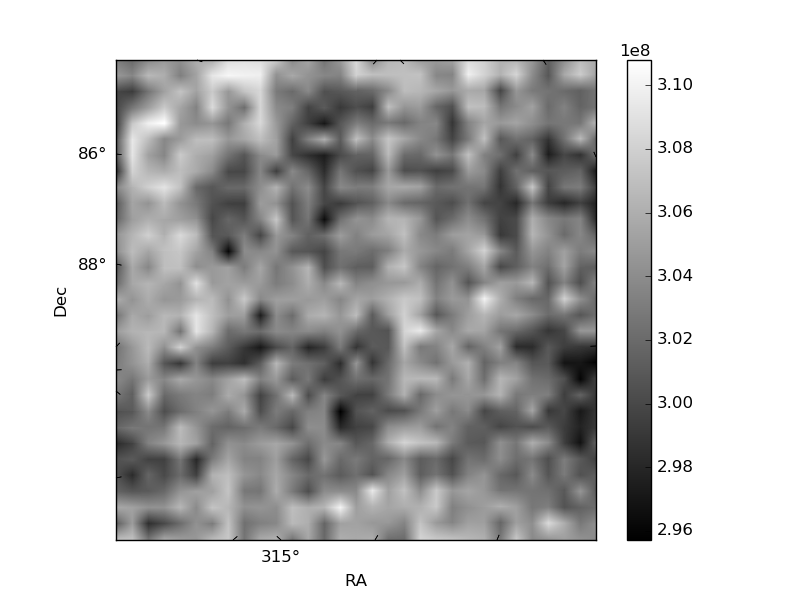
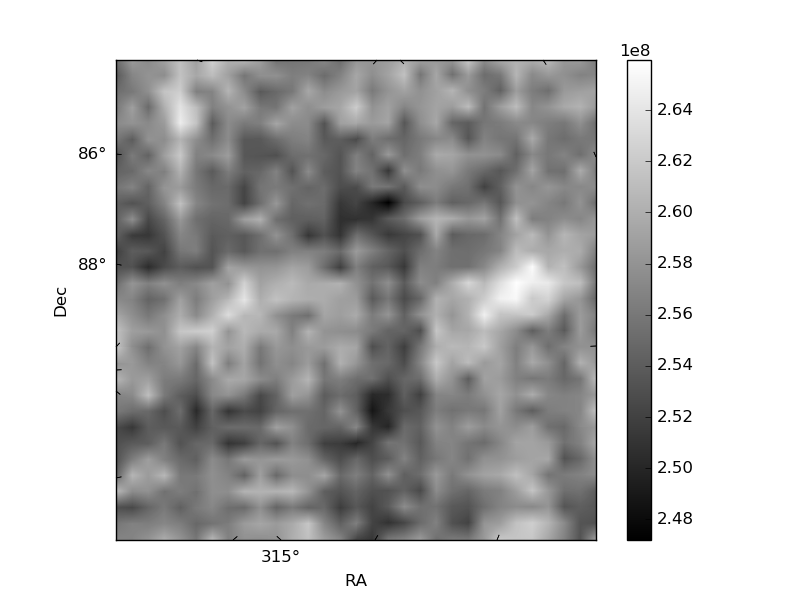
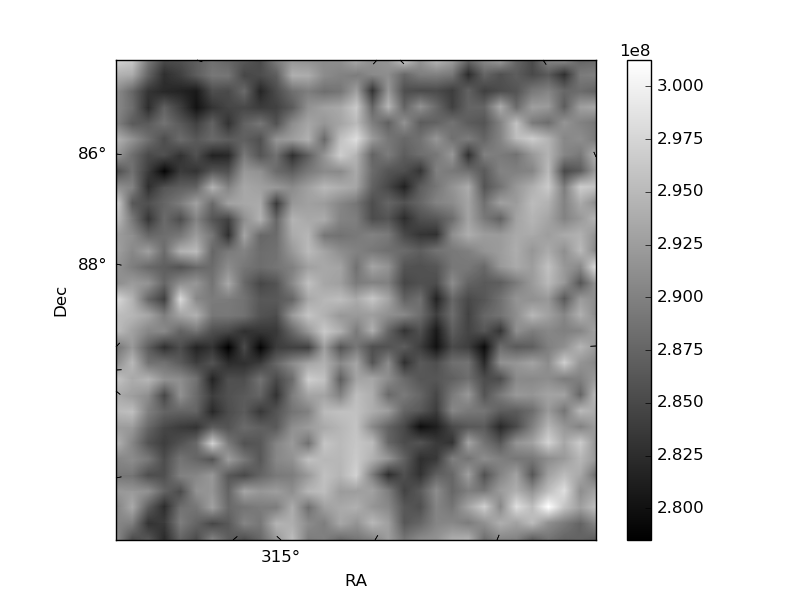
Histogram calculated using DETX and DETY for each event in the final _common_clean file
| Quadrant A | 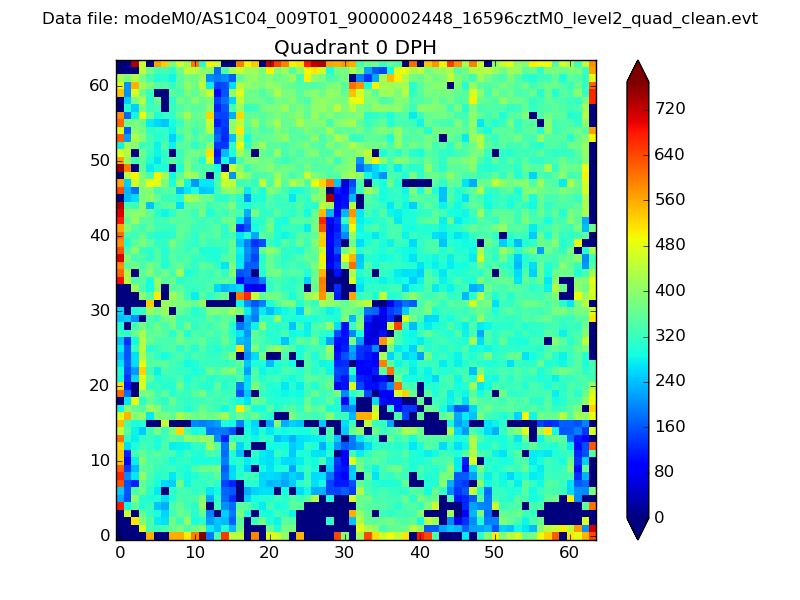 |
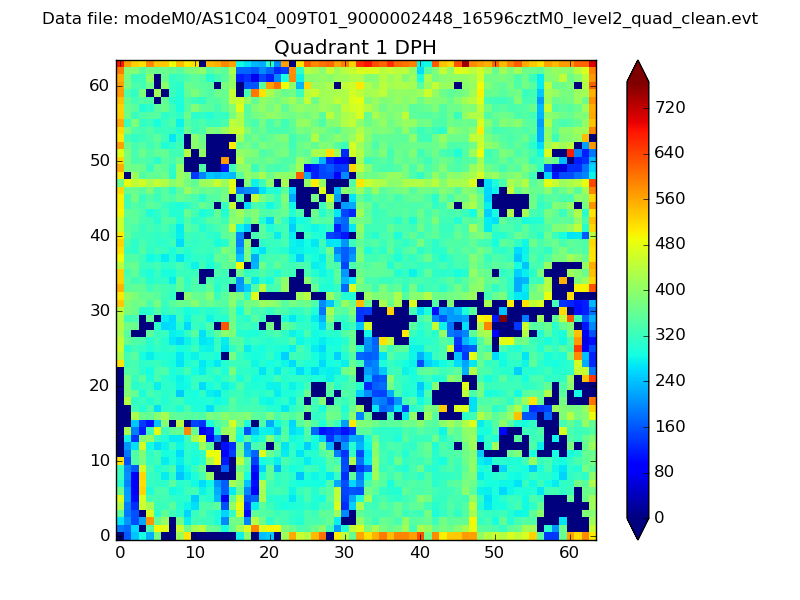 |
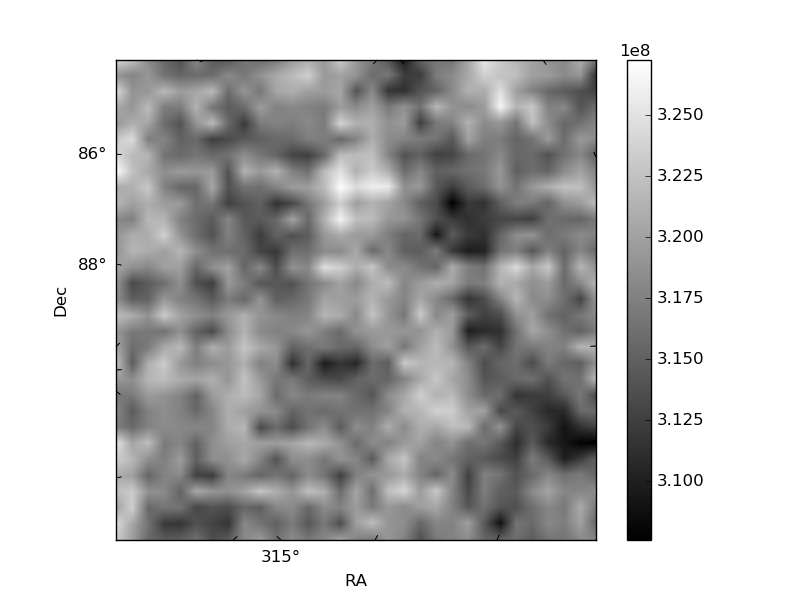
Quadrant B |
|---|---|---|---|
| Quadrant D | 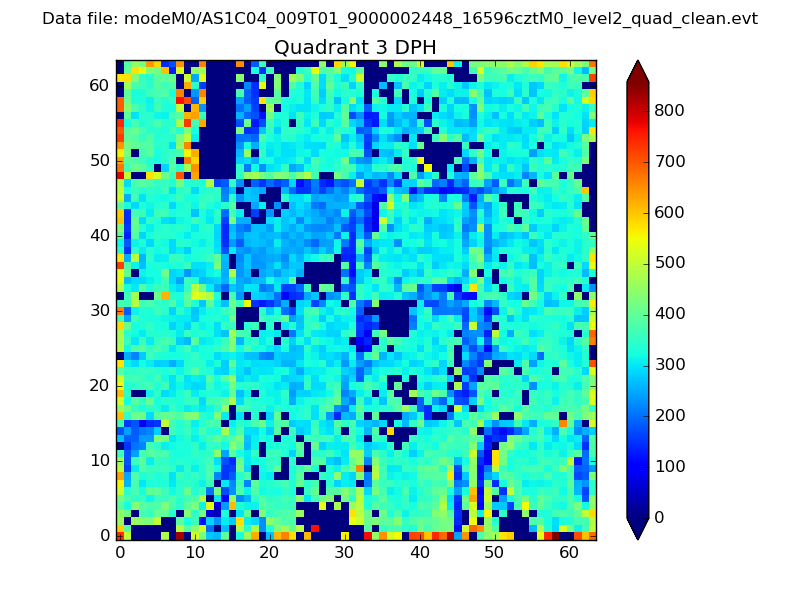 |
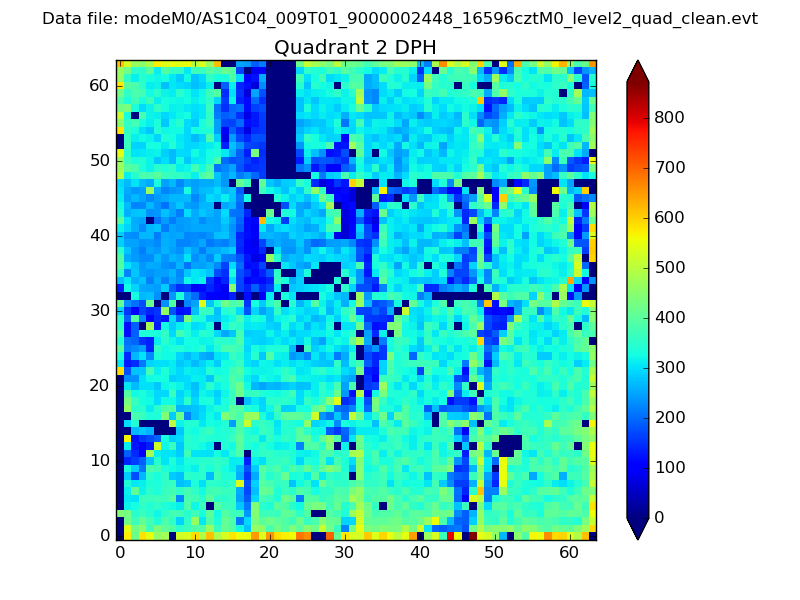 |
Quadrant C |
| Plot type | Count rate plots | Images |
|---|---|---|
| Comparison with Poisson distribution Blue bars denote a histogram of data divided into 1 sec bins. Red curve is a Poisson curve with rate = median count rate of data. |
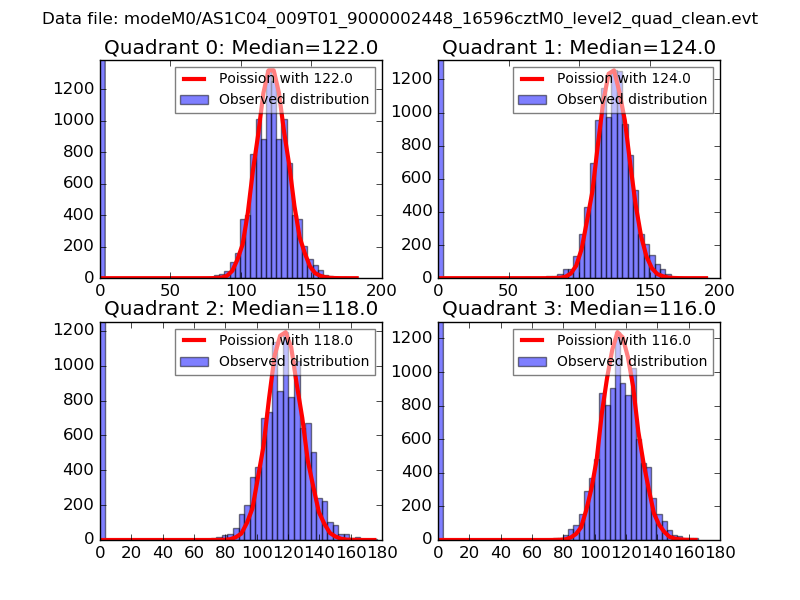 |
 |
| Quadrant-wise count rates Data is divided into 100 sec bins |
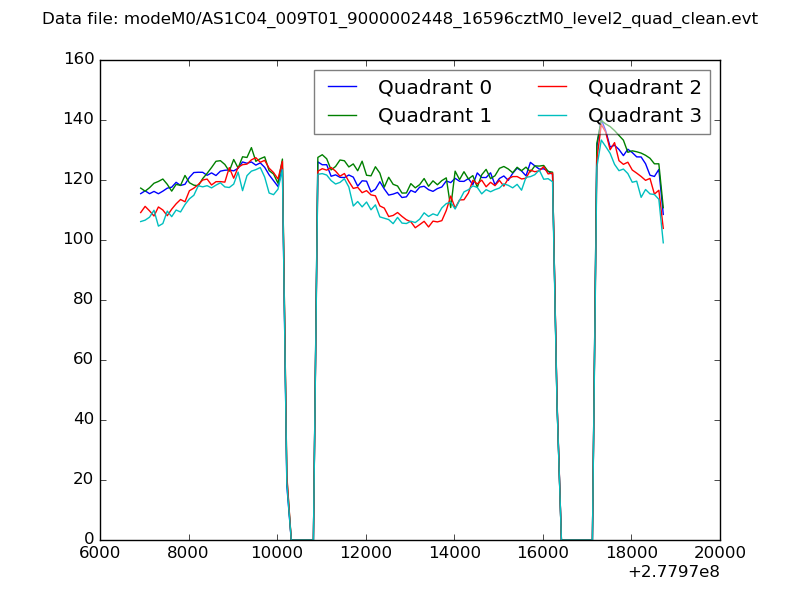 |
|
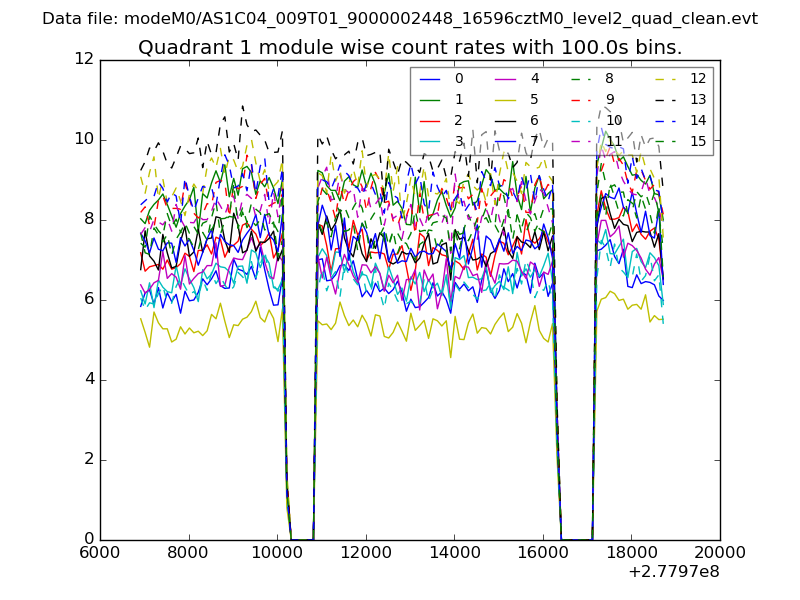
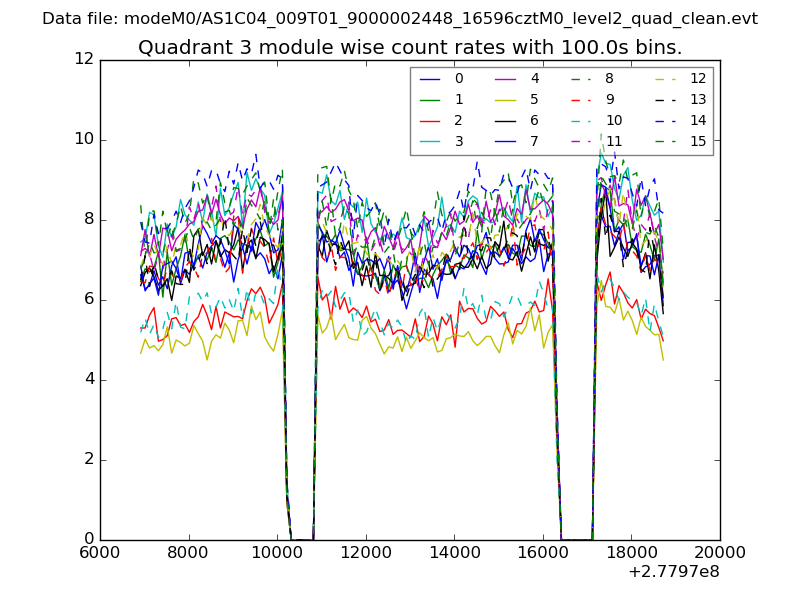
| Module-wise count rates for Quadrant A Data is divided into 100 sec bins |
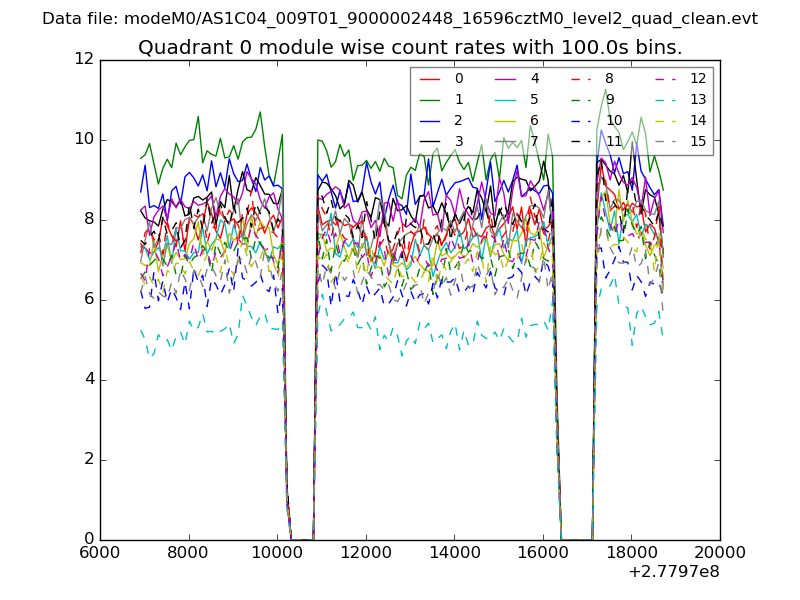 |
 |
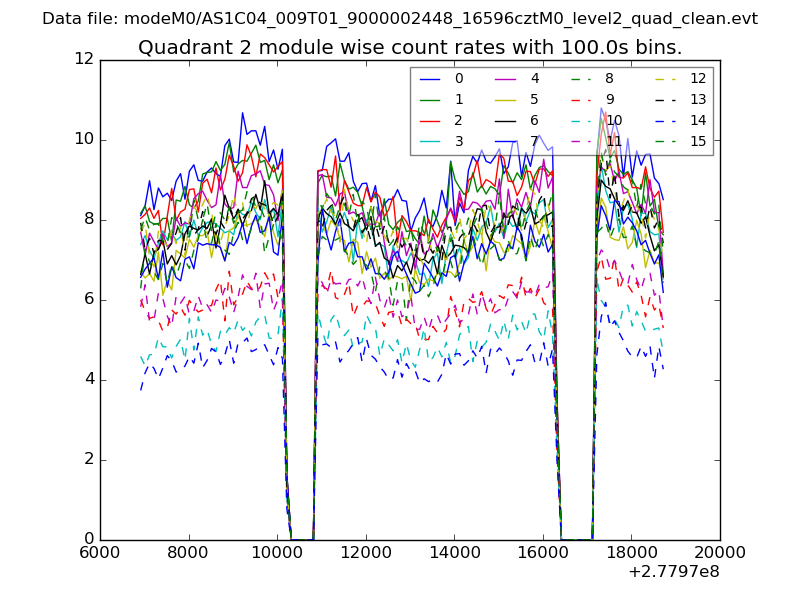
| Module-wise count rates for Quadrant B Data is divided into 100 sec bins |
 |
 |
| Module-wise count rates for Quadrant C Data is divided into 100 sec bins |
 |
 |
| Module-wise count rates for Quadrant D Data is divided into 100 sec bins |
 |
 |
| Parameter | Plot |
|---|---|
| CZT HV Monitor | 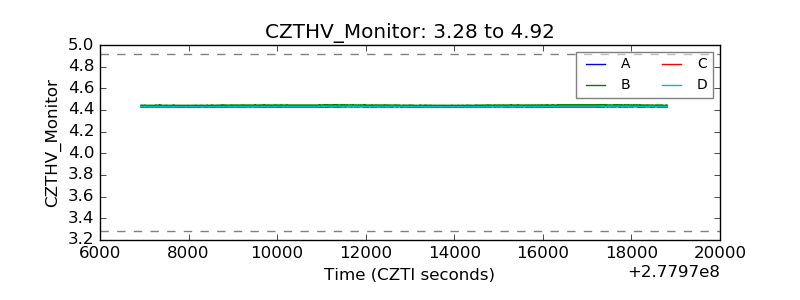 |
| D_VDD | 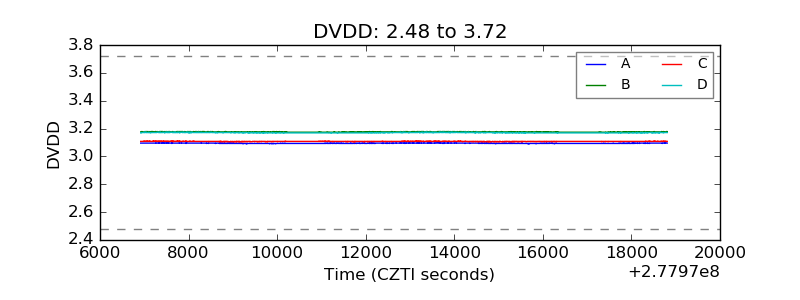 |
| Temperature 1 | 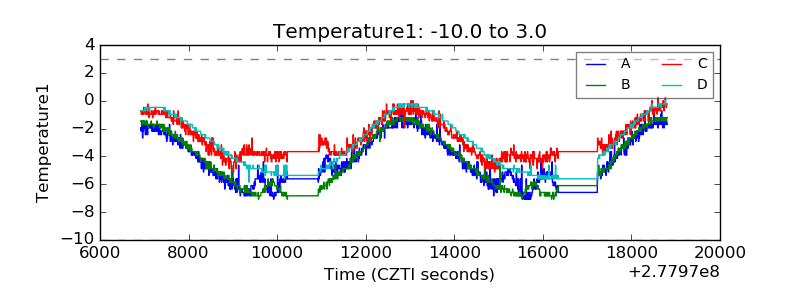 |
| Veto HV Monitor | 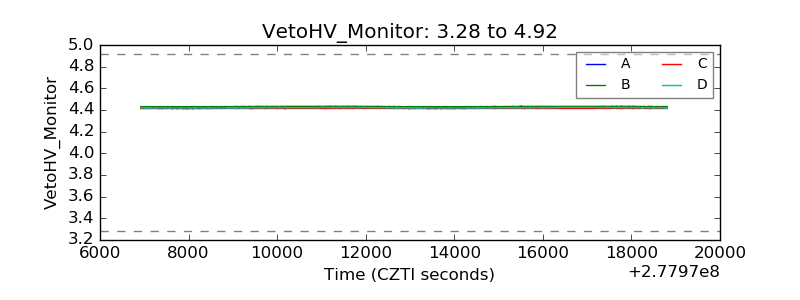 |
| Veto LLD | 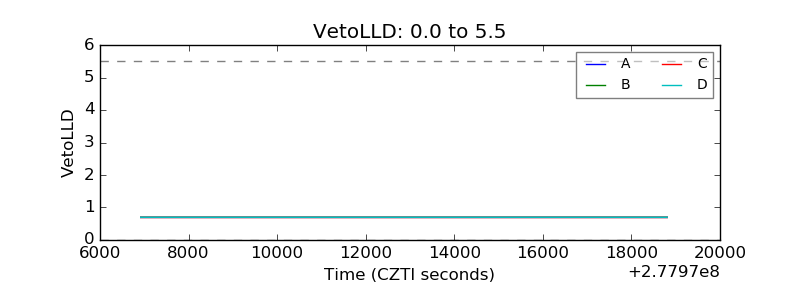 |
| Alpha Counter | 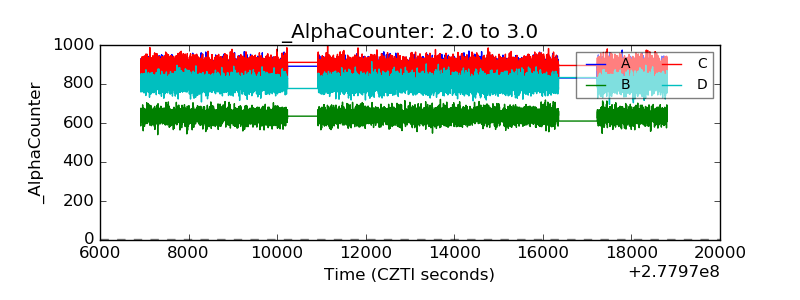 |
| _CPM_Rate | 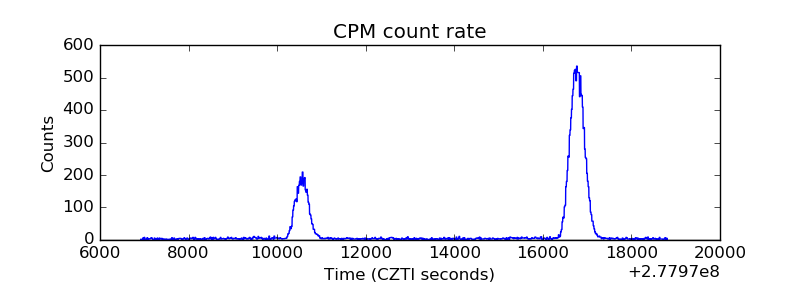 |
| CZT Counter | 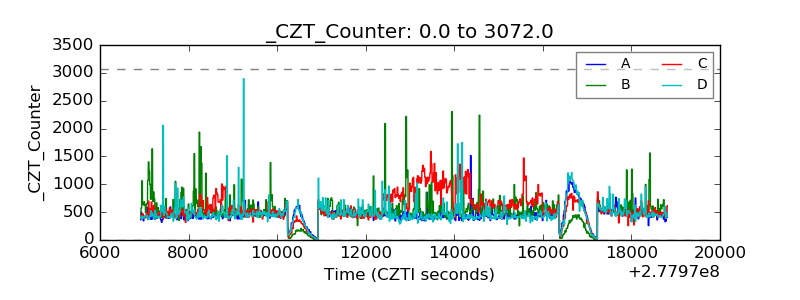 |
| +2.5 Volts monitor |  |
| +5 Volts monitor |  |
| _ROLL_ROT | 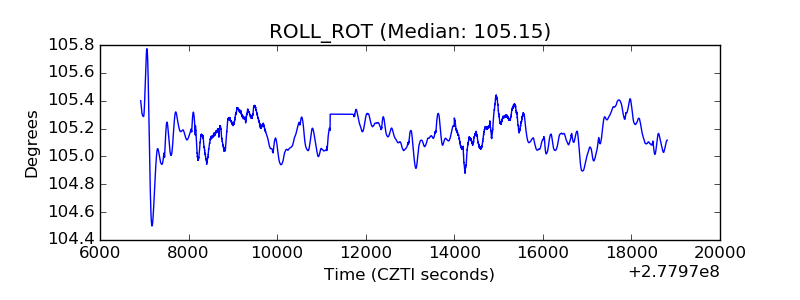 |
| _Roll_DEC | 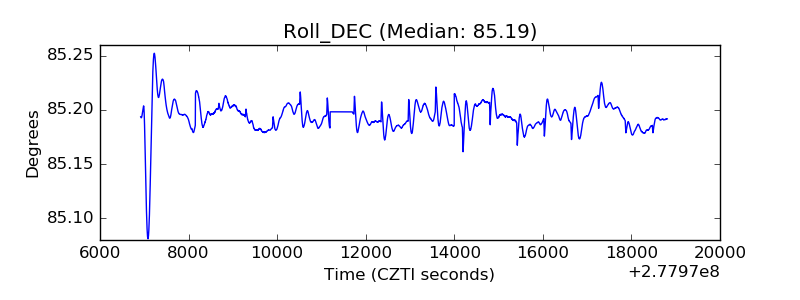 |
| _Roll_RA | 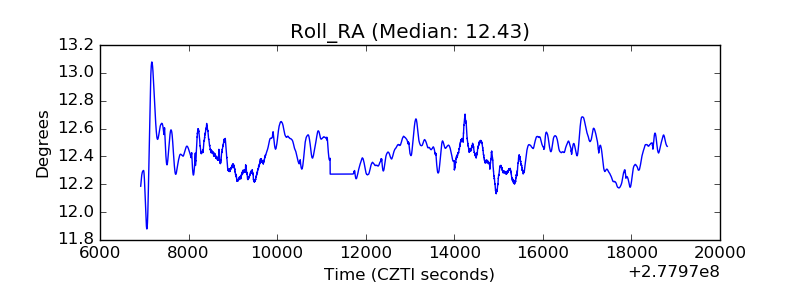 |
| Veto Counter | 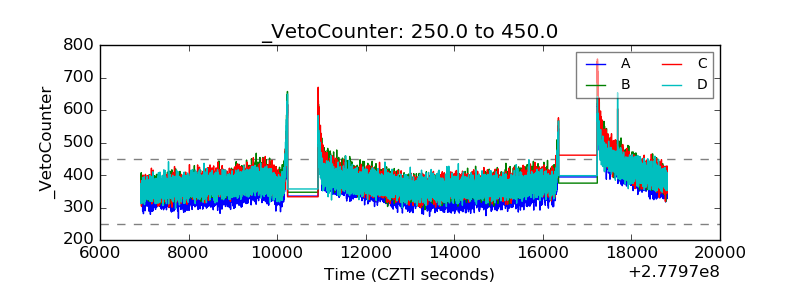 |