| Param | Original file | Final file |
|---|---|---|
| Filename | modeM0/AS1C04_009T01_9000002448_16597cztM0_level2.evt | modeM0/AS1C04_009T01_9000002448_16597cztM0_level2_quad_clean.evt |
| Size (bytes) | 445,855,680 | 119,891,520 |
| Size | 425.2 MB | 114.3 MB |
| Events in quadrant A | 3,084,213 | 807,141 |
| Events in quadrant B | 3,622,762 | 820,740 |
| Events in quadrant C | 3,125,710 | 787,332 |
| Events in quadrant D | 3,235,411 | 769,810 |
| Mode M0 | |||
|---|---|---|---|
| Quadrant | BADHDUFLAG | Total packets | Discarded packets |
| A | 0 | 13450 | 2 |
| B | 0 | 14892 | 1 |
| C | 0 | 13468 | 1 |
| D | 0 | 13920 | 1 |
| Mode SS | |||
|---|---|---|---|
| Quadrant | BADHDUFLAG | Total packets | Discarded packets |
| A | 0 | 130 | 0 |
| B | 0 | 130 | 0 |
| C | 0 | 130 | 0 |
| D | 0 | 130 | 0 |
| Mode M9 | |||
|---|---|---|---|
| Quadrant | BADHDUFLAG | Total packets | Discarded packets |
| A | 0 | 10 | 0 |
| B | 0 | 10 | 0 |
| C | 0 | 10 | 0 |
| D | 0 | 10 | 0 |
| Quadrant | Total seconds | Saturated seconds | Saturation percentage |
|---|---|---|---|
| A | 6396 | 72 | 1.125704% |
| B | 6396 | 92 | 1.438399% |
| C | 6396 | 47 | 0.734834% |
| D | 6396 | 78 | 1.219512% |
Noise dominated data is calculated using 1-second bins in cleaned event files. If a bin has >2000 counts, and if more than 50% of those come from <1% of pixels, then it is considered to be noise-dominated and hence unusable.
| Quadrant | # 1 sec bins | Bins with >0 counts | Bins with >2000 counts | High rate bins dominated by noise | Noise dominated (total time) | Noise dominated (detector-on time) | Marked lightcurve |
|---|---|---|---|---|---|---|---|
| A | 7412 | 6398 | 19 | 19 | 0.26% | 0.30% | 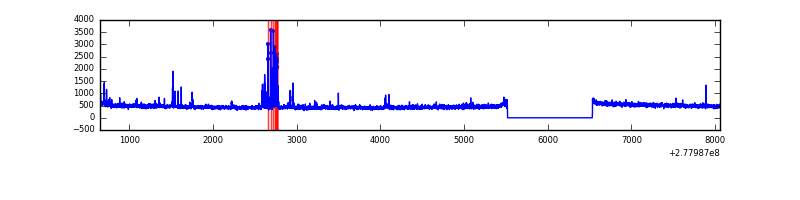 |
| B | 7412 | 6398 | 27 | 27 | 0.36% | 0.42% | 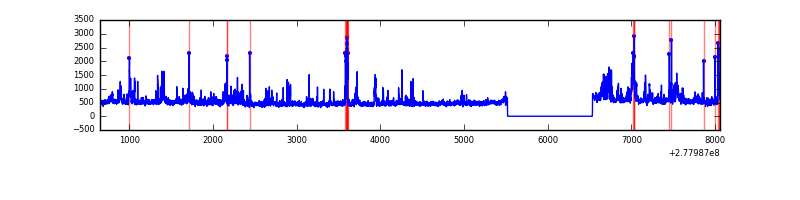 |
| C | 7412 | 6398 | 0 | 0 | 0.00% | 0.00% | 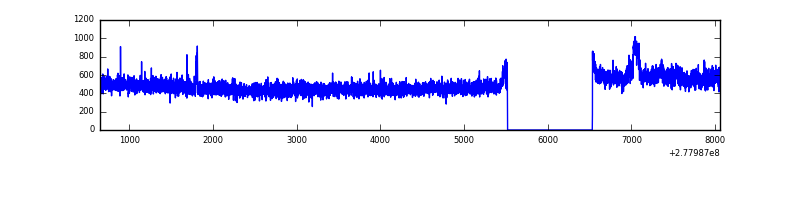 |
| D | 7412 | 6398 | 32 | 32 | 0.43% | 0.50% | 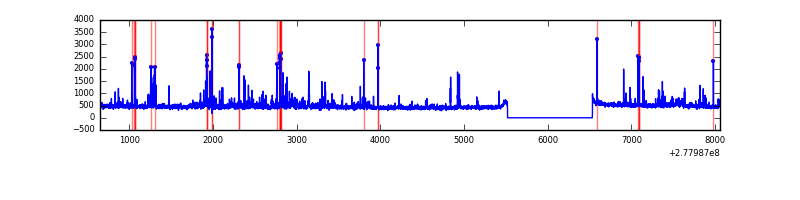 |
Top three noisy pixels from each quadrant. If the there are fewer than three noisy pixels in the level2.evt file, extra rows are filled as -1
| Pixel properties | Quadrant properties | ||||||
|---|---|---|---|---|---|---|---|
| Quadrant | DetID | PixID | Counts | Sigma | Mean | Median | Sigma |
| A | 9 | 143 | 165516 | 1085.37 | 755 | 739 | 151.8 |
| A | 15 | 174 | 8769 | 52.89 | 755 | 739 | 151.8 |
| A | 3 | 1 | 6832 | 40.13 | 755 | 739 | 151.8 |
| B | 15 | 35 | 187218 | 1310.14 | 754 | 733 | 142.3 |
| B | 4 | 48 | 116314 | 812.01 | 754 | 733 | 142.3 |
| B | 0 | 85 | 113333 | 791.06 | 754 | 733 | 142.3 |
| C | 3 | 233 | 157392 | 928.91 | 725 | 730 | 168.7 |
| C | 14 | 238 | 110698 | 652.04 | 725 | 730 | 168.7 |
| C | 7 | 247 | 15201 | 85.8 | 725 | 730 | 168.7 |
| D | 1 | 52 | 229629 | 1285.01 | 734 | 711 | 178.1 |
| D | 10 | 70 | 113989 | 635.87 | 734 | 711 | 178.1 |
| D | 2 | 120 | 57709 | 319.95 | 734 | 711 | 178.1 |
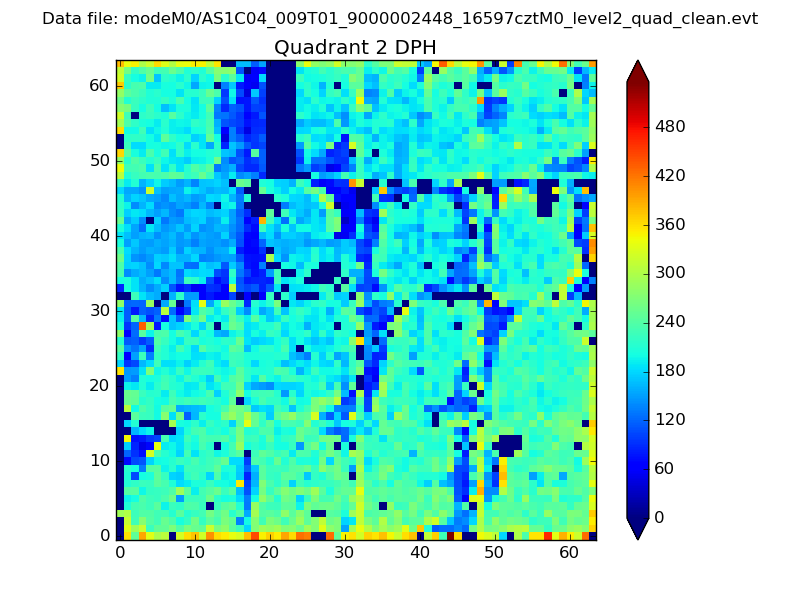
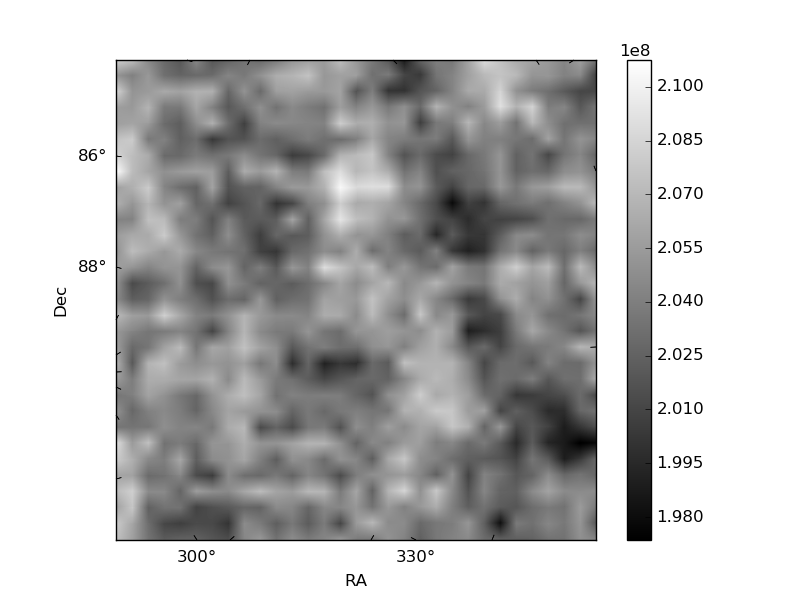
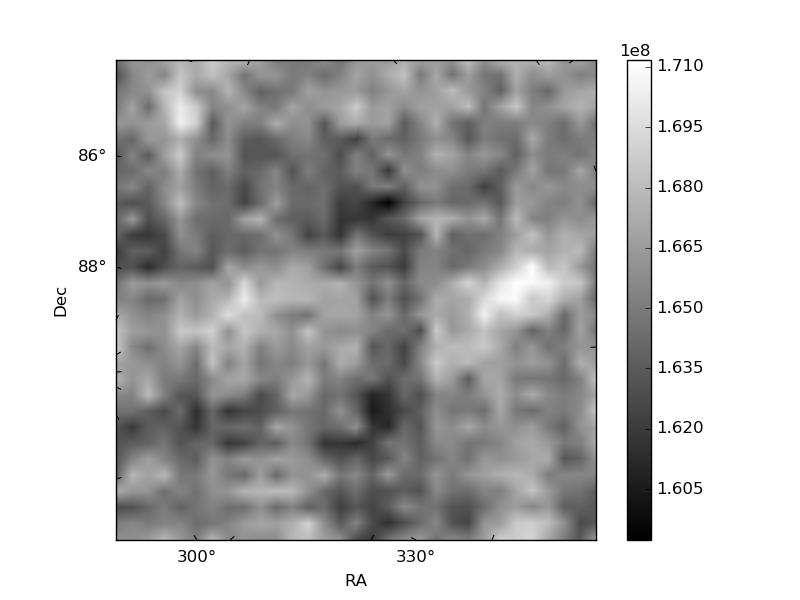
Histogram calculated using DETX and DETY for each event in the final _common_clean file
| Quadrant A | 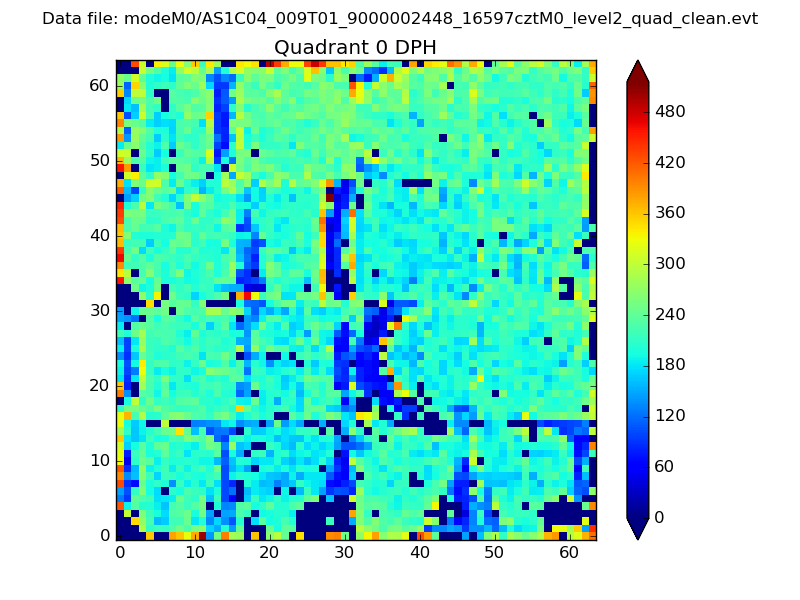 |
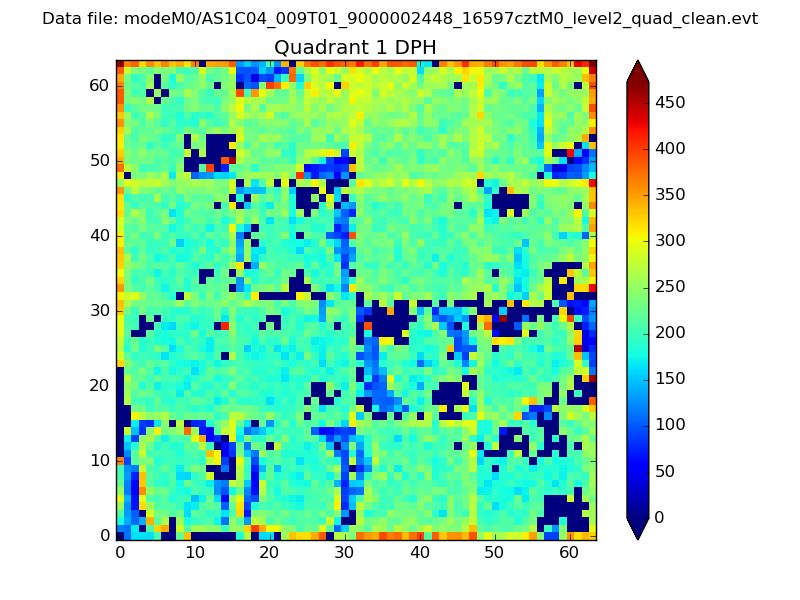 |
Quadrant B |
|---|---|---|---|
| Quadrant D | 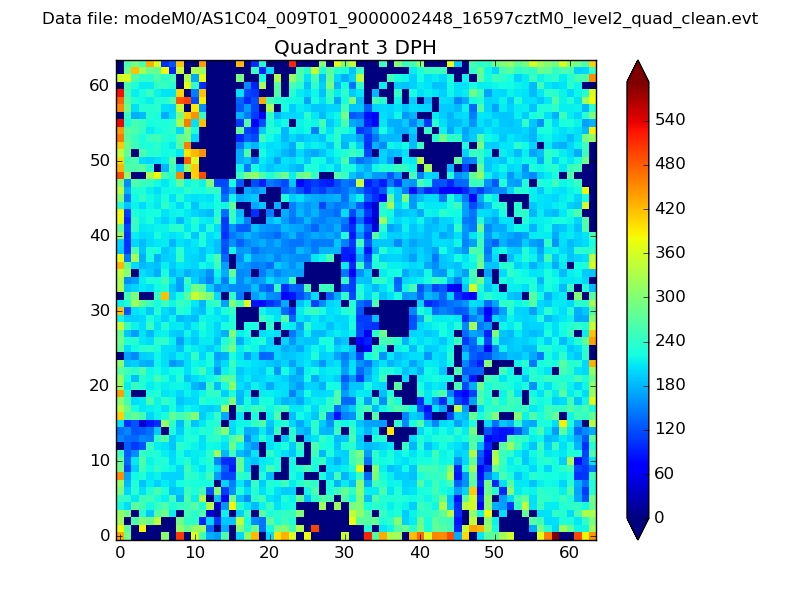 |
 |
Quadrant C |
| Plot type | Count rate plots | Images |
|---|---|---|
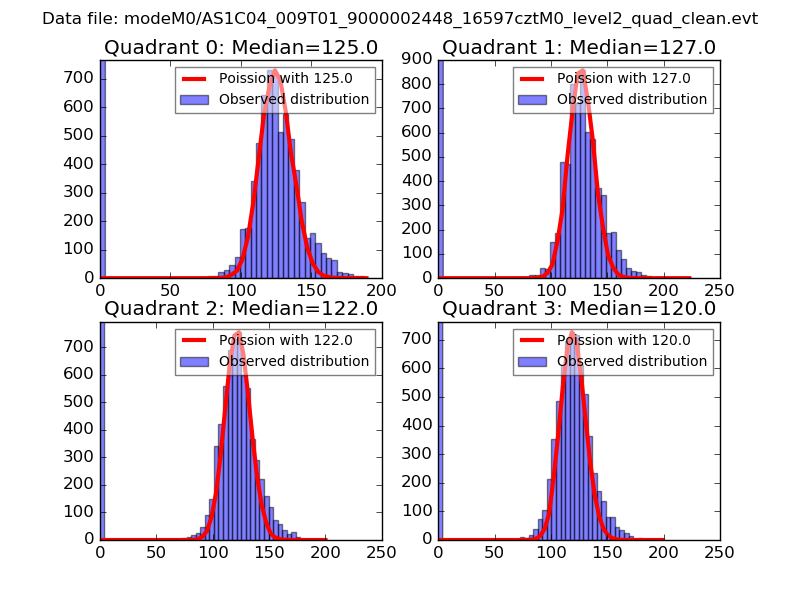
| Comparison with Poisson distribution Blue bars denote a histogram of data divided into 1 sec bins. Red curve is a Poisson curve with rate = median count rate of data. |
 |
 |
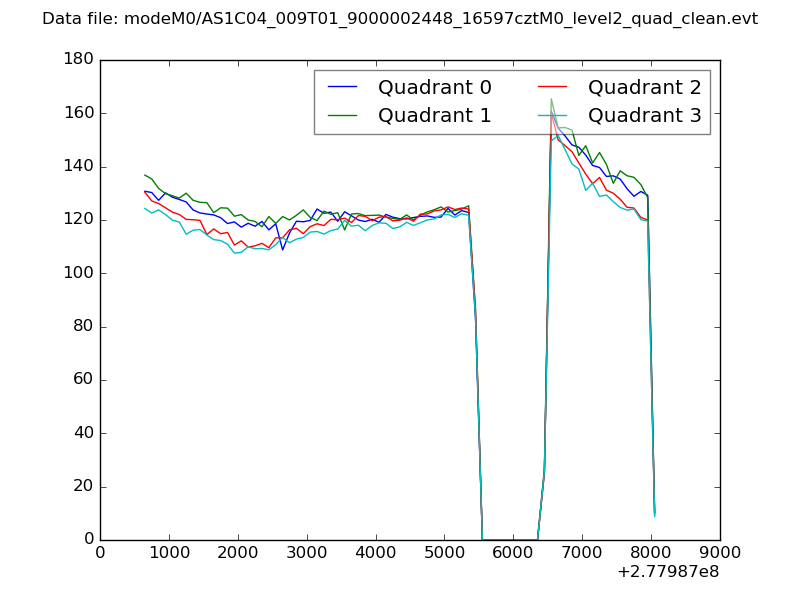
| Quadrant-wise count rates Data is divided into 100 sec bins |
 |
|
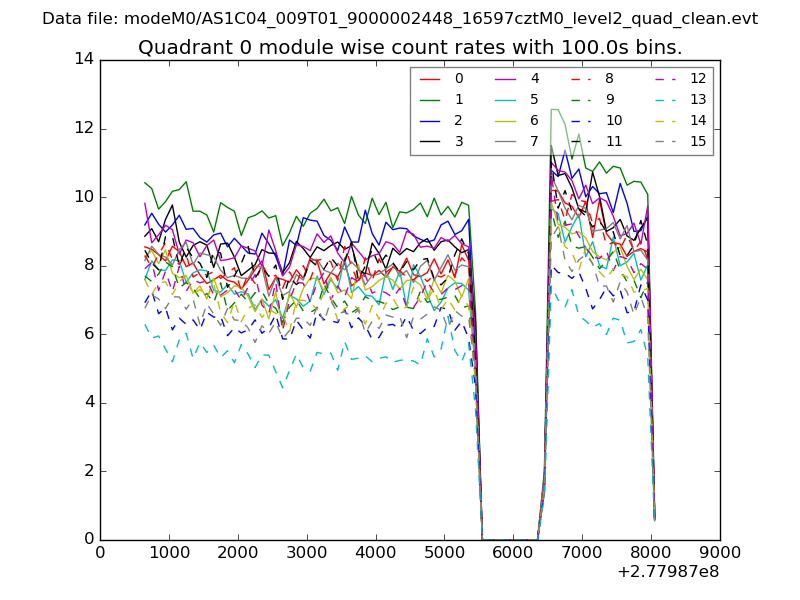
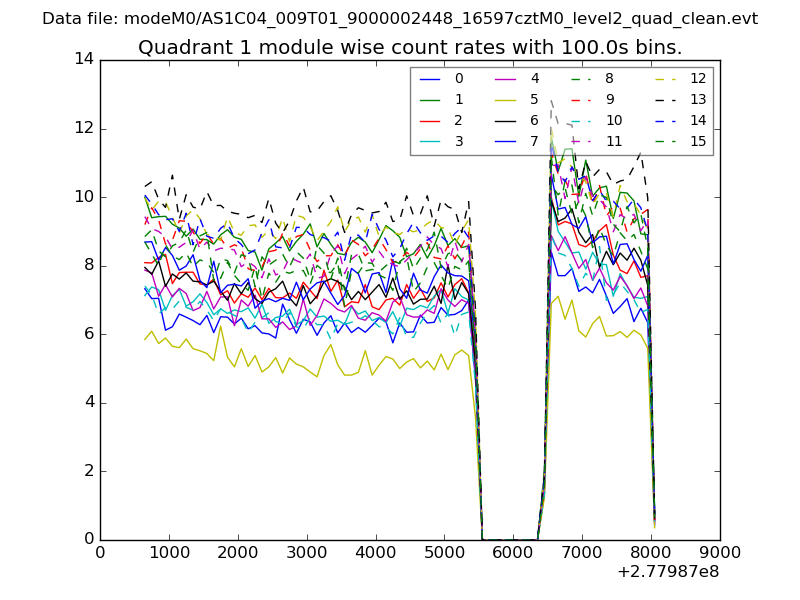
| Module-wise count rates for Quadrant A Data is divided into 100 sec bins |
 |
 |
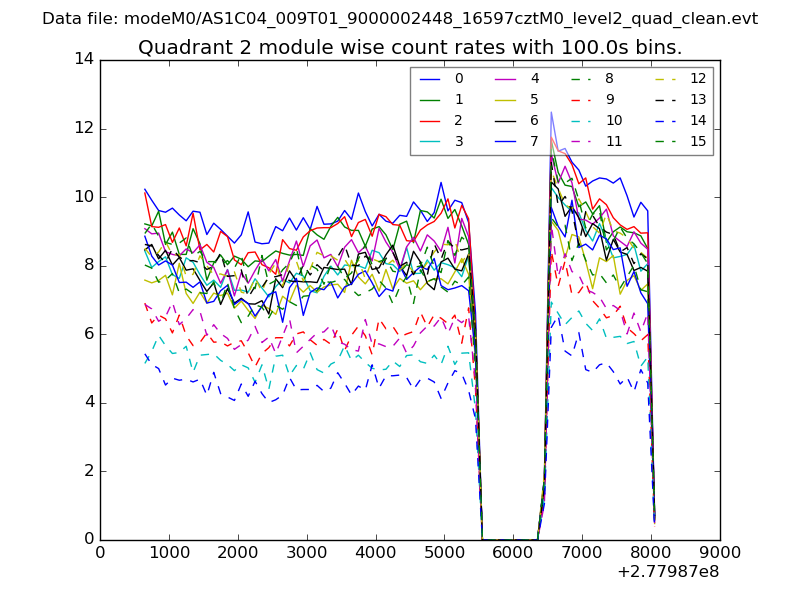
| Module-wise count rates for Quadrant B Data is divided into 100 sec bins |
 |
 |
| Module-wise count rates for Quadrant C Data is divided into 100 sec bins |
 |
 |
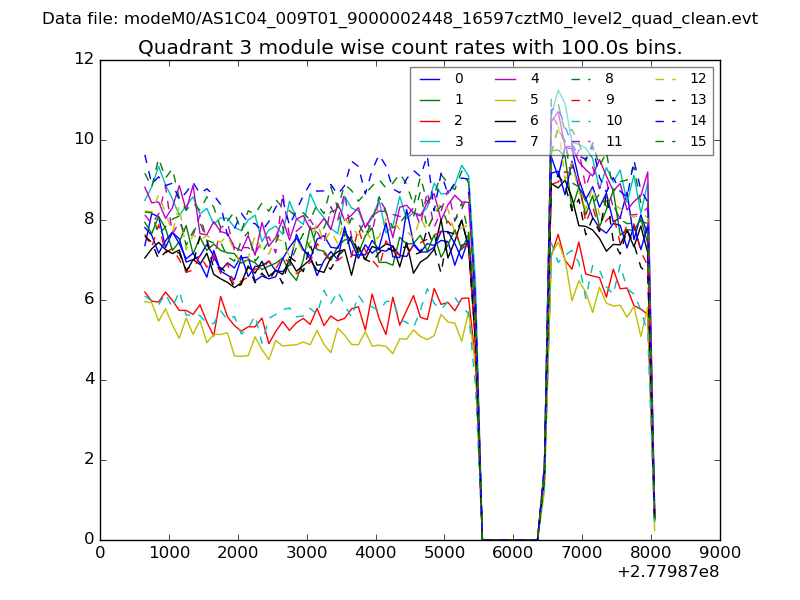
| Module-wise count rates for Quadrant D Data is divided into 100 sec bins |
 |
 |
| Parameter | Plot |
|---|---|
| CZT HV Monitor | 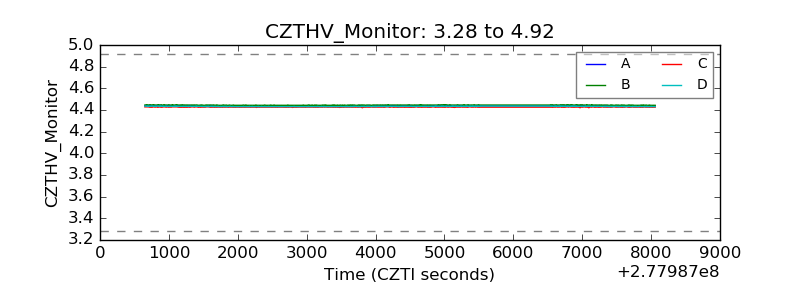 |
| D_VDD | 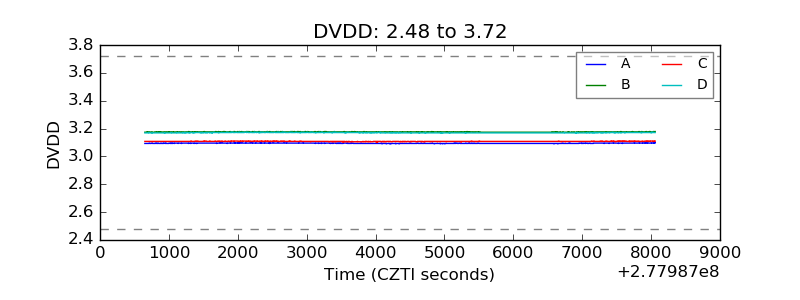 |
| Temperature 1 | 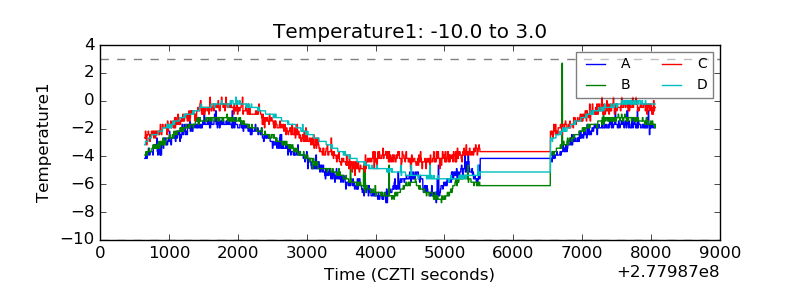 |
| Veto HV Monitor | 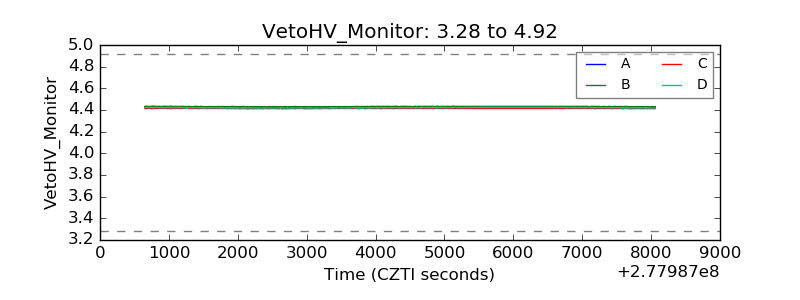 |
| Veto LLD | 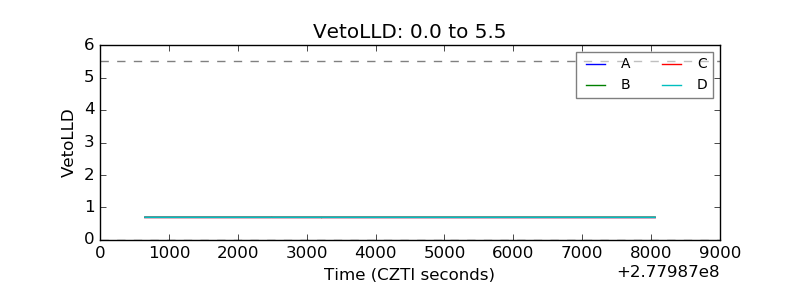 |
| Alpha Counter | 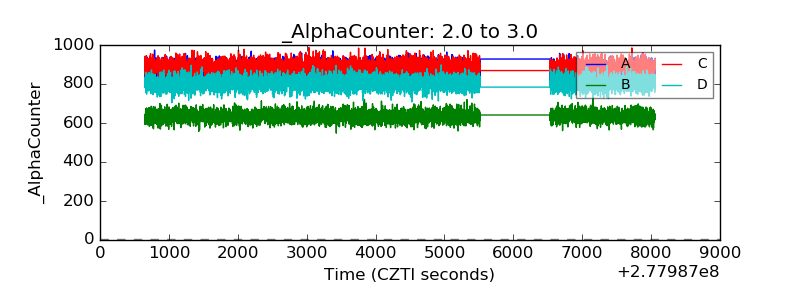 |
| _CPM_Rate | 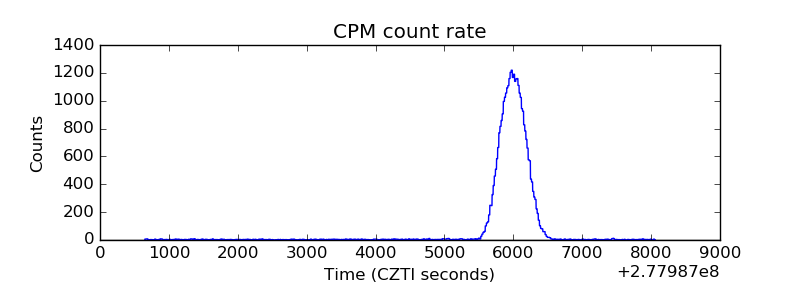 |
| CZT Counter | 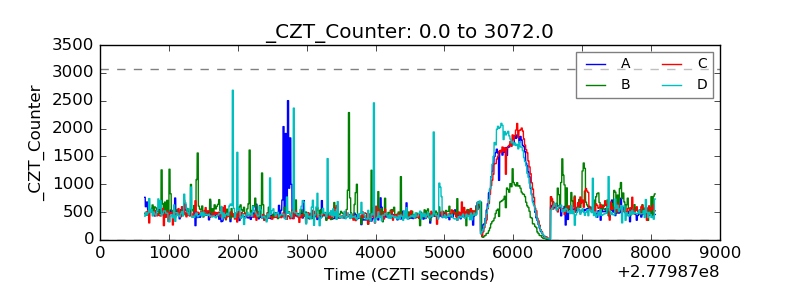 |
| +2.5 Volts monitor |  |
| +5 Volts monitor |  |
| _ROLL_ROT | 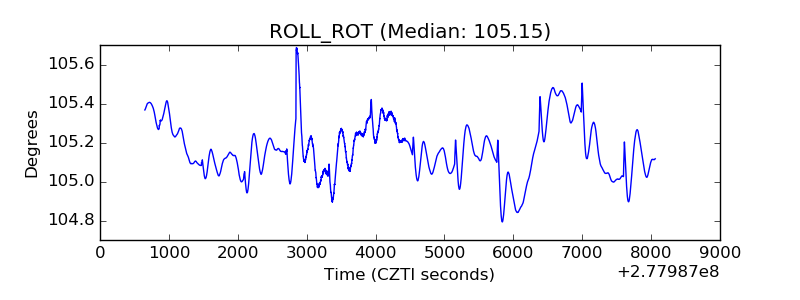 |
| _Roll_DEC | 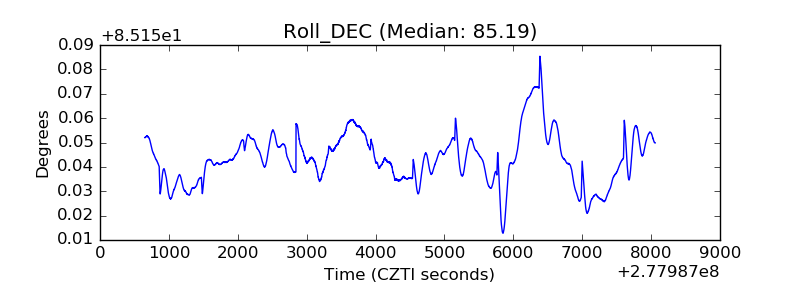 |
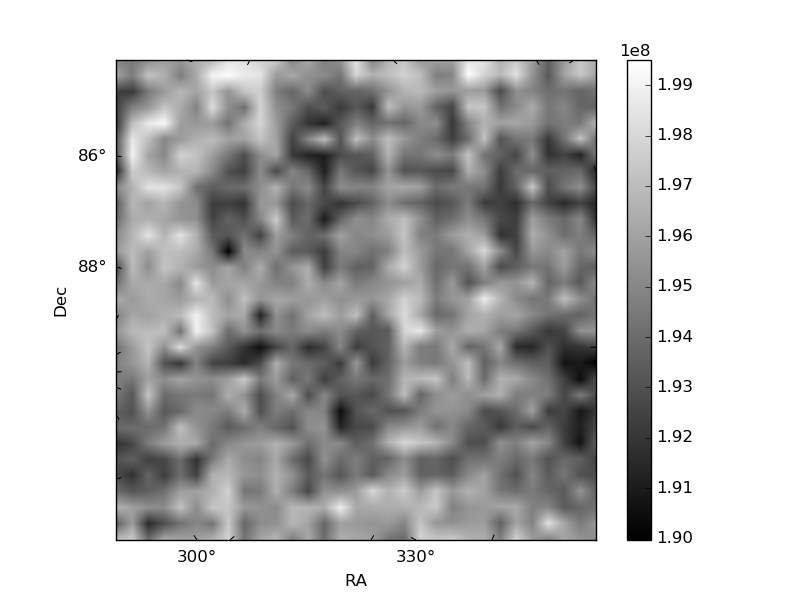
| _Roll_RA |  |
| Veto Counter | 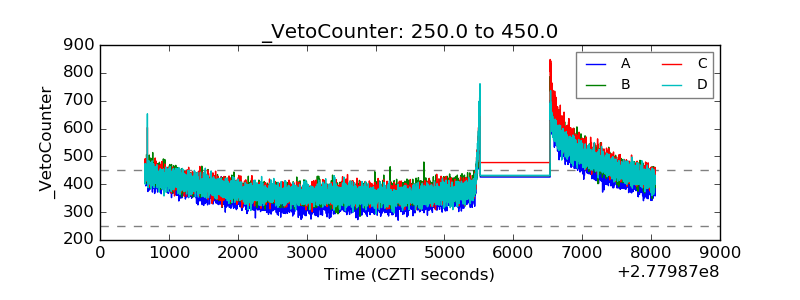 |