| Param | Original file | Final file |
|---|---|---|
| Filename | modeM0/AS1C04_009T01_9000002448_16600cztM0_level2.evt | modeM0/AS1C04_009T01_9000002448_16600cztM0_level2_quad_clean.evt |
| Size (bytes) | 437,230,080 | 124,439,040 |
| Size | 417.0 MB | 118.7 MB |
| Events in quadrant A | 3,120,087 | 840,059 |
| Events in quadrant B | 3,478,360 | 858,280 |
| Events in quadrant C | 3,104,596 | 837,237 |
| Events in quadrant D | 3,130,207 | 813,785 |
| Mode M0 | |||
|---|---|---|---|
| Quadrant | BADHDUFLAG | Total packets | Discarded packets |
| A | 0 | 13297 | 2 |
| B | 0 | 14422 | 1 |
| C | 0 | 13186 | 1 |
| D | 0 | 13541 | 1 |
| Mode SS | |||
|---|---|---|---|
| Quadrant | BADHDUFLAG | Total packets | Discarded packets |
| A | 0 | 124 | 0 |
| B | 0 | 124 | 0 |
| C | 0 | 124 | 0 |
| D | 0 | 124 | 0 |
| Mode M9 | |||
|---|---|---|---|
| Quadrant | BADHDUFLAG | Total packets | Discarded packets |
| A | 0 | 12 | 0 |
| B | 0 | 12 | 0 |
| C | 0 | 12 | 0 |
| D | 0 | 12 | 0 |
| Quadrant | Total seconds | Saturated seconds | Saturation percentage |
|---|---|---|---|
| A | 6004 | 60 | 0.999334% |
| B | 6004 | 119 | 1.982012% |
| C | 6004 | 101 | 1.682212% |
| D | 6004 | 86 | 1.432378% |
Noise dominated data is calculated using 1-second bins in cleaned event files. If a bin has >2000 counts, and if more than 50% of those come from <1% of pixels, then it is considered to be noise-dominated and hence unusable.
| Quadrant | # 1 sec bins | Bins with >0 counts | Bins with >2000 counts | High rate bins dominated by noise | Noise dominated (total time) | Noise dominated (detector-on time) | Marked lightcurve |
|---|---|---|---|---|---|---|---|
| A | 7265 | 6006 | 5 | 5 | 0.07% | 0.08% | 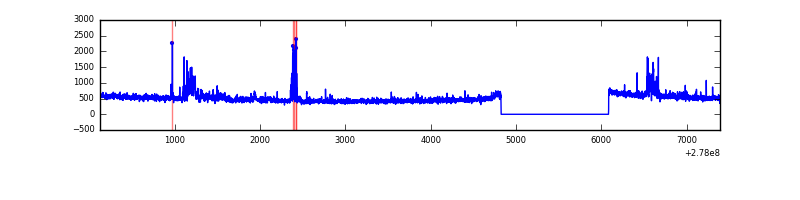 |
| B | 7265 | 6006 | 34 | 34 | 0.47% | 0.57% | 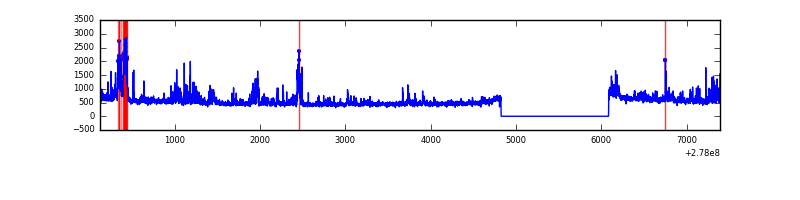 |
| C | 7265 | 6006 | 0 | 0 | 0.00% | 0.00% | 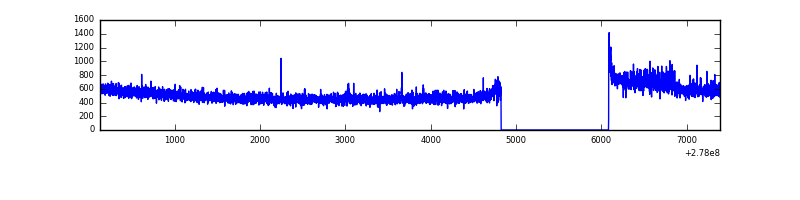 |
| D | 7265 | 6006 | 36 | 36 | 0.50% | 0.60% | 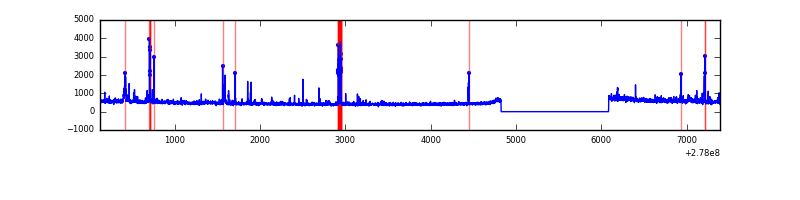 |
Top three noisy pixels from each quadrant. If the there are fewer than three noisy pixels in the level2.evt file, extra rows are filled as -1
| Pixel properties | Quadrant properties | ||||||
|---|---|---|---|---|---|---|---|
| Quadrant | DetID | PixID | Counts | Sigma | Mean | Median | Sigma |
| A | 15 | 174 | 140752 | 948.71 | 744 | 730 | 147.6 |
| A | 15 | 69 | 82209 | 552.06 | 744 | 730 | 147.6 |
| A | 13 | 248 | 13924 | 89.4 | 744 | 730 | 147.6 |
| B | 0 | 85 | 183192 | 1323.08 | 746 | 728 | 137.9 |
| B | 15 | 35 | 136403 | 983.8 | 746 | 728 | 137.9 |
| B | 4 | 48 | 59949 | 429.42 | 746 | 728 | 137.9 |
| C | 14 | 238 | 114948 | 679.28 | 729 | 734 | 168.1 |
| C | 3 | 233 | 78432 | 462.1 | 729 | 734 | 168.1 |
| C | 7 | 247 | 67783 | 398.77 | 729 | 734 | 168.1 |
| D | 10 | 70 | 137918 | 781.77 | 734 | 714 | 175.5 |
| D | 1 | 52 | 111214 | 629.62 | 734 | 714 | 175.5 |
| D | 2 | 33 | 35474 | 198.06 | 734 | 714 | 175.5 |
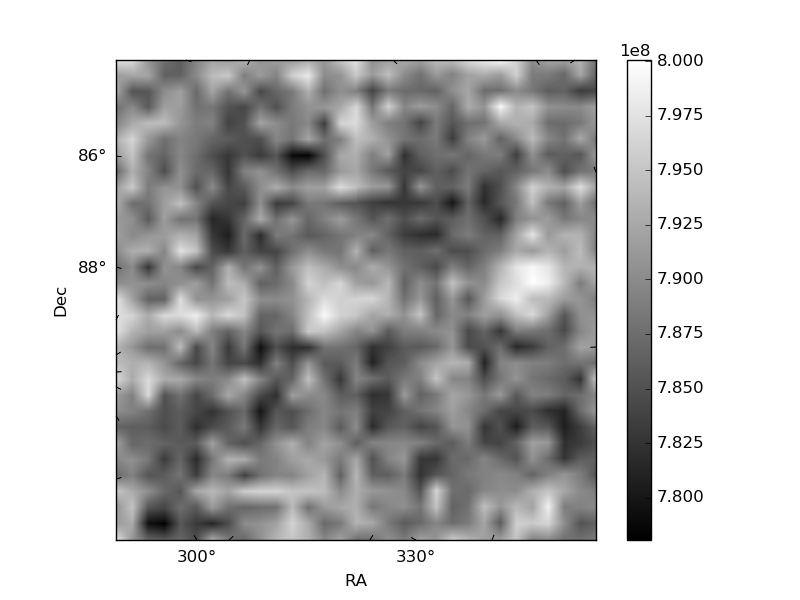
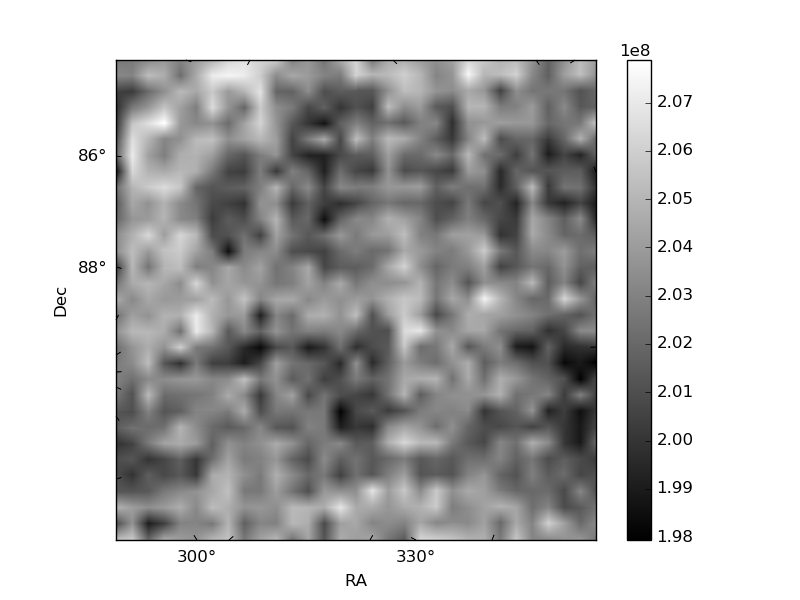
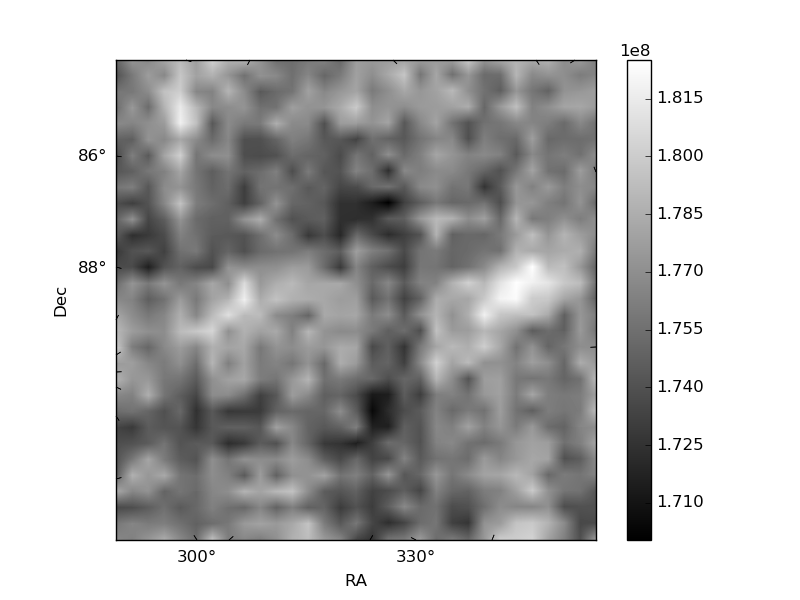
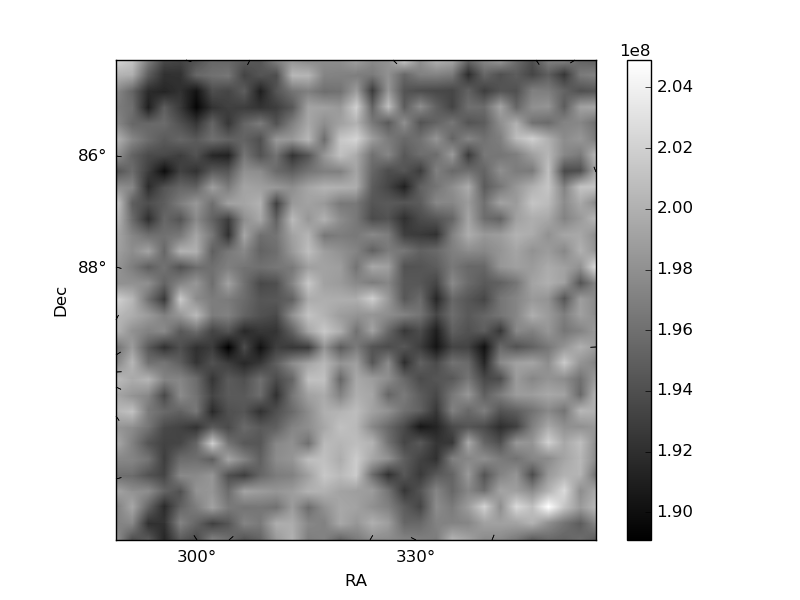
Histogram calculated using DETX and DETY for each event in the final _common_clean file
| Quadrant A | 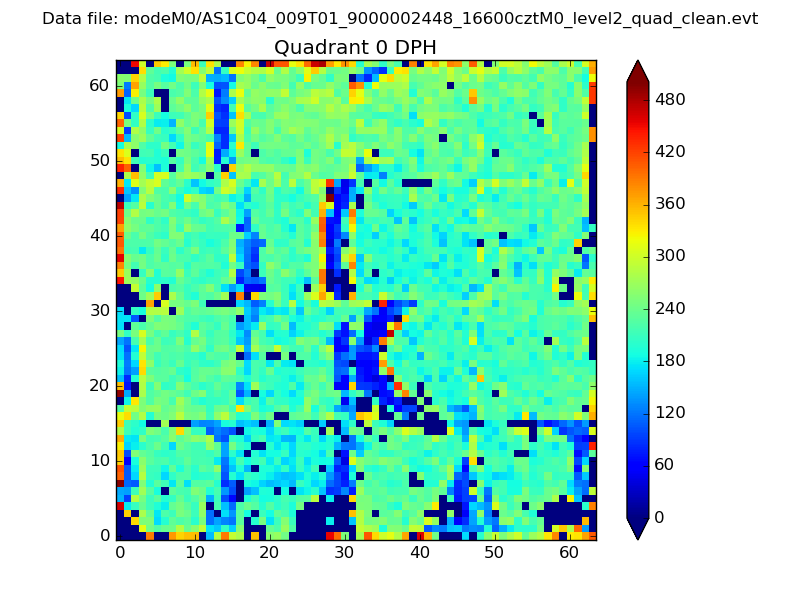 |
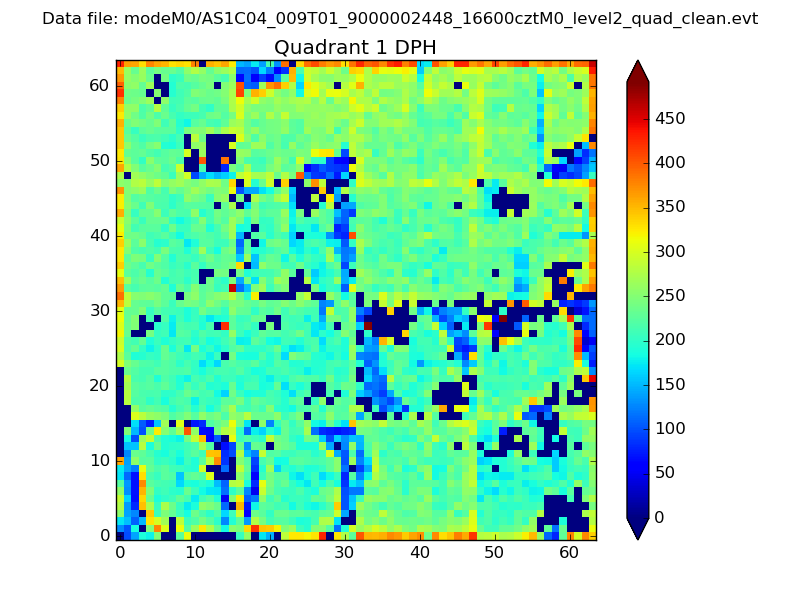 |
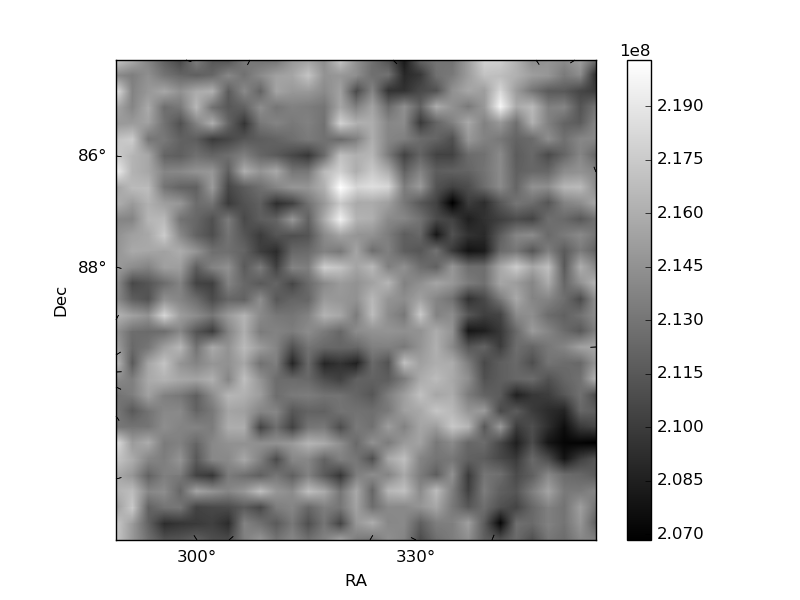
Quadrant B |
|---|---|---|---|
| Quadrant D | 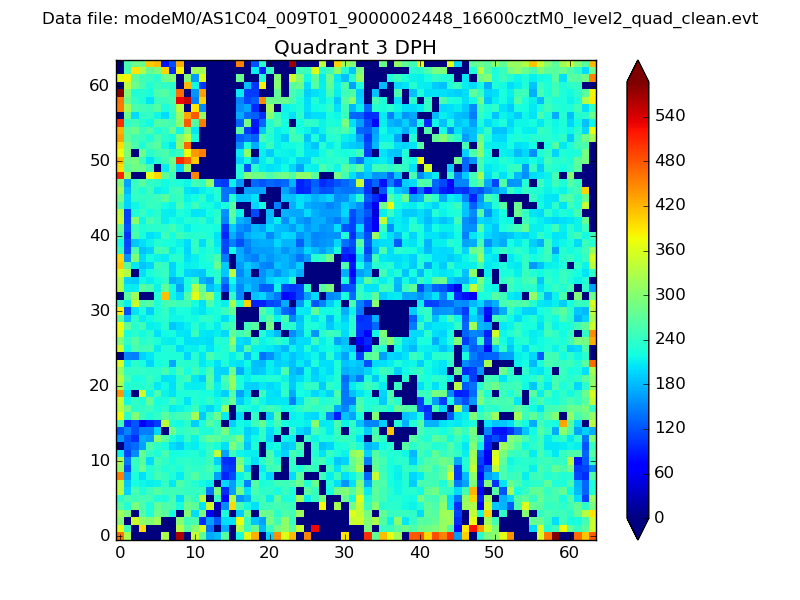 |
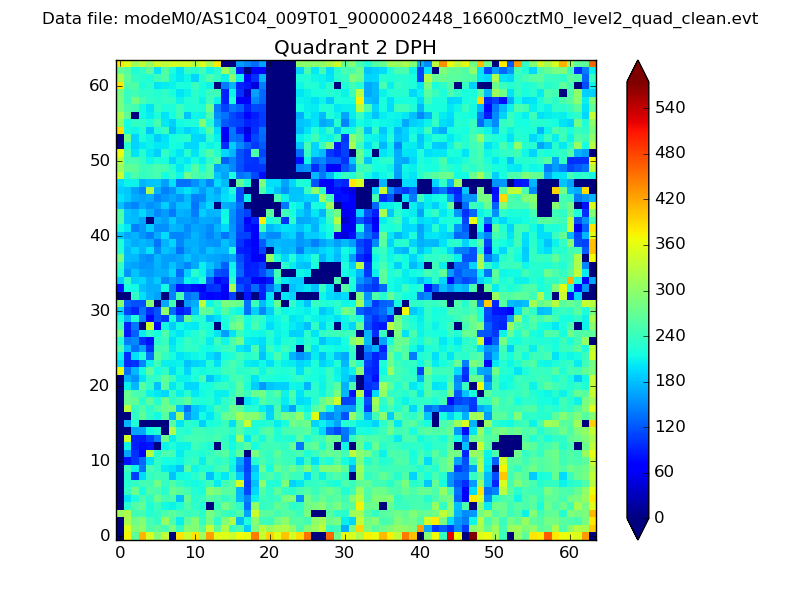 |
Quadrant C |
| Plot type | Count rate plots | Images |
|---|---|---|
| Comparison with Poisson distribution Blue bars denote a histogram of data divided into 1 sec bins. Red curve is a Poisson curve with rate = median count rate of data. |
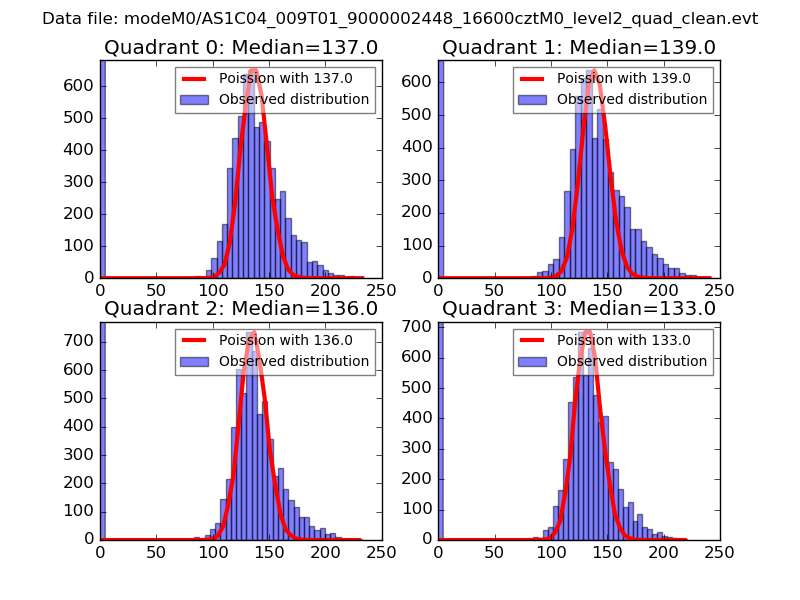 |
 |
| Quadrant-wise count rates Data is divided into 100 sec bins |
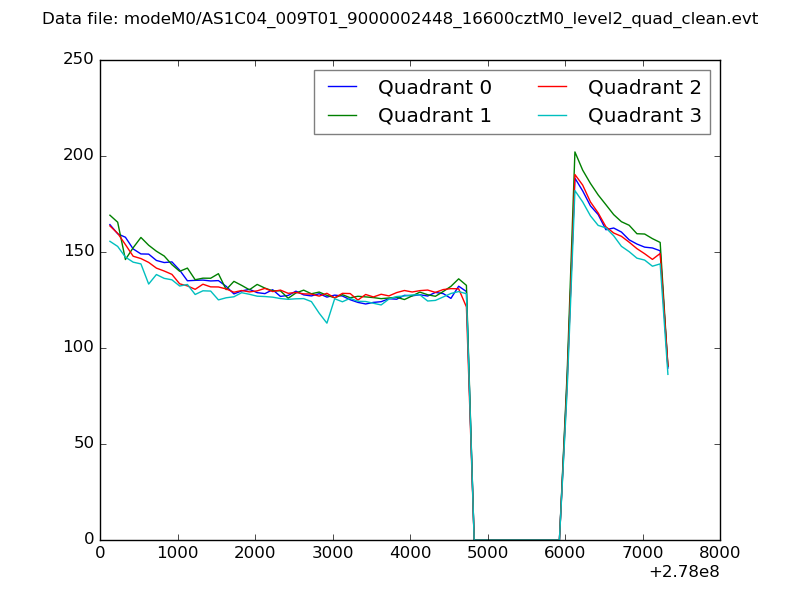 |
|
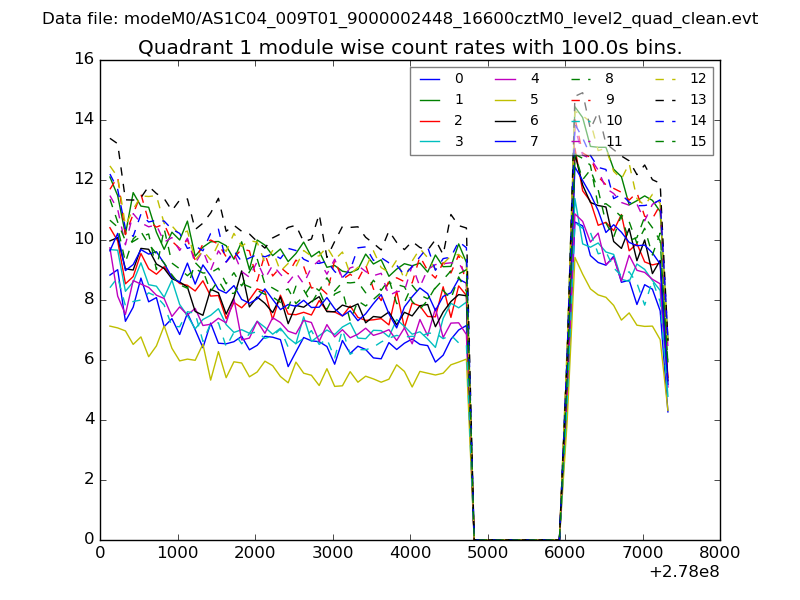
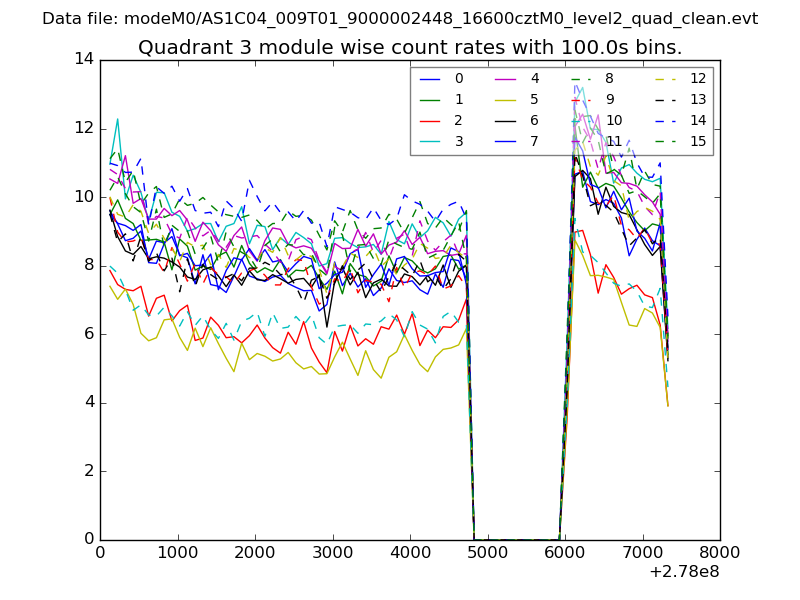
| Module-wise count rates for Quadrant A Data is divided into 100 sec bins |
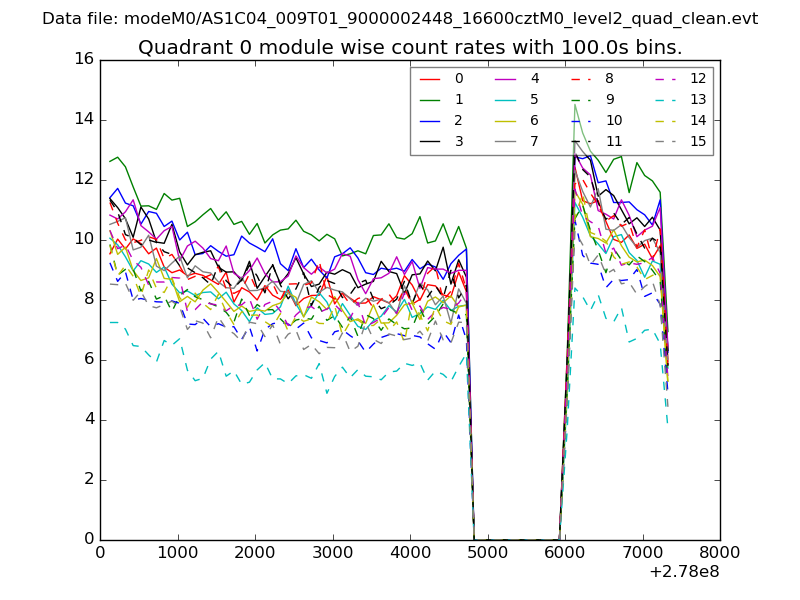 |
 |
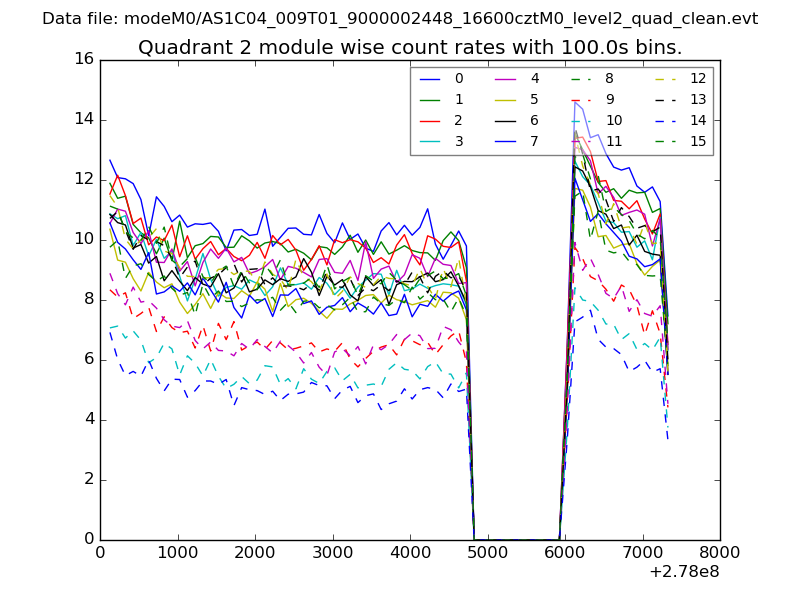
| Module-wise count rates for Quadrant B Data is divided into 100 sec bins |
 |
 |
| Module-wise count rates for Quadrant C Data is divided into 100 sec bins |
 |
 |
| Module-wise count rates for Quadrant D Data is divided into 100 sec bins |
 |
 |
| Parameter | Plot |
|---|---|
| CZT HV Monitor | 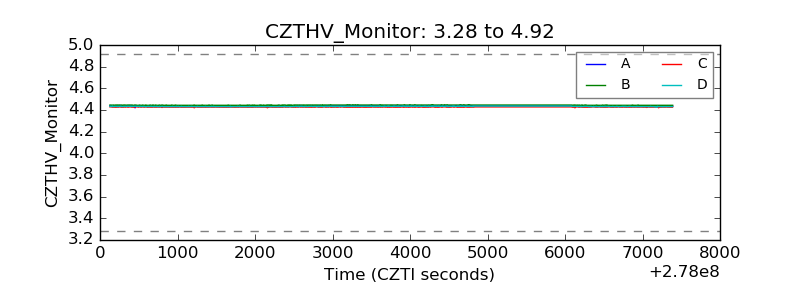 |
| D_VDD | 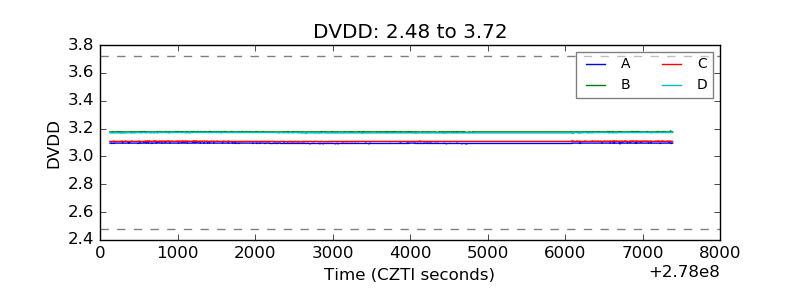 |
| Temperature 1 | 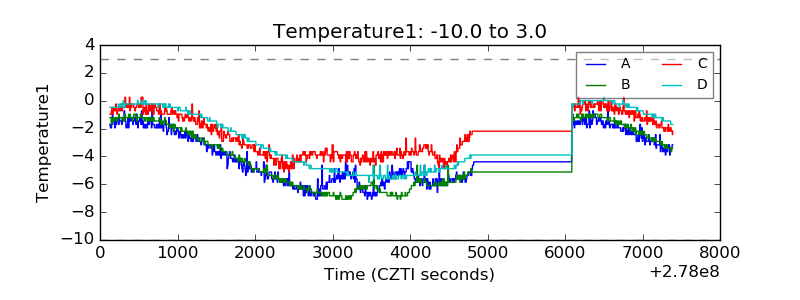 |
| Veto HV Monitor | 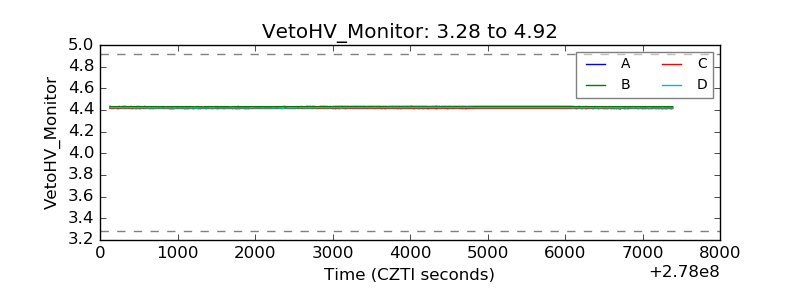 |
| Veto LLD | 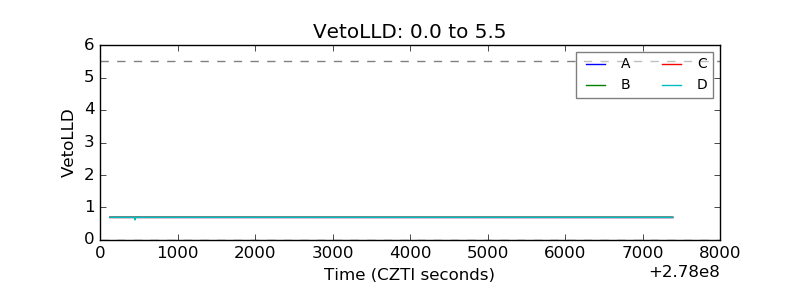 |
| Alpha Counter | 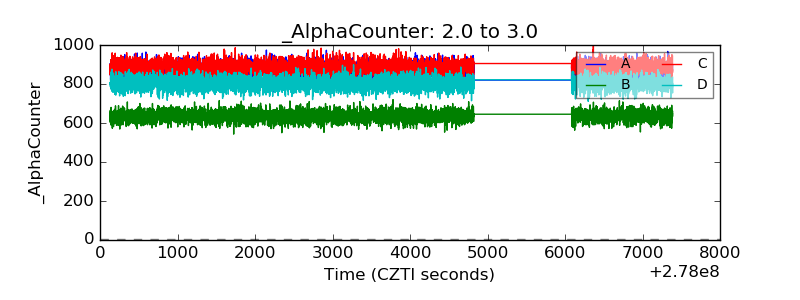 |
| _CPM_Rate | 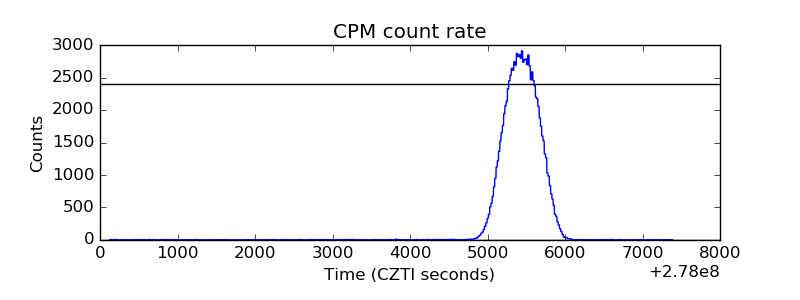 |
| CZT Counter | 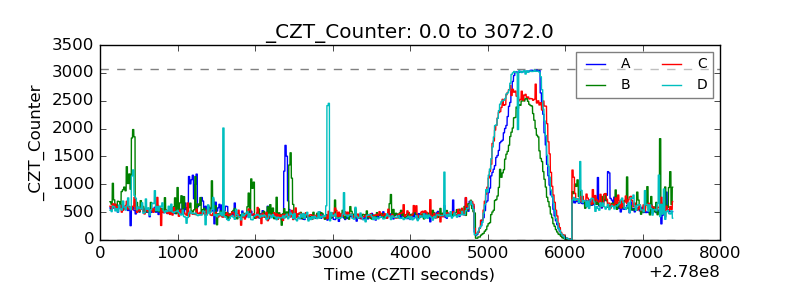 |
| +2.5 Volts monitor | 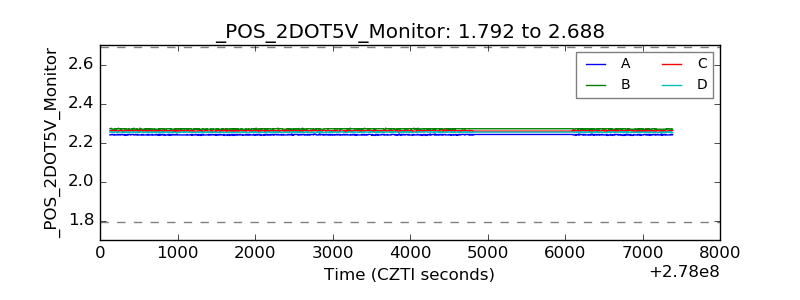 |
| +5 Volts monitor |  |
| _ROLL_ROT | 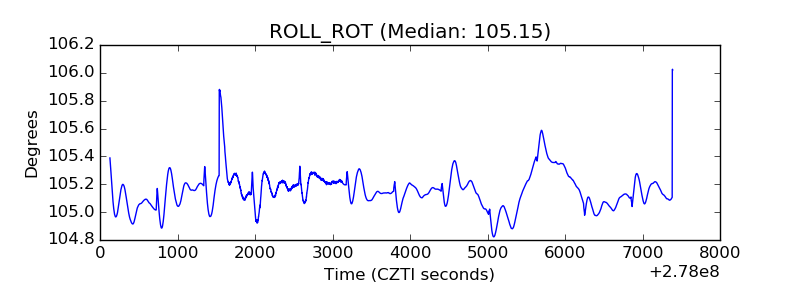 |
| _Roll_DEC | 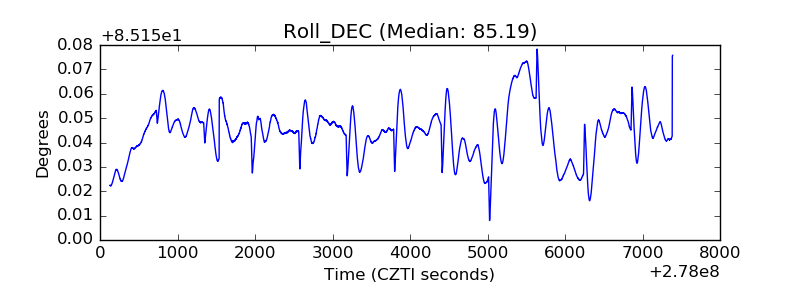 |
| _Roll_RA | 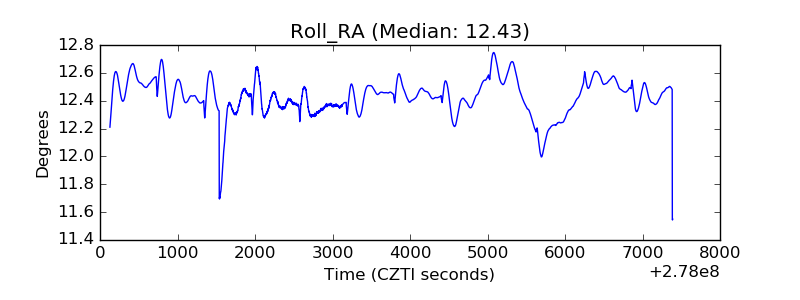 |
| Veto Counter | 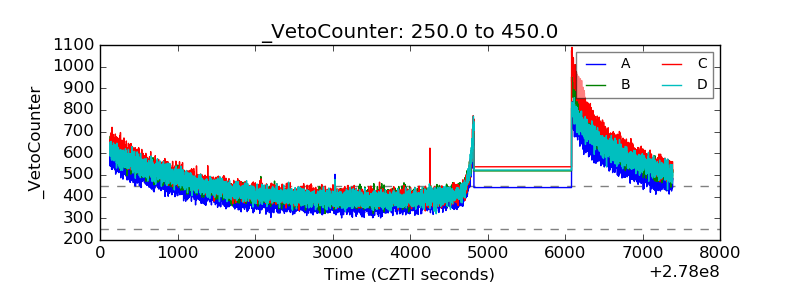 |