| Param | Original file | Final file |
|---|---|---|
| Filename | modeM0/AS1C04_009T01_9000002448_16601cztM0_level2.evt | modeM0/AS1C04_009T01_9000002448_16601cztM0_level2_quad_clean.evt |
| Size (bytes) | 423,797,760 | 125,049,600 |
| Size | 404.2 MB | 119.3 MB |
| Events in quadrant A | 2,952,576 | 840,823 |
| Events in quadrant B | 3,313,035 | 865,785 |
| Events in quadrant C | 3,097,805 | 851,389 |
| Events in quadrant D | 3,074,684 | 821,721 |
| Mode M0 | |||
|---|---|---|---|
| Quadrant | BADHDUFLAG | Total packets | Discarded packets |
| A | 0 | 12678 | 2 |
| B | 0 | 13790 | 1 |
| C | 0 | 13060 | 1 |
| D | 0 | 13270 | 1 |
| Mode SS | |||
|---|---|---|---|
| Quadrant | BADHDUFLAG | Total packets | Discarded packets |
| A | 0 | 118 | 0 |
| B | 0 | 118 | 0 |
| C | 0 | 118 | 0 |
| D | 0 | 118 | 0 |
| Mode M9 | |||
|---|---|---|---|
| Quadrant | BADHDUFLAG | Total packets | Discarded packets |
| A | 0 | 14 | 0 |
| B | 0 | 14 | 0 |
| C | 0 | 14 | 0 |
| D | 0 | 14 | 0 |
| Quadrant | Total seconds | Saturated seconds | Saturation percentage |
|---|---|---|---|
| A | 5839 | 47 | 0.804932% |
| B | 5839 | 54 | 0.924816% |
| C | 5839 | 82 | 1.404350% |
| D | 5839 | 56 | 0.959068% |
Noise dominated data is calculated using 1-second bins in cleaned event files. If a bin has >2000 counts, and if more than 50% of those come from <1% of pixels, then it is considered to be noise-dominated and hence unusable.
| Quadrant | # 1 sec bins | Bins with >0 counts | Bins with >2000 counts | High rate bins dominated by noise | Noise dominated (total time) | Noise dominated (detector-on time) | Marked lightcurve |
|---|---|---|---|---|---|---|---|
| A | 7185 | 5841 | 6 | 6 | 0.08% | 0.10% | 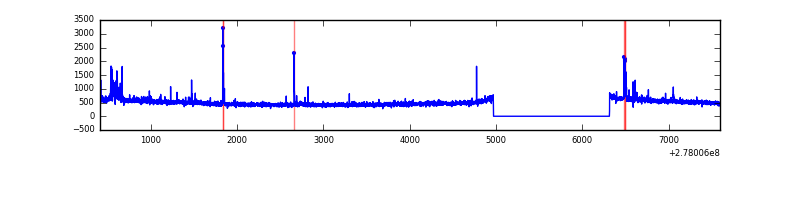 |
| B | 7185 | 5841 | 8 | 8 | 0.11% | 0.14% | 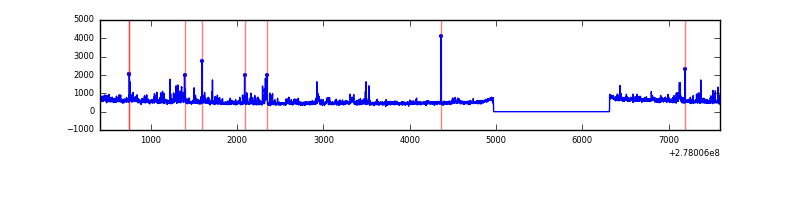 |
| C | 7185 | 5841 | 0 | 0 | 0.00% | 0.00% | 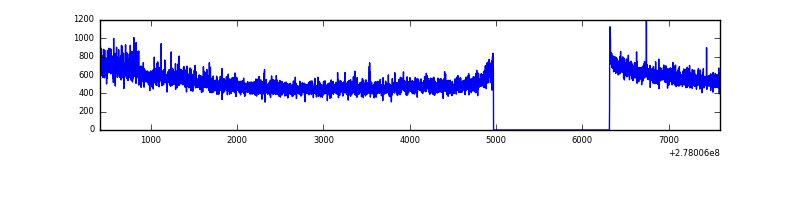 |
| D | 7185 | 5841 | 25 | 25 | 0.35% | 0.43% | 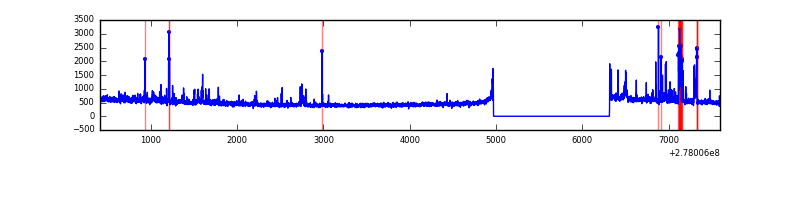 |
Top three noisy pixels from each quadrant. If the there are fewer than three noisy pixels in the level2.evt file, extra rows are filled as -1
| Pixel properties | Quadrant properties | ||||||
|---|---|---|---|---|---|---|---|
| Quadrant | DetID | PixID | Counts | Sigma | Mean | Median | Sigma |
| A | 15 | 174 | 96433 | 668.03 | 728 | 716 | 143.3 |
| A | 9 | 143 | 25929 | 175.97 | 728 | 716 | 143.3 |
| A | 15 | 69 | 12243 | 80.45 | 728 | 716 | 143.3 |
| B | 15 | 35 | 136865 | 1018.2 | 737 | 721 | 133.7 |
| B | 0 | 85 | 61370 | 453.58 | 737 | 721 | 133.7 |
| B | 4 | 48 | 42630 | 313.43 | 737 | 721 | 133.7 |
| C | 3 | 233 | 122539 | 729.98 | 723 | 729 | 166.9 |
| C | 14 | 238 | 113177 | 673.88 | 723 | 729 | 166.9 |
| C | 7 | 247 | 42264 | 248.91 | 723 | 729 | 166.9 |
| D | 2 | 16 | 111681 | 637.44 | 724 | 703 | 174.1 |
| D | 1 | 52 | 83703 | 476.74 | 724 | 703 | 174.1 |
| D | 10 | 70 | 48291 | 273.34 | 724 | 703 | 174.1 |
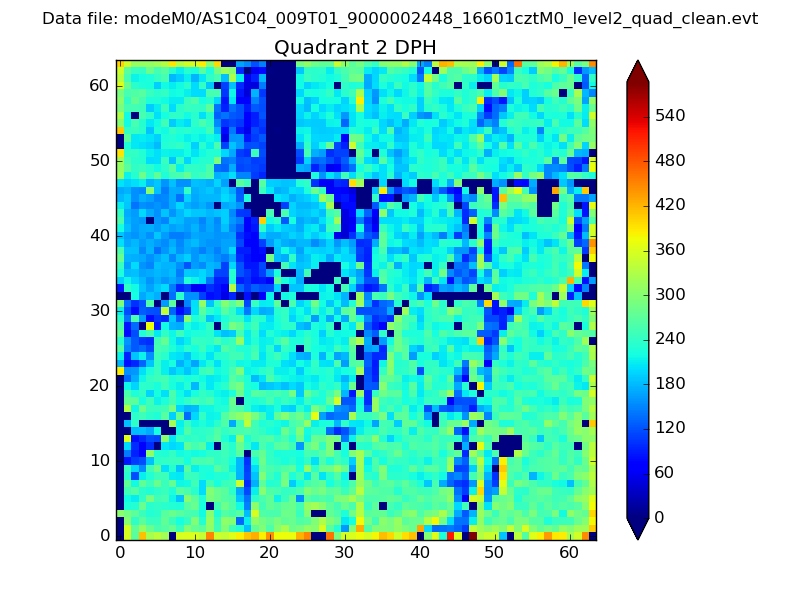
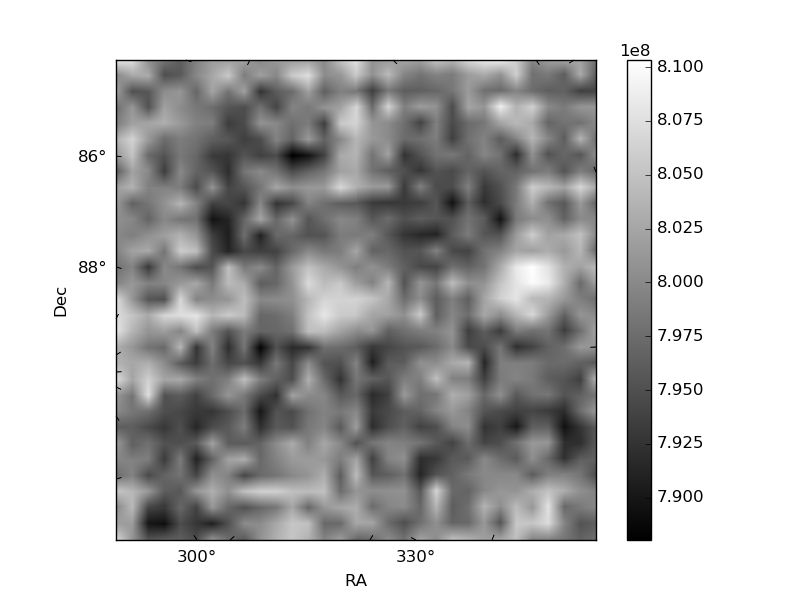
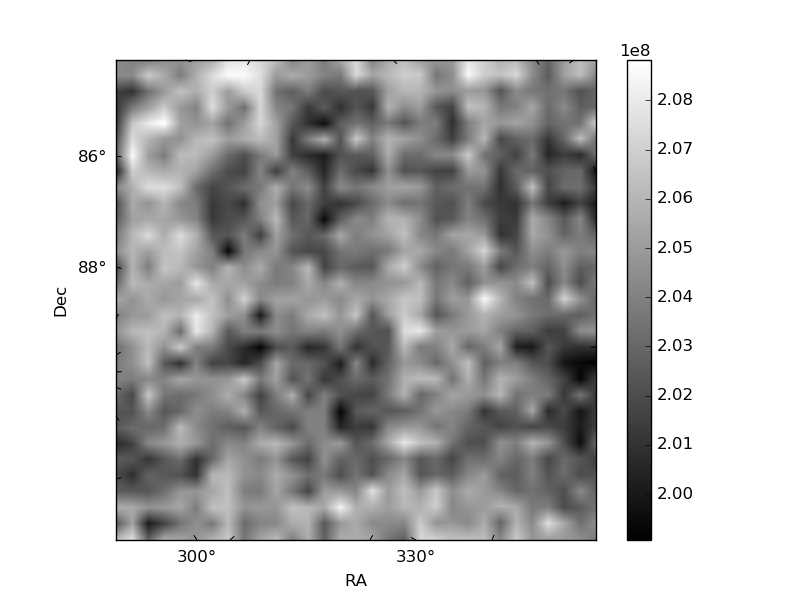
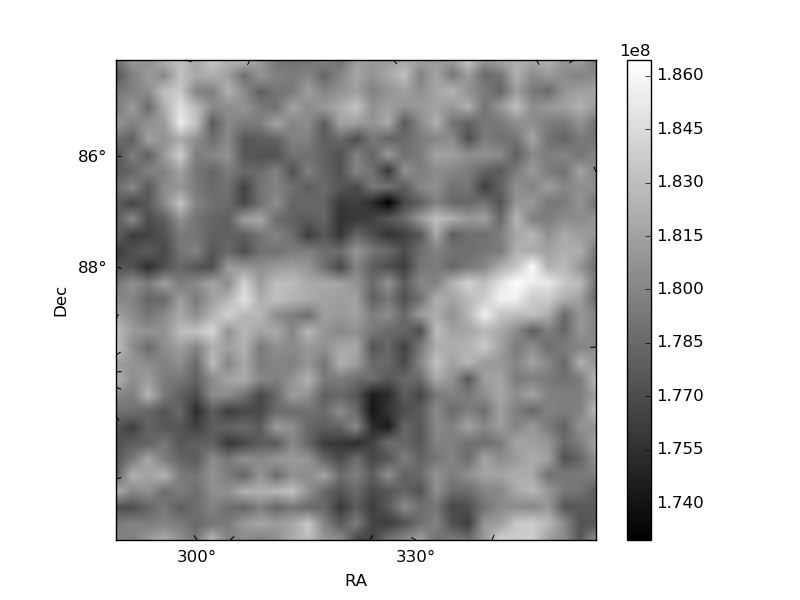
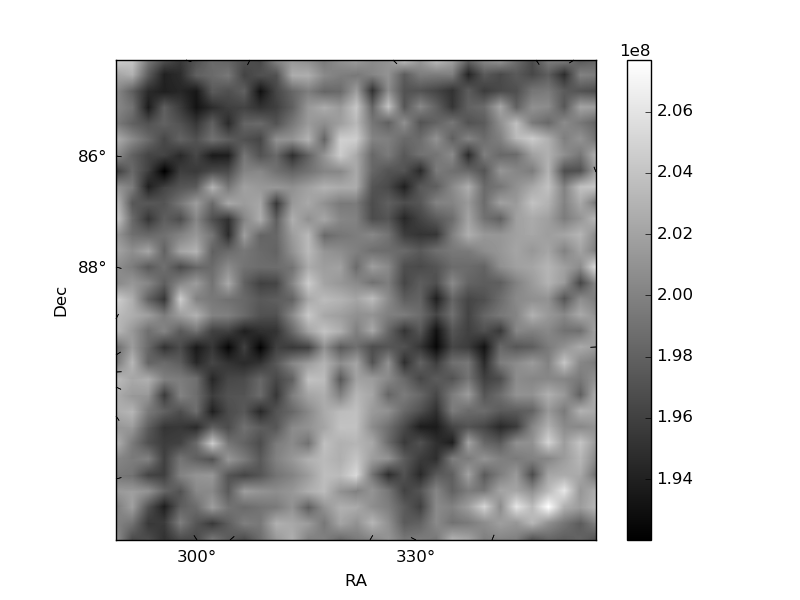
Histogram calculated using DETX and DETY for each event in the final _common_clean file
| Quadrant A | 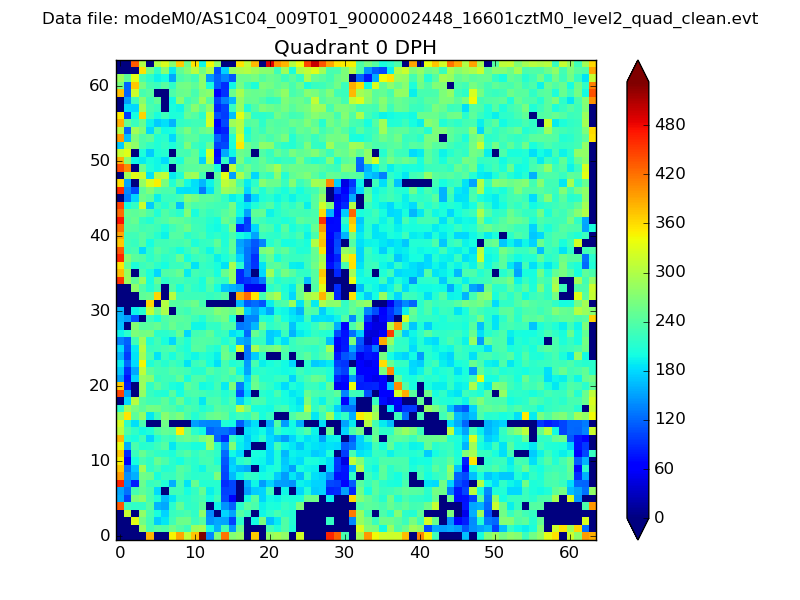 |
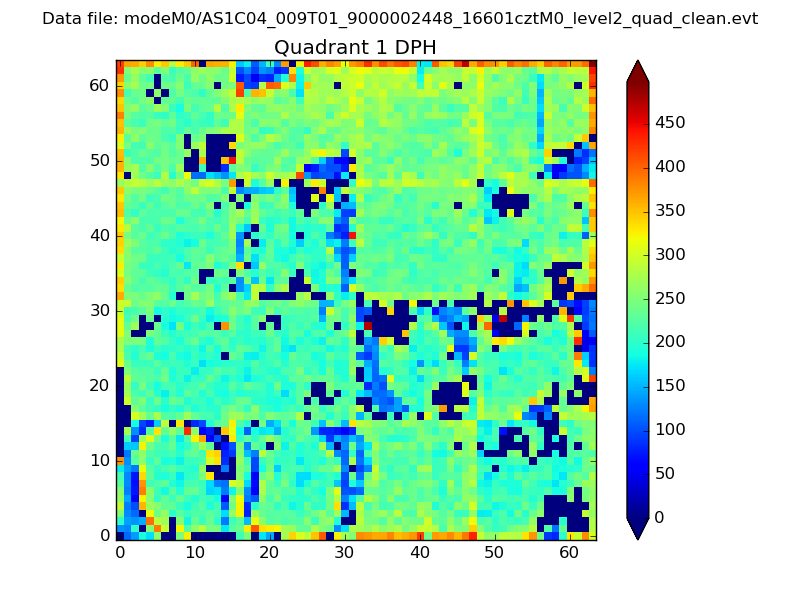 |
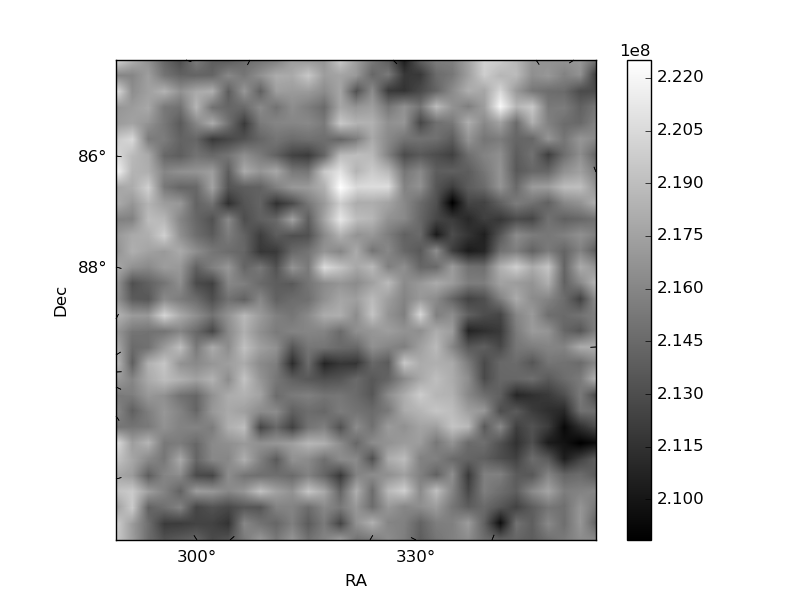
Quadrant B |
|---|---|---|---|
| Quadrant D | 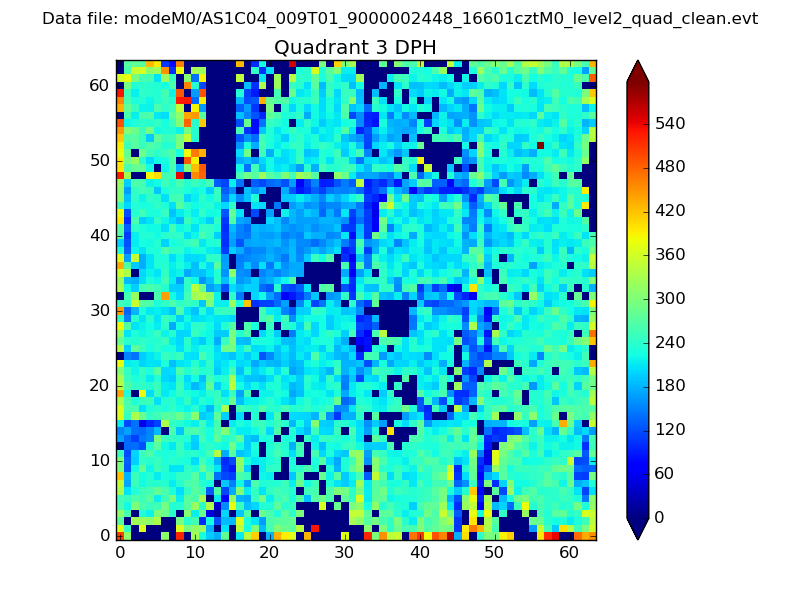 |
 |
Quadrant C |
| Plot type | Count rate plots | Images |
|---|---|---|
| Comparison with Poisson distribution Blue bars denote a histogram of data divided into 1 sec bins. Red curve is a Poisson curve with rate = median count rate of data. |
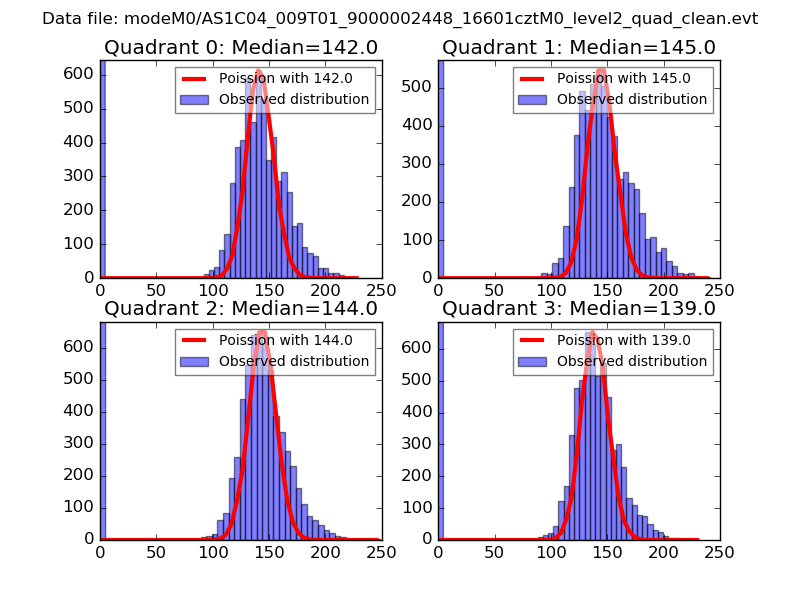 |
 |
| Quadrant-wise count rates Data is divided into 100 sec bins |
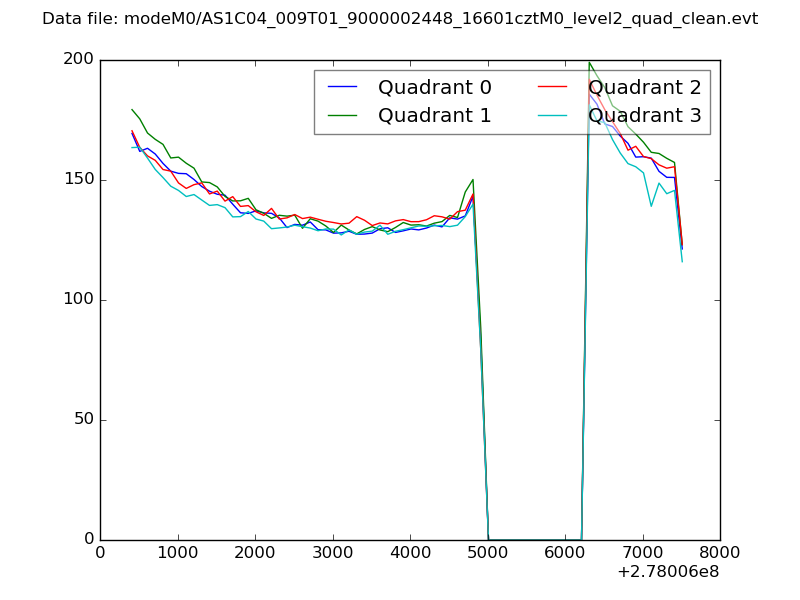 |
|
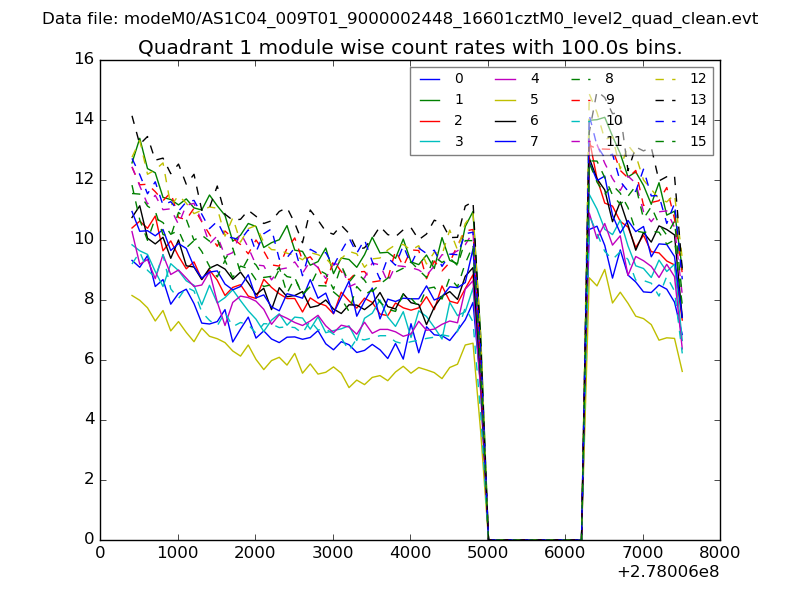
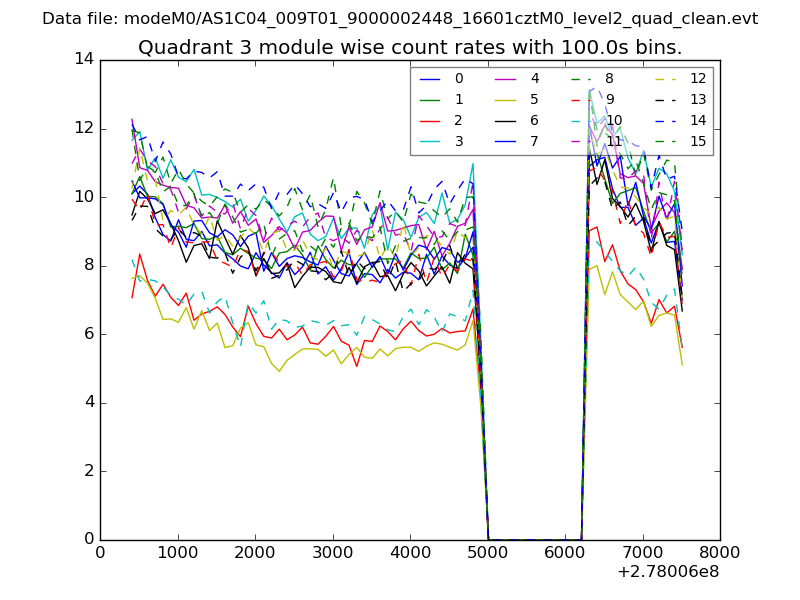
| Module-wise count rates for Quadrant A Data is divided into 100 sec bins |
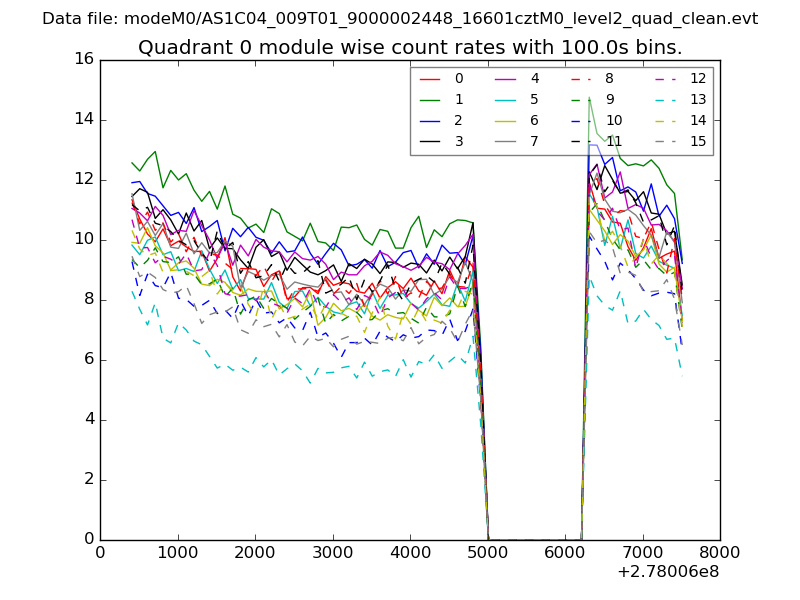 |
 |
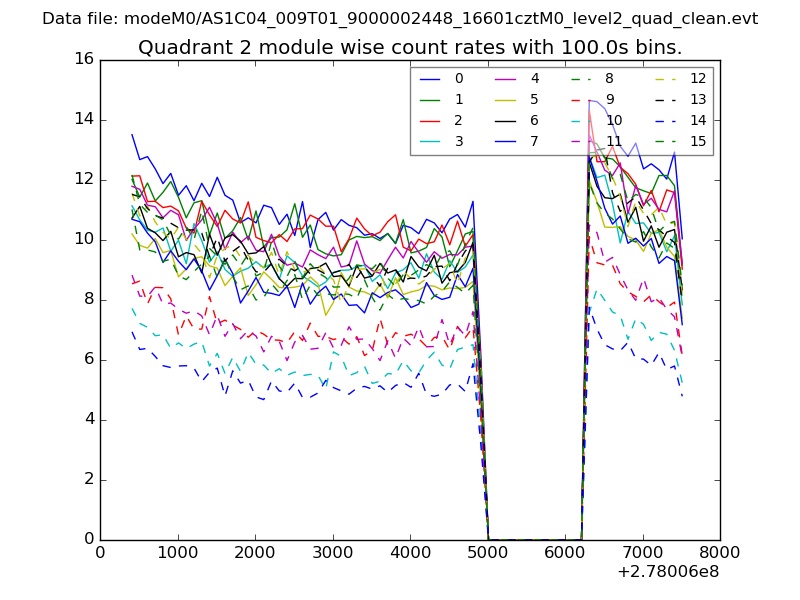
| Module-wise count rates for Quadrant B Data is divided into 100 sec bins |
 |
 |
| Module-wise count rates for Quadrant C Data is divided into 100 sec bins |
 |
 |
| Module-wise count rates for Quadrant D Data is divided into 100 sec bins |
 |
 |
| Parameter | Plot |
|---|---|
| CZT HV Monitor | 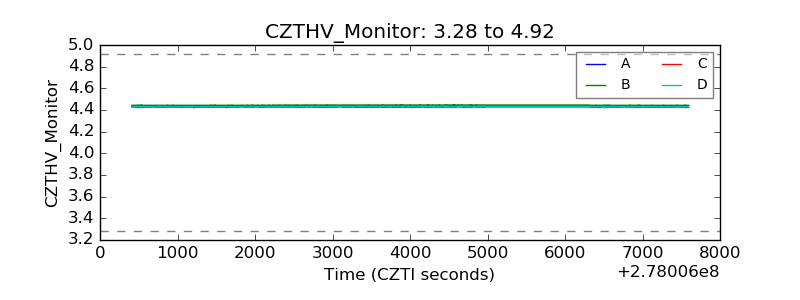 |
| D_VDD | 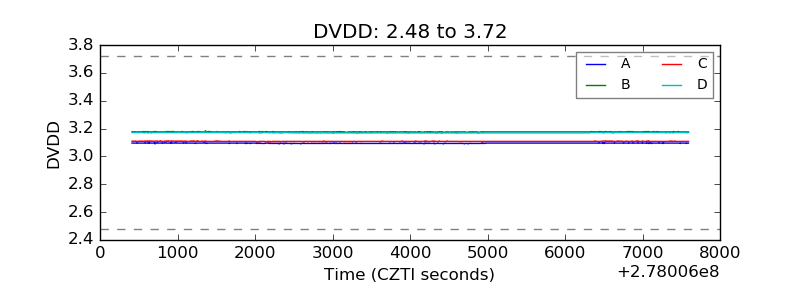 |
| Temperature 1 | 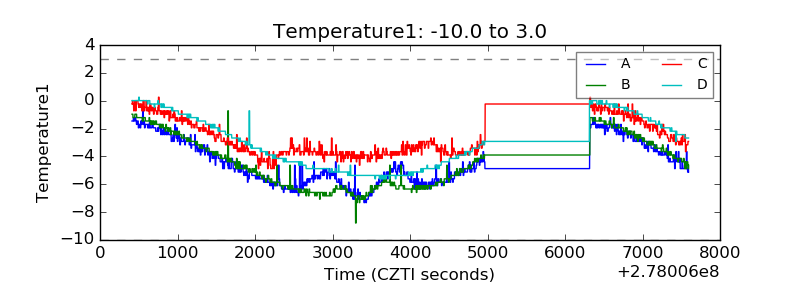 |
| Veto HV Monitor | 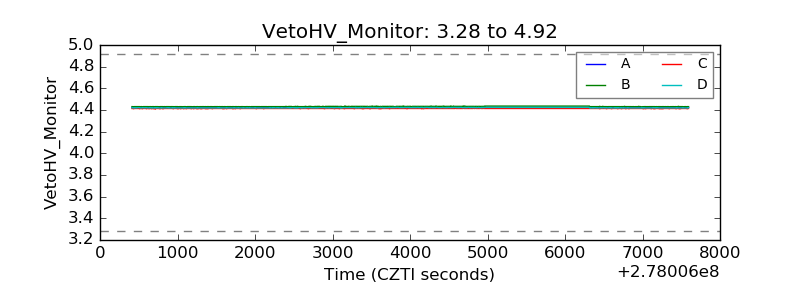 |
| Veto LLD | 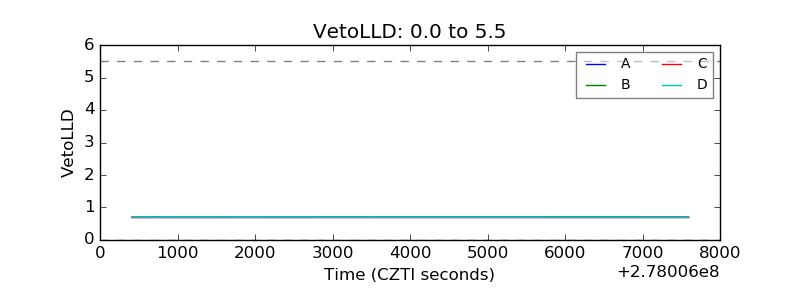 |
| Alpha Counter | 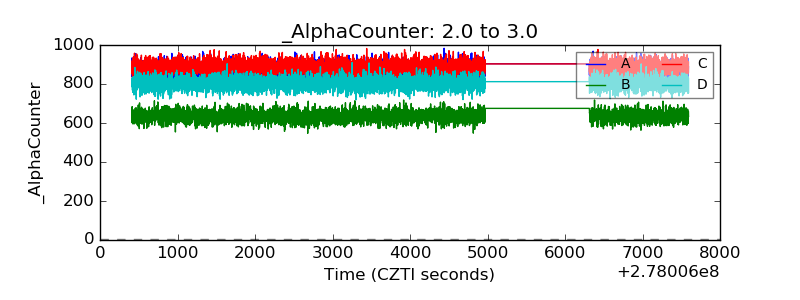 |
| _CPM_Rate | 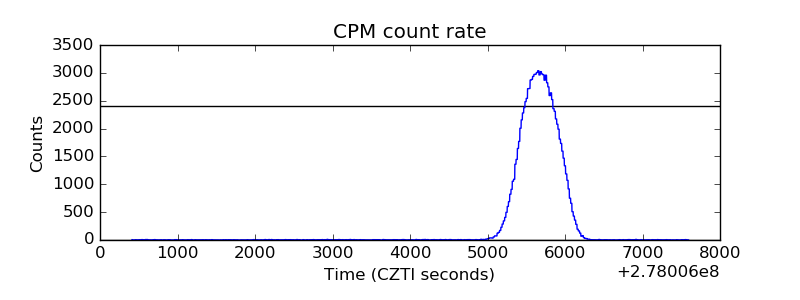 |
| CZT Counter | 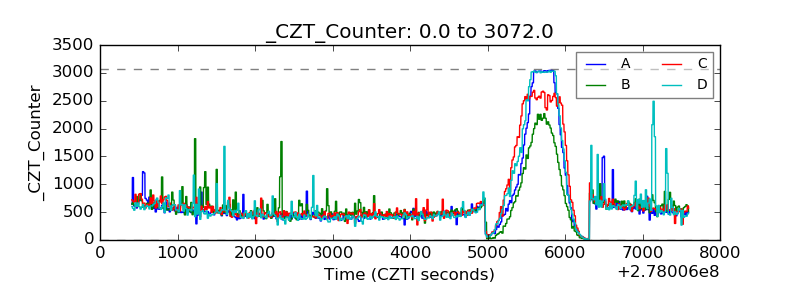 |
| +2.5 Volts monitor |  |
| +5 Volts monitor |  |
| _ROLL_ROT | 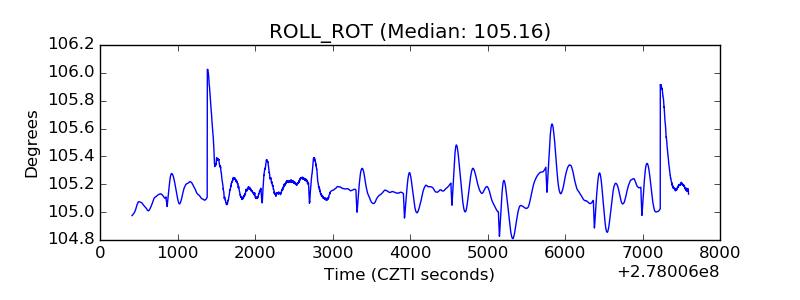 |
| _Roll_DEC | 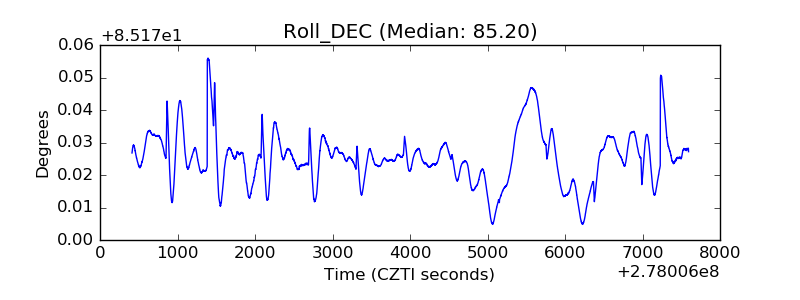 |
| _Roll_RA | 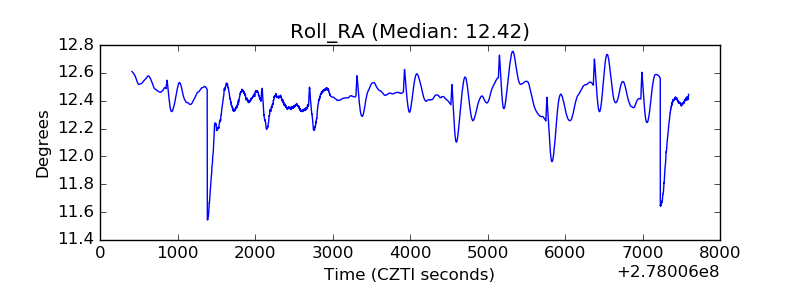 |
| Veto Counter | 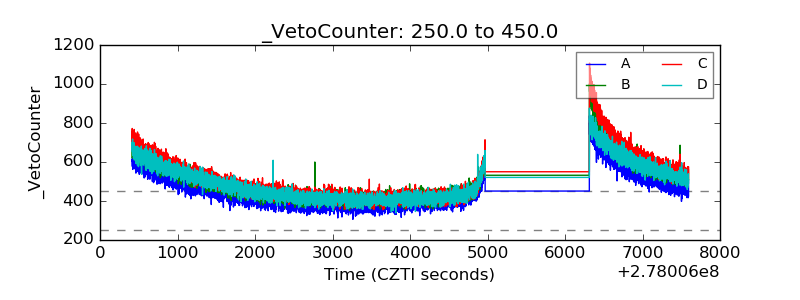 |