| Param | Original file | Final file |
|---|---|---|
| Filename | modeM0/AS1C04_009T01_9000002448_16602cztM0_level2.evt | modeM0/AS1C04_009T01_9000002448_16602cztM0_level2_quad_clean.evt |
| Size (bytes) | 455,437,440 | 132,359,040 |
| Size | 434.3 MB | 126.2 MB |
| Events in quadrant A | 3,251,376 | 884,855 |
| Events in quadrant B | 3,445,415 | 922,597 |
| Events in quadrant C | 3,313,425 | 906,218 |
| Events in quadrant D | 3,365,483 | 866,504 |
| Mode M0 | |||
|---|---|---|---|
| Quadrant | BADHDUFLAG | Total packets | Discarded packets |
| A | 0 | 13720 | 3 |
| B | 0 | 14401 | 2 |
| C | 0 | 13774 | 2 |
| D | 0 | 14326 | 2 |
| Mode SS | |||
|---|---|---|---|
| Quadrant | BADHDUFLAG | Total packets | Discarded packets |
| A | 0 | 124 | 0 |
| B | 0 | 124 | 0 |
| C | 0 | 124 | 0 |
| D | 0 | 124 | 0 |
| Mode M9 | |||
|---|---|---|---|
| Quadrant | BADHDUFLAG | Total packets | Discarded packets |
| A | 0 | 18 | 0 |
| B | 0 | 18 | 0 |
| C | 0 | 18 | 0 |
| D | 0 | 19 | 0 |
| Quadrant | Total seconds | Saturated seconds | Saturation percentage |
|---|---|---|---|
| A | 6148 | 61 | 0.992193% |
| B | 6148 | 77 | 1.252440% |
| C | 6148 | 92 | 1.496422% |
| D | 6148 | 89 | 1.447625% |
Noise dominated data is calculated using 1-second bins in cleaned event files. If a bin has >2000 counts, and if more than 50% of those come from <1% of pixels, then it is considered to be noise-dominated and hence unusable.
| Quadrant | # 1 sec bins | Bins with >0 counts | Bins with >2000 counts | High rate bins dominated by noise | Noise dominated (total time) | Noise dominated (detector-on time) | Marked lightcurve |
|---|---|---|---|---|---|---|---|
| A | 7499 | 6150 | 22 | 22 | 0.29% | 0.36% | 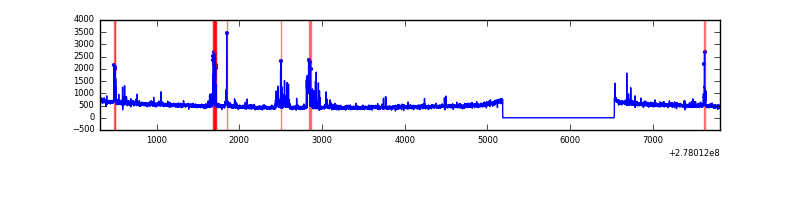 |
| B | 7499 | 6150 | 5 | 5 | 0.07% | 0.08% | 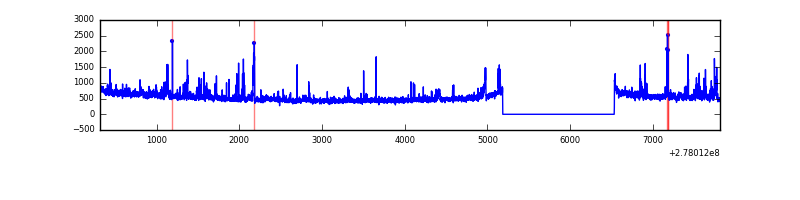 |
| C | 7499 | 6150 | 0 | 0 | 0.00% | 0.00% | 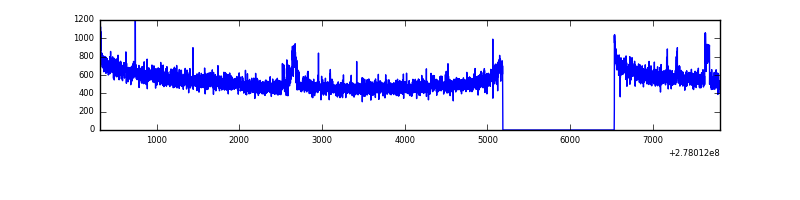 |
| D | 7499 | 6150 | 41 | 41 | 0.55% | 0.67% | 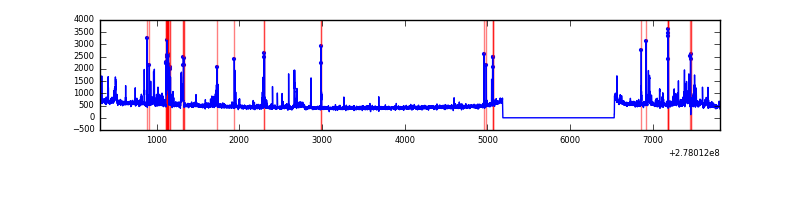 |
Top three noisy pixels from each quadrant. If the there are fewer than three noisy pixels in the level2.evt file, extra rows are filled as -1
| Pixel properties | Quadrant properties | ||||||
|---|---|---|---|---|---|---|---|
| Quadrant | DetID | PixID | Counts | Sigma | Mean | Median | Sigma |
| A | 15 | 174 | 252191 | 1661.44 | 769 | 755 | 151.3 |
| A | 9 | 143 | 18100 | 114.61 | 769 | 755 | 151.3 |
| A | 3 | 1 | 8693 | 52.45 | 769 | 755 | 151.3 |
| B | 15 | 35 | 162059 | 1133.31 | 783 | 764 | 142.3 |
| B | 4 | 216 | 33194 | 227.86 | 783 | 764 | 142.3 |
| B | 0 | 189 | 32196 | 220.85 | 783 | 764 | 142.3 |
| C | 3 | 233 | 183109 | 1030.18 | 767 | 773 | 177.0 |
| C | 14 | 238 | 120200 | 674.75 | 767 | 773 | 177.0 |
| C | 7 | 247 | 16403 | 88.31 | 767 | 773 | 177.0 |
| D | 10 | 70 | 144830 | 792.11 | 763 | 743 | 181.9 |
| D | 2 | 16 | 128369 | 701.62 | 763 | 743 | 181.9 |
| D | 1 | 52 | 122679 | 670.34 | 763 | 743 | 181.9 |
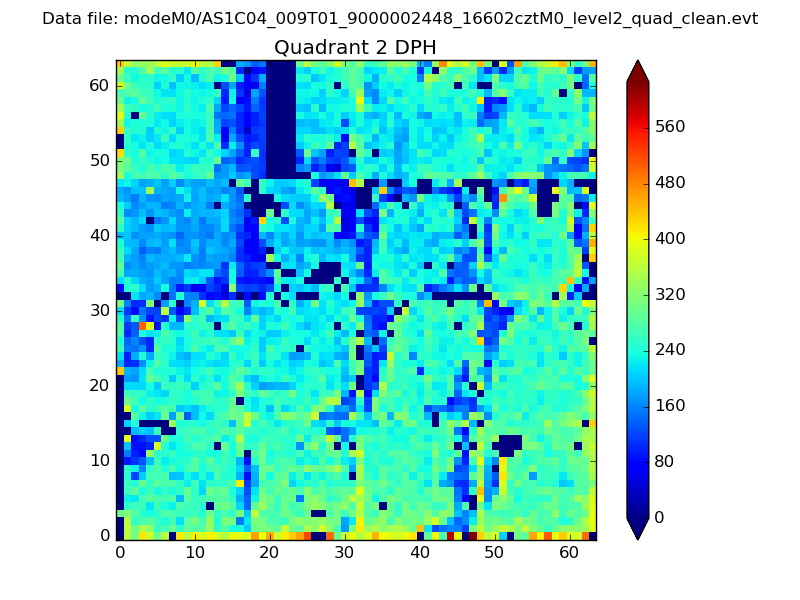
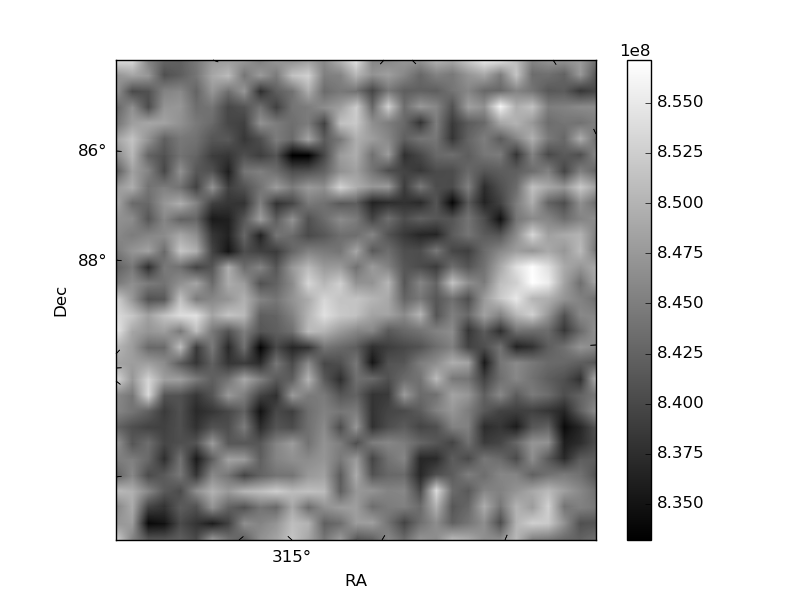
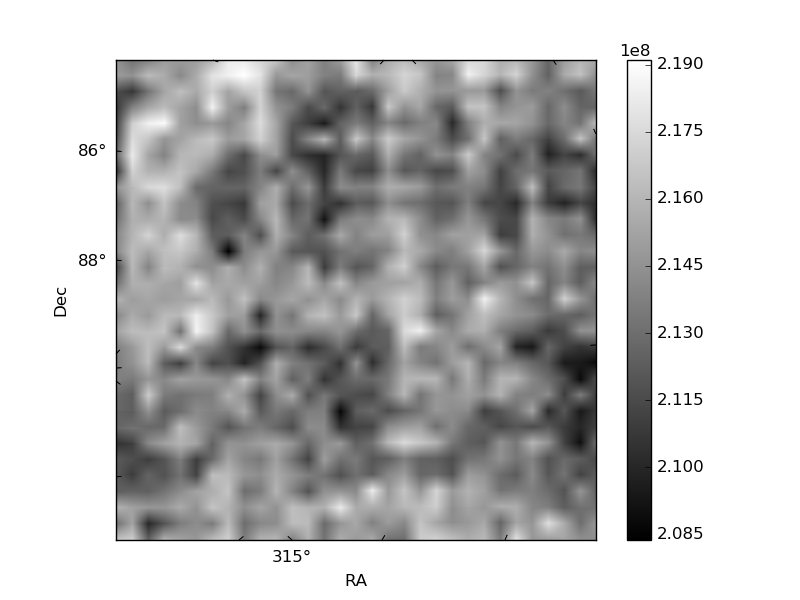
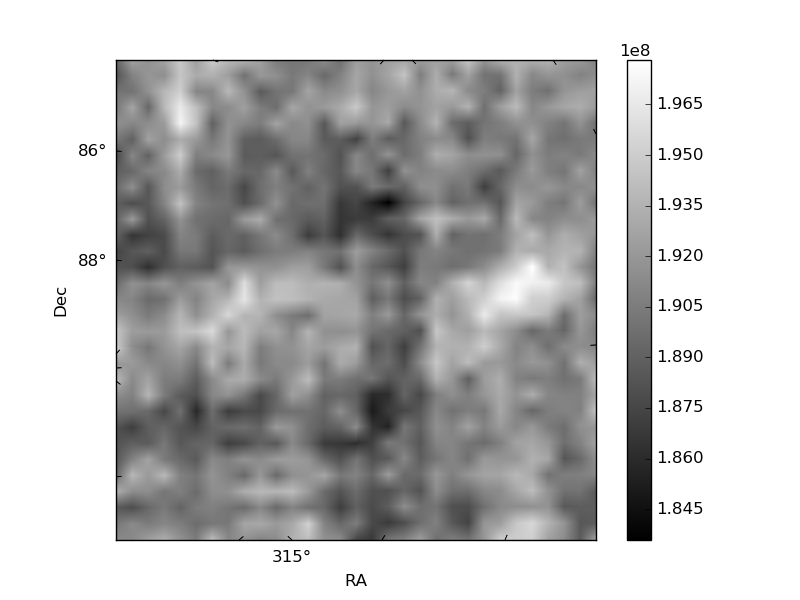
Histogram calculated using DETX and DETY for each event in the final _common_clean file
| Quadrant A | 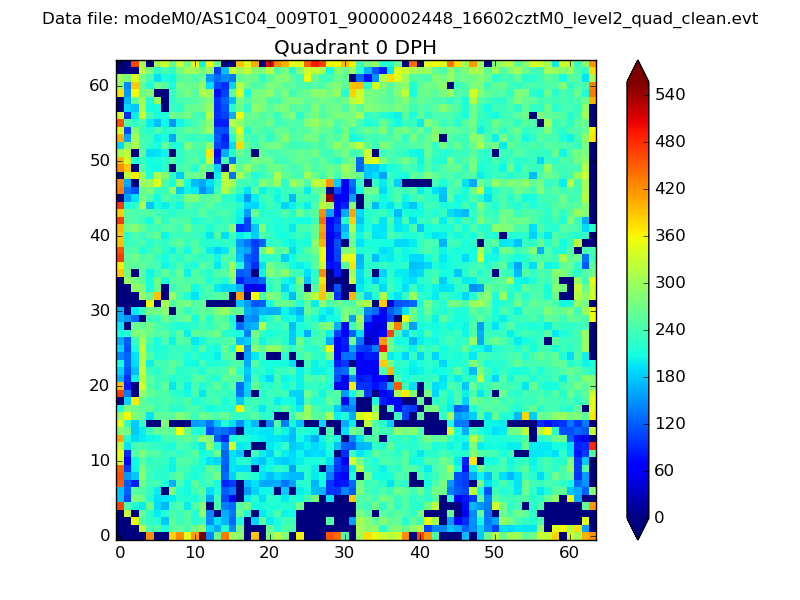 |
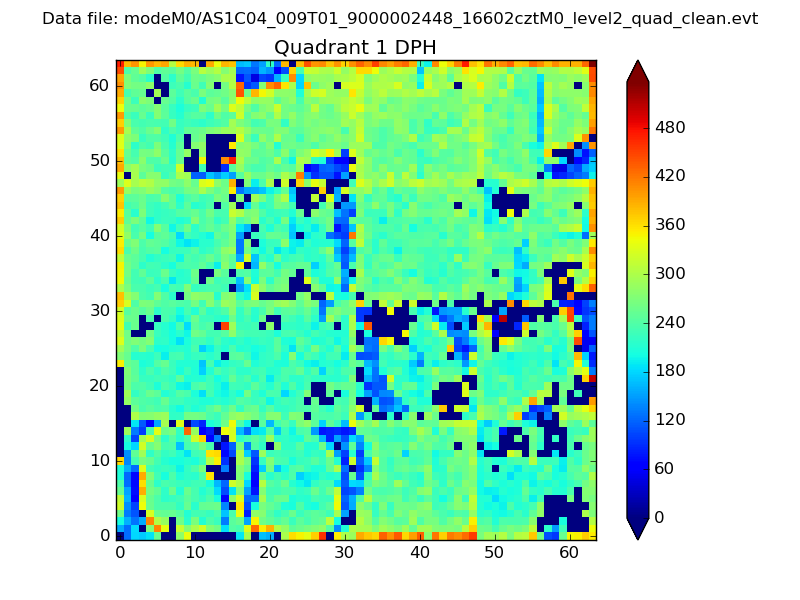 |
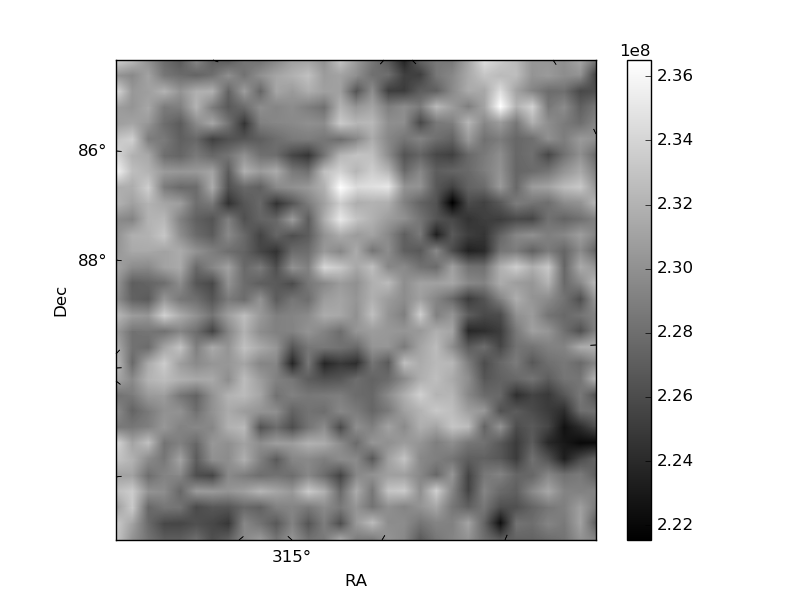
Quadrant B |
|---|---|---|---|
| Quadrant D | 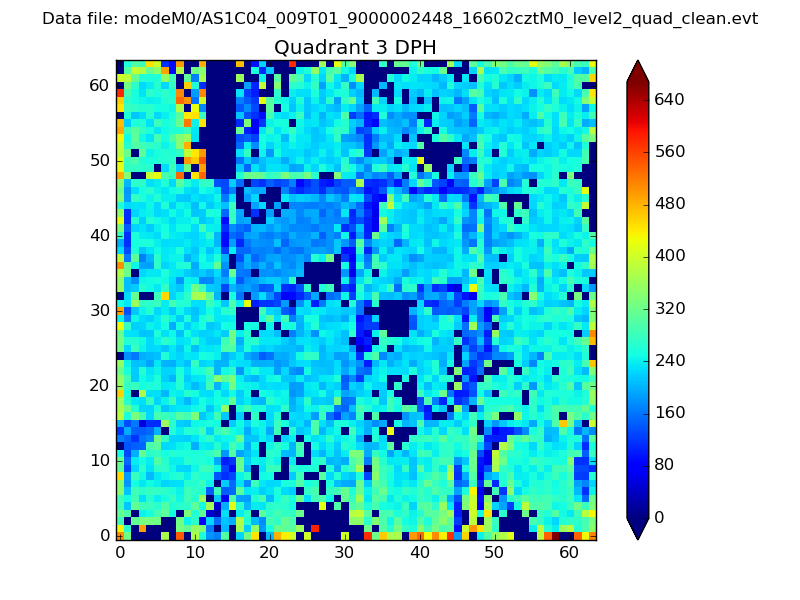 |
 |
Quadrant C |
| Plot type | Count rate plots | Images |
|---|---|---|
| Comparison with Poisson distribution Blue bars denote a histogram of data divided into 1 sec bins. Red curve is a Poisson curve with rate = median count rate of data. |
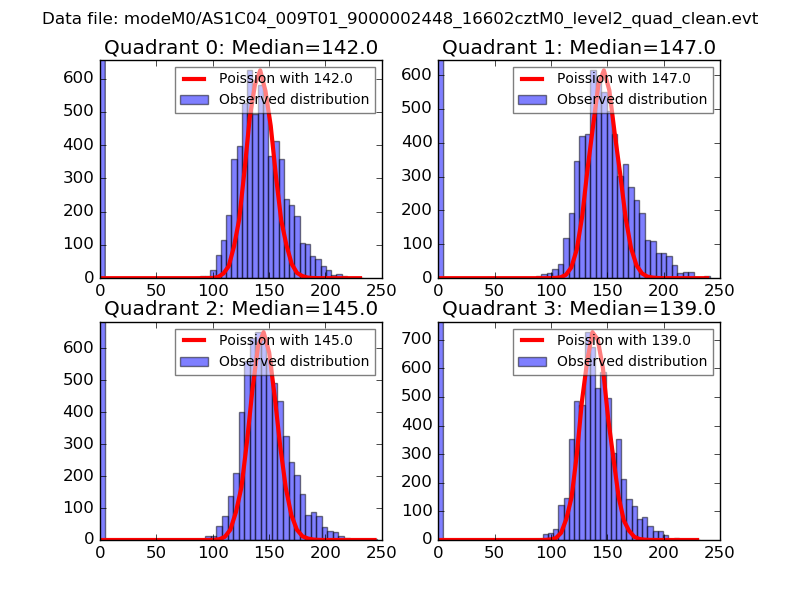 |
 |
| Quadrant-wise count rates Data is divided into 100 sec bins |
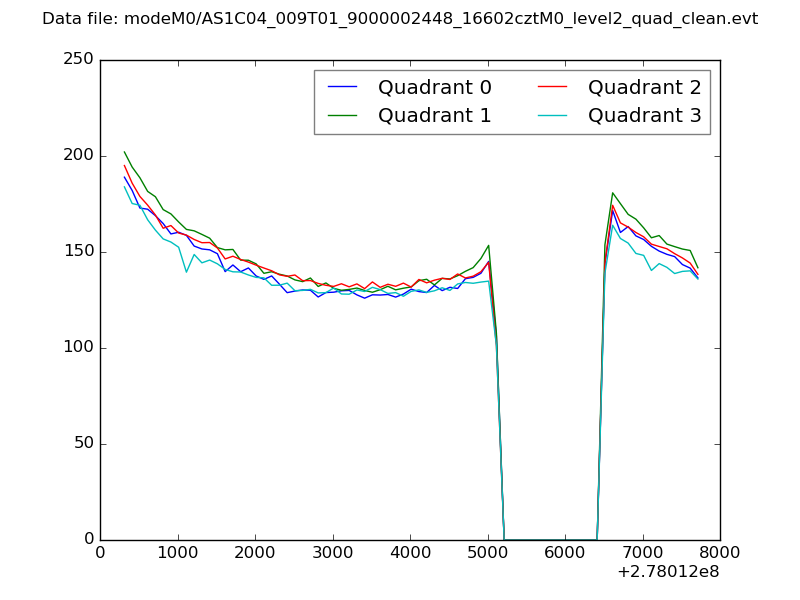 |
|
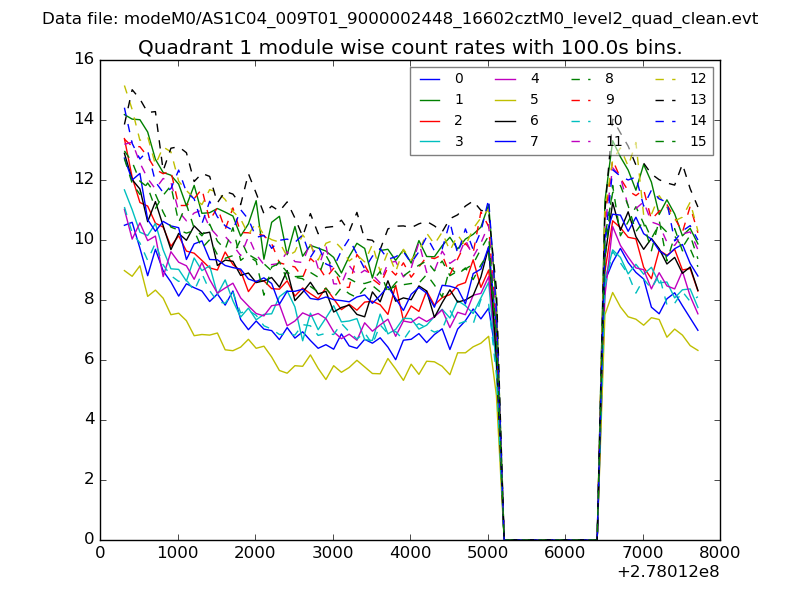
| Module-wise count rates for Quadrant A Data is divided into 100 sec bins |
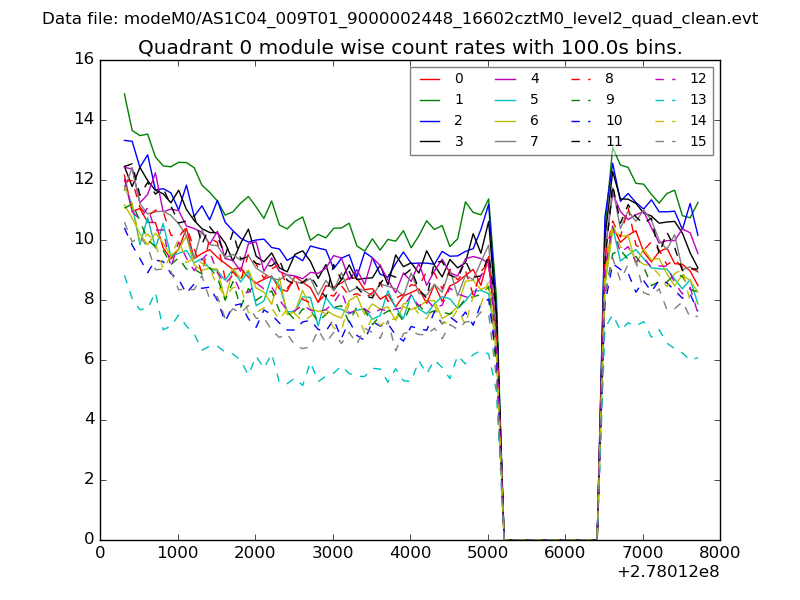 |
 |
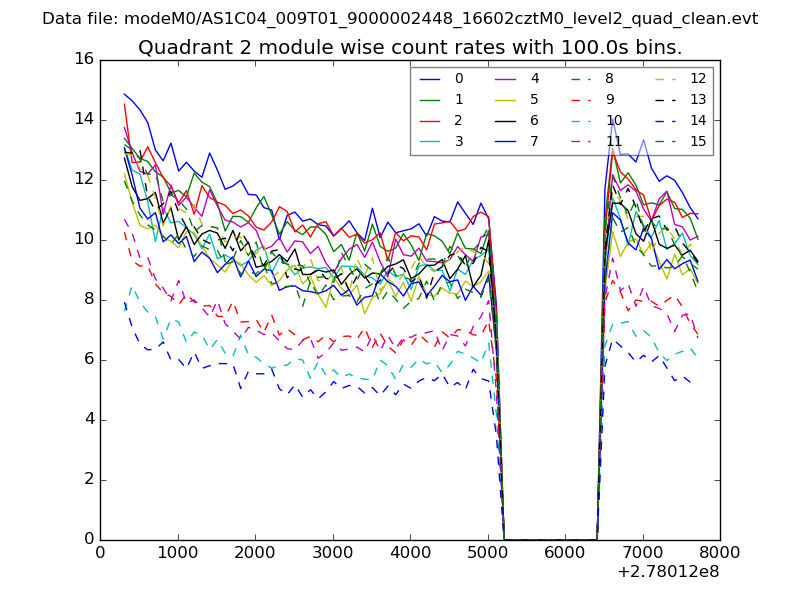
| Module-wise count rates for Quadrant B Data is divided into 100 sec bins |
 |
 |
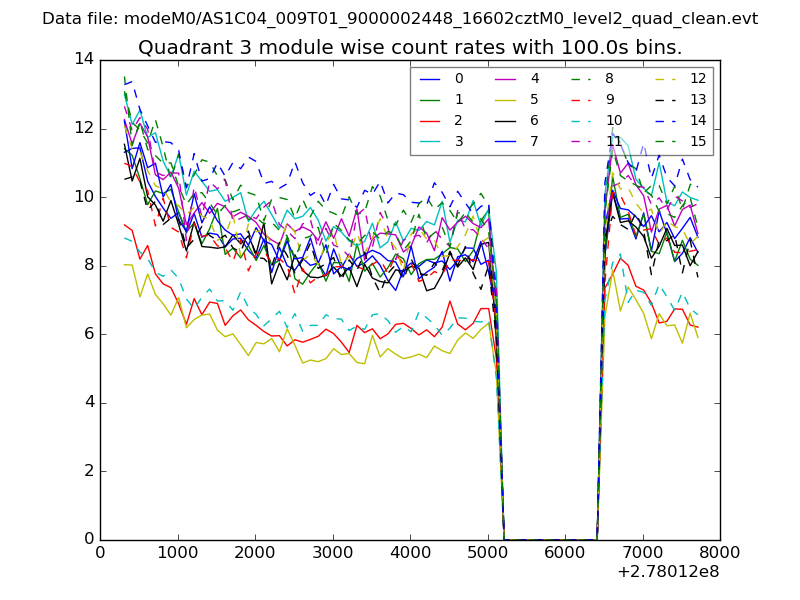
| Module-wise count rates for Quadrant C Data is divided into 100 sec bins |
 |
 |
| Module-wise count rates for Quadrant D Data is divided into 100 sec bins |
 |
 |
| Parameter | Plot |
|---|---|
| CZT HV Monitor | 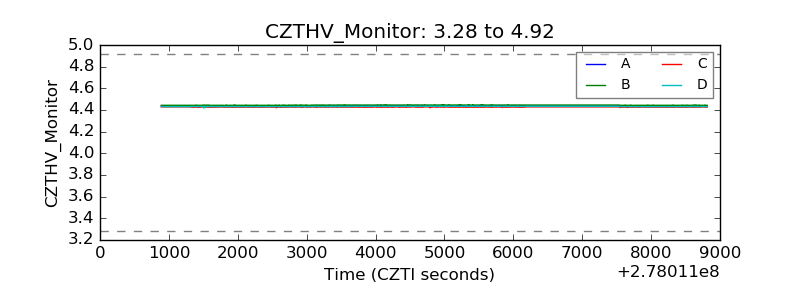 |
| D_VDD | 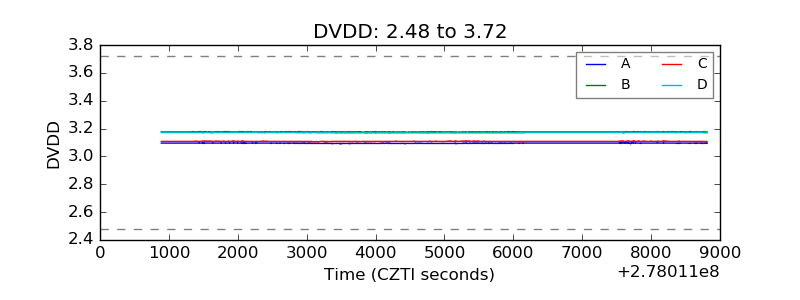 |
| Temperature 1 | 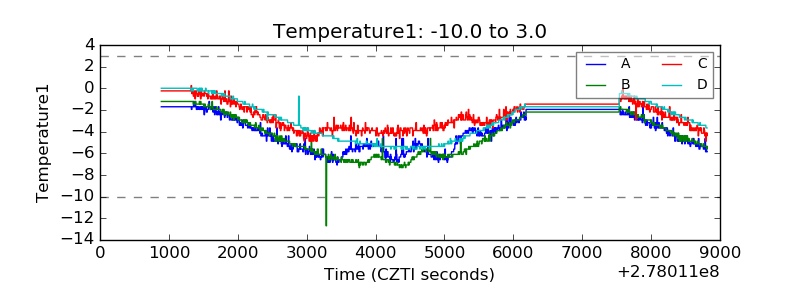 |
| Veto HV Monitor |  |
| Veto LLD | 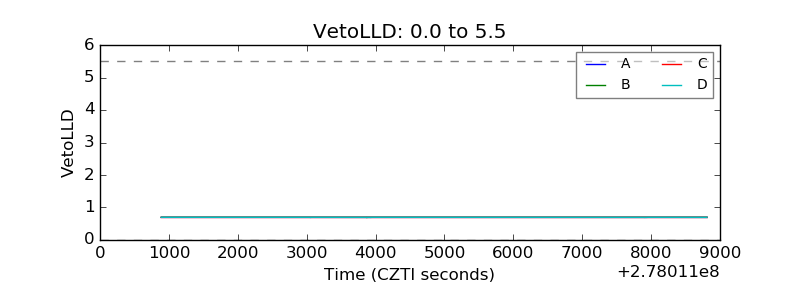 |
| Alpha Counter | 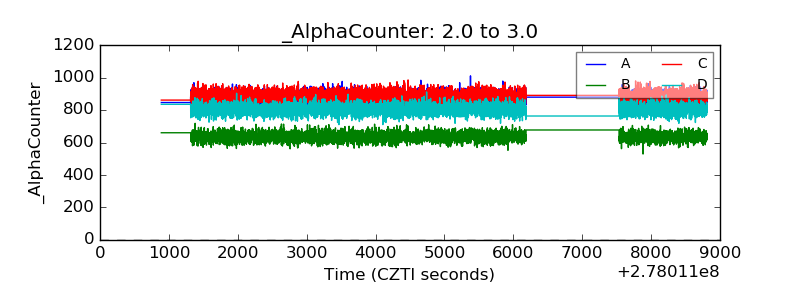 |
| _CPM_Rate | 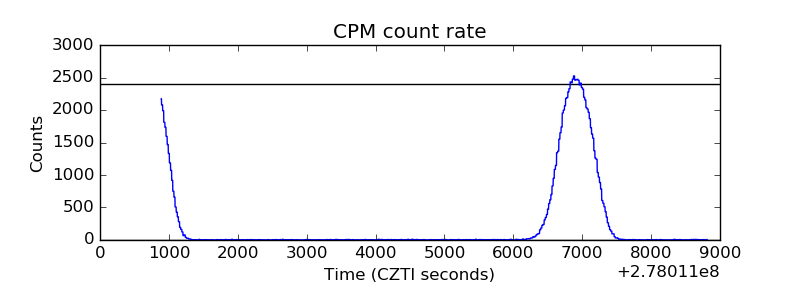 |
| CZT Counter | 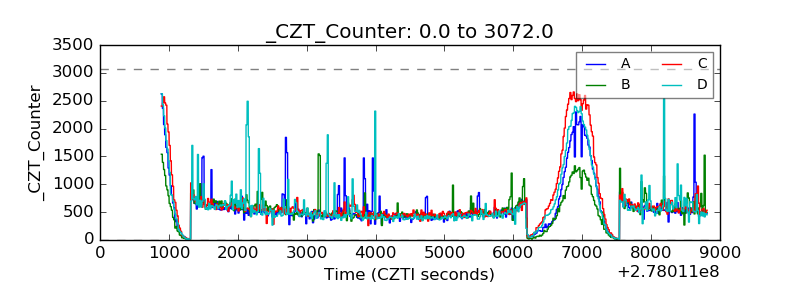 |
| +2.5 Volts monitor |  |
| +5 Volts monitor |  |
| _ROLL_ROT | 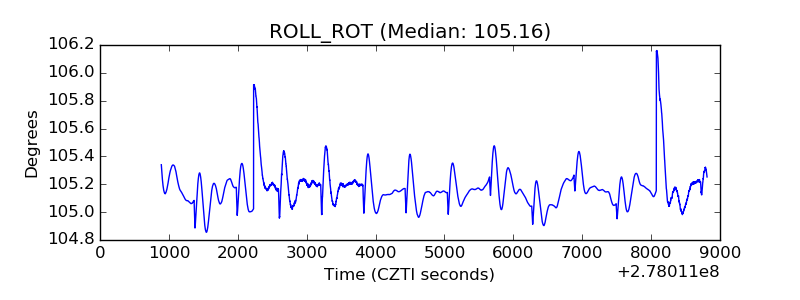 |
| _Roll_DEC | 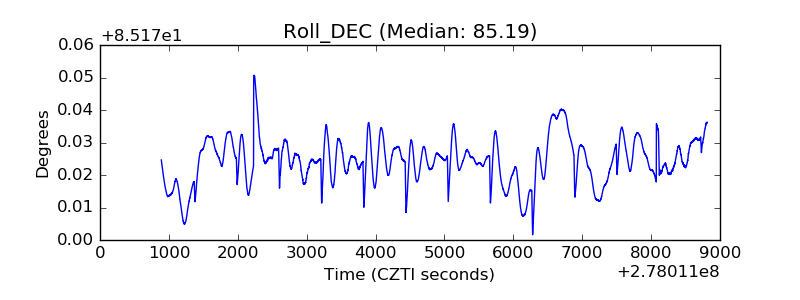 |
| _Roll_RA | 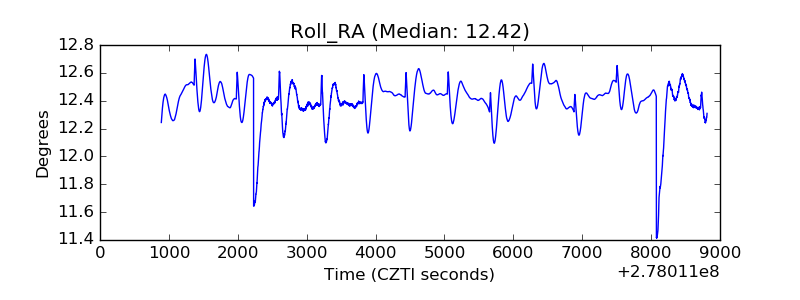 |
| Veto Counter | 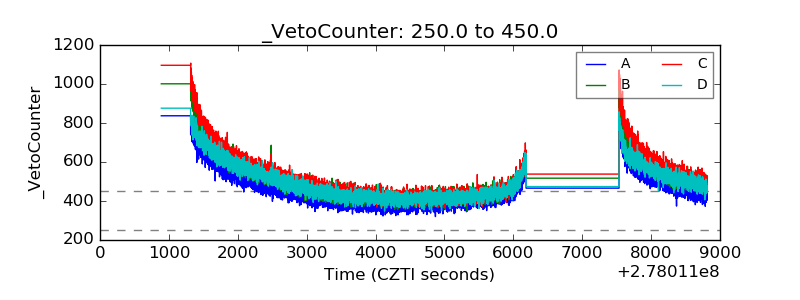 |