| Param | Original file | Final file |
|---|---|---|
| Filename | modeM0/AS1C04_009T01_9000002448_16603cztM0_level2.evt | modeM0/AS1C04_009T01_9000002448_16603cztM0_level2_quad_clean.evt |
| Size (bytes) | 479,525,760 | 125,078,400 |
| Size | 457.3 MB | 119.3 MB |
| Events in quadrant A | 2,993,421 | 844,612 |
| Events in quadrant B | 3,538,597 | 871,636 |
| Events in quadrant C | 3,260,312 | 862,661 |
| Events in quadrant D | 4,311,624 | 779,268 |
| Mode M0 | |||
|---|---|---|---|
| Quadrant | BADHDUFLAG | Total packets | Discarded packets |
| A | 0 | 13081 | 3 |
| B | 0 | 14668 | 2 |
| C | 0 | 13730 | 2 |
| D | 0 | 17100 | 2 |
| Mode SS | |||
|---|---|---|---|
| Quadrant | BADHDUFLAG | Total packets | Discarded packets |
| A | 0 | 124 | 0 |
| B | 0 | 124 | 0 |
| C | 0 | 124 | 0 |
| D | 0 | 124 | 0 |
| Mode M9 | |||
|---|---|---|---|
| Quadrant | BADHDUFLAG | Total packets | Discarded packets |
| A | 0 | 16 | 0 |
| B | 0 | 16 | 0 |
| C | 0 | 16 | 0 |
| D | 0 | 17 | 0 |
| Quadrant | Total seconds | Saturated seconds | Saturation percentage |
|---|---|---|---|
| A | 6162 | 69 | 1.119766% |
| B | 6162 | 170 | 2.758845% |
| C | 6162 | 120 | 1.947420% |
| D | 6162 | 612 | 9.931840% |
Noise dominated data is calculated using 1-second bins in cleaned event files. If a bin has >2000 counts, and if more than 50% of those come from <1% of pixels, then it is considered to be noise-dominated and hence unusable.
| Quadrant | # 1 sec bins | Bins with >0 counts | Bins with >2000 counts | High rate bins dominated by noise | Noise dominated (total time) | Noise dominated (detector-on time) | Marked lightcurve |
|---|---|---|---|---|---|---|---|
| A | 7453 | 6164 | 9 | 9 | 0.12% | 0.15% | 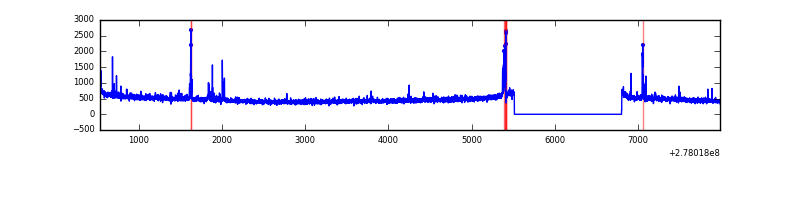 |
| B | 7453 | 6164 | 37 | 37 | 0.50% | 0.60% | 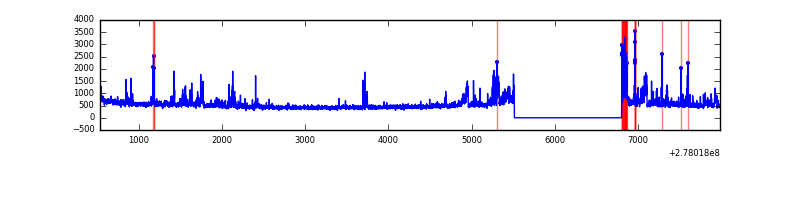 |
| C | 7453 | 6164 | 0 | 0 | 0.00% | 0.00% | 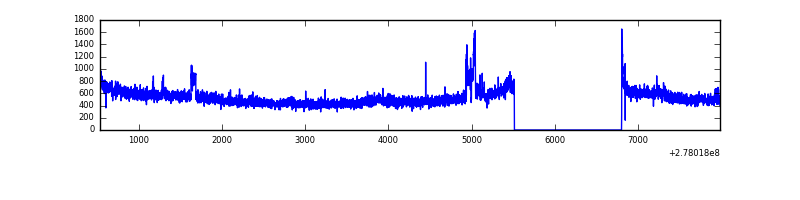 |
| D | 7453 | 6164 | 460 | 460 | 6.17% | 7.46% | 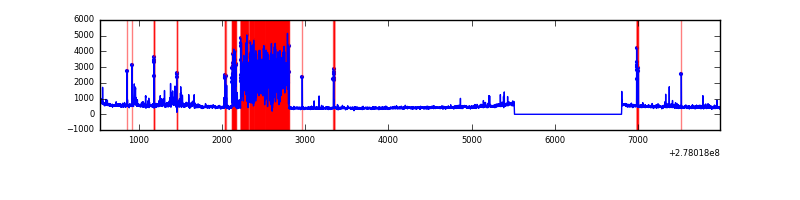 |
Top three noisy pixels from each quadrant. If the there are fewer than three noisy pixels in the level2.evt file, extra rows are filled as -1
| Pixel properties | Quadrant properties | ||||||
|---|---|---|---|---|---|---|---|
| Quadrant | DetID | PixID | Counts | Sigma | Mean | Median | Sigma |
| A | 15 | 174 | 87498 | 587.54 | 741 | 725 | 147.7 |
| A | 9 | 143 | 33409 | 221.3 | 741 | 725 | 147.7 |
| A | 3 | 1 | 9076 | 56.54 | 741 | 725 | 147.7 |
| B | 15 | 35 | 310570 | 2214.88 | 752 | 732 | 139.9 |
| B | 15 | 19 | 93457 | 662.85 | 752 | 732 | 139.9 |
| B | 0 | 189 | 42676 | 299.84 | 752 | 732 | 139.9 |
| C | 3 | 233 | 253688 | 1484.69 | 738 | 743 | 170.4 |
| C | 14 | 238 | 116100 | 677.1 | 738 | 743 | 170.4 |
| C | 7 | 247 | 12981 | 71.83 | 738 | 743 | 170.4 |
| D | 2 | 16 | 1411436 | 8310.74 | 700 | 680 | 169.8 |
| D | 10 | 70 | 108953 | 637.83 | 700 | 680 | 169.8 |
| D | 1 | 52 | 106719 | 624.67 | 700 | 680 | 169.8 |
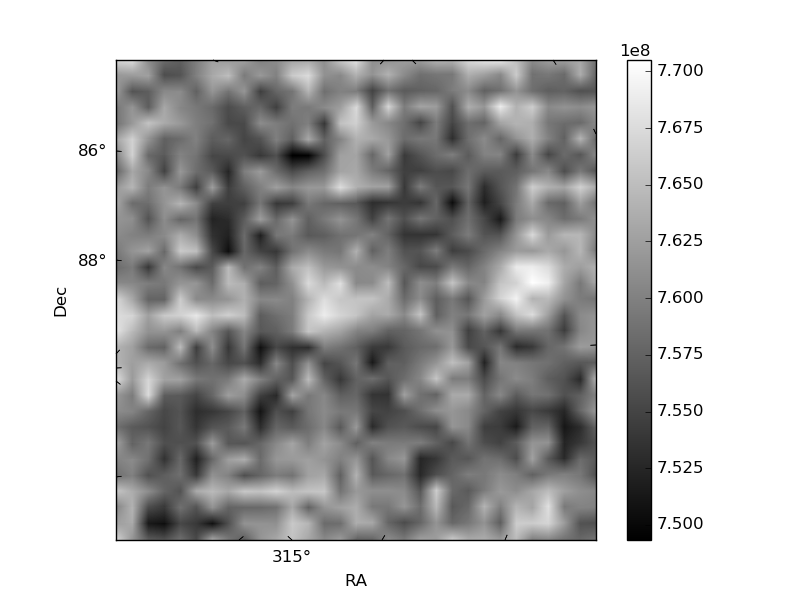
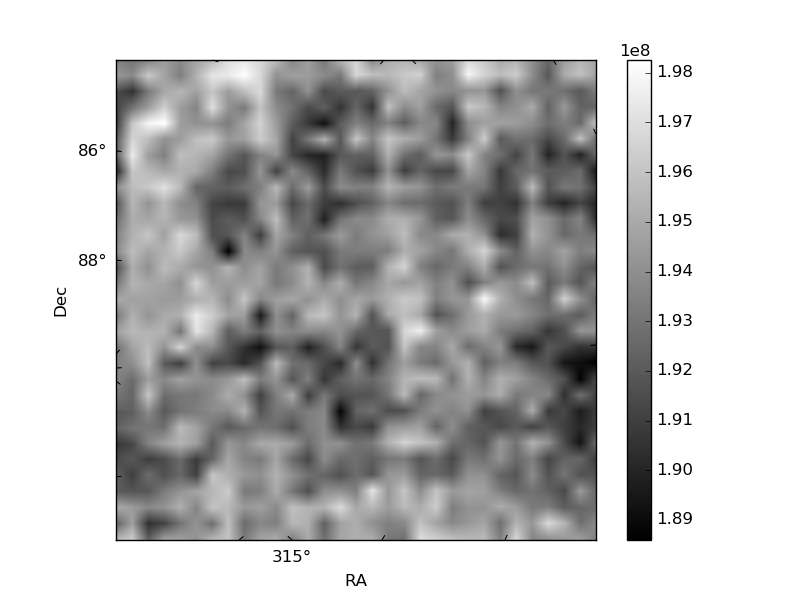
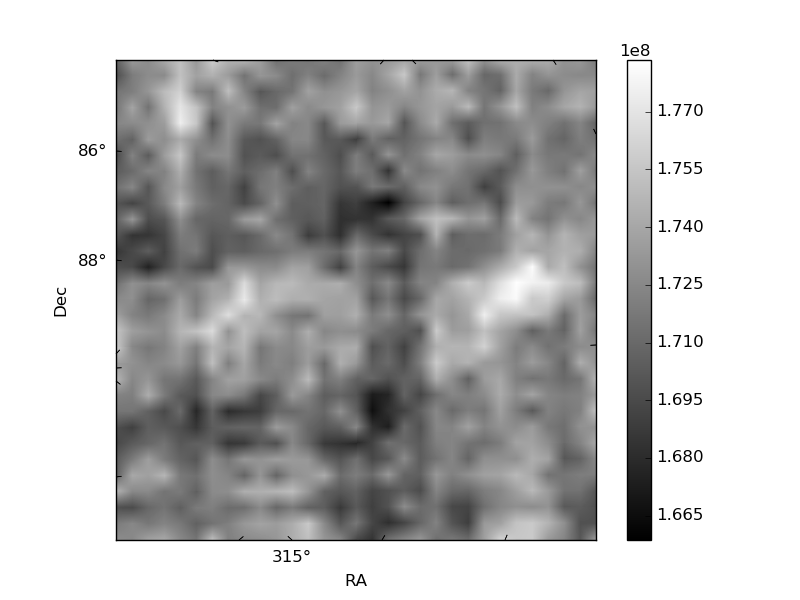
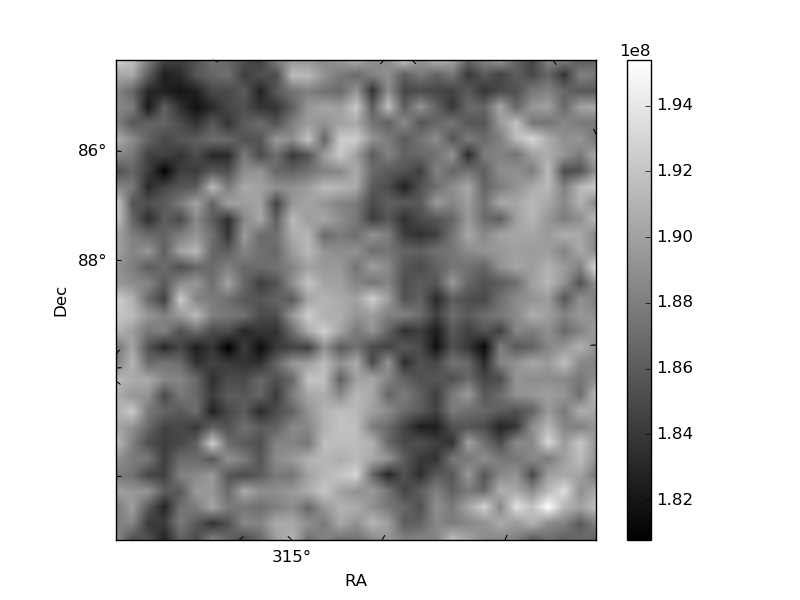
Histogram calculated using DETX and DETY for each event in the final _common_clean file
| Quadrant A | 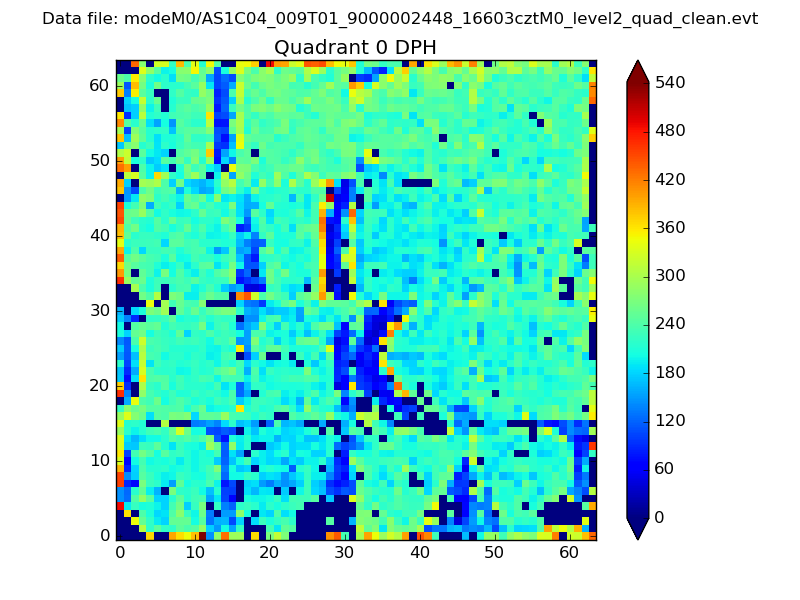 |
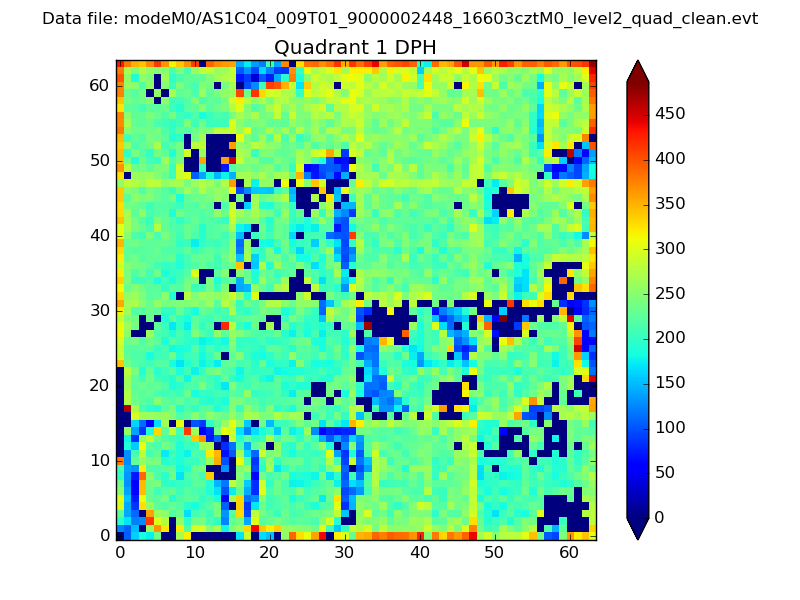 |
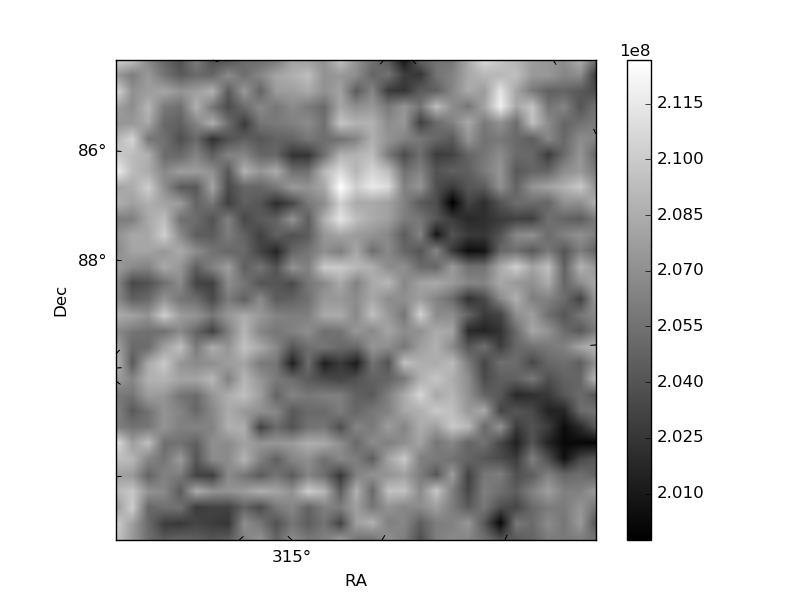
Quadrant B |
|---|---|---|---|
| Quadrant D | 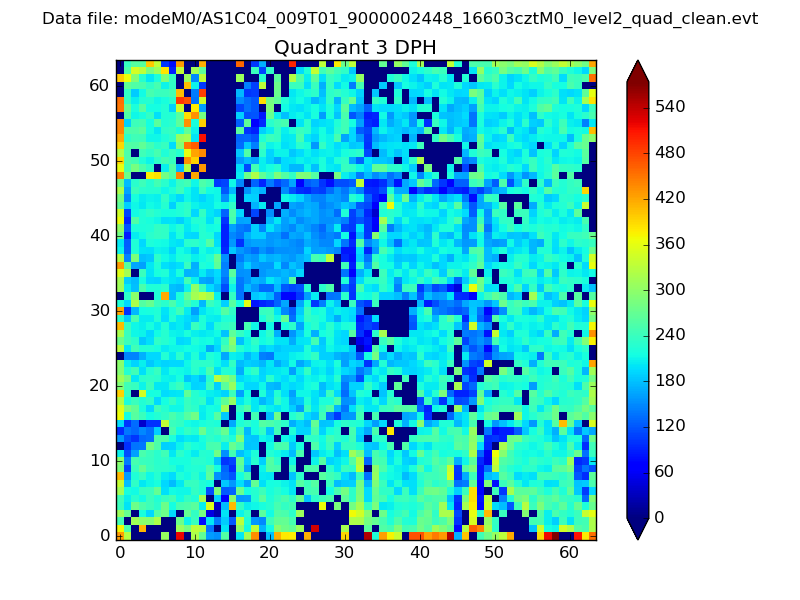 |
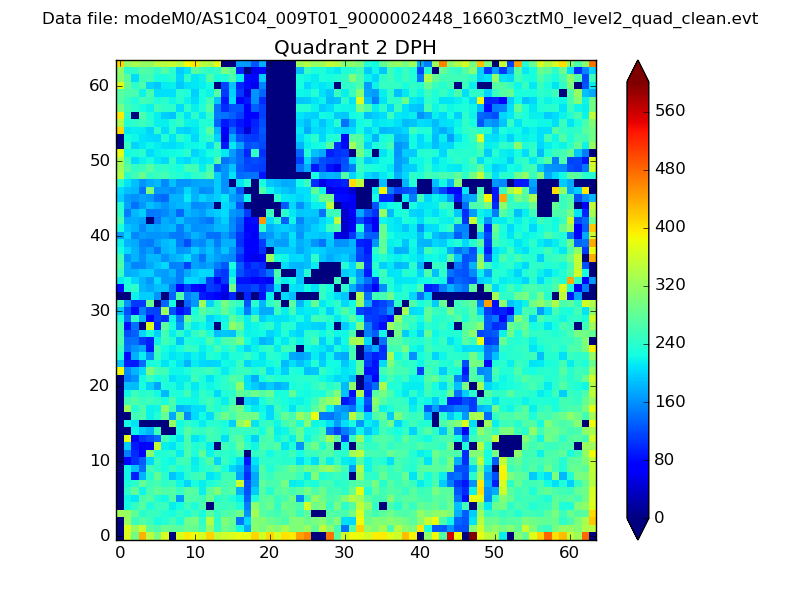 |
Quadrant C |
| Plot type | Count rate plots | Images |
|---|---|---|
| Comparison with Poisson distribution Blue bars denote a histogram of data divided into 1 sec bins. Red curve is a Poisson curve with rate = median count rate of data. |
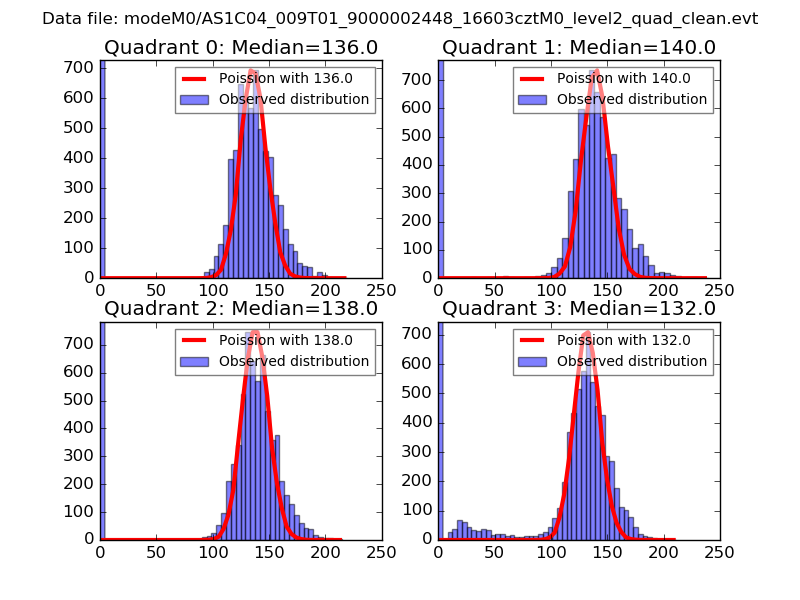 |
 |
| Quadrant-wise count rates Data is divided into 100 sec bins |
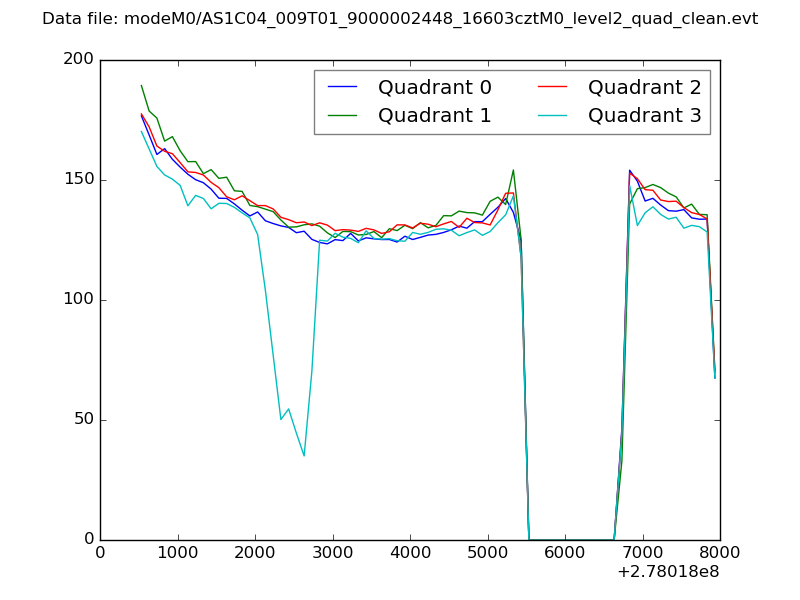 |
|
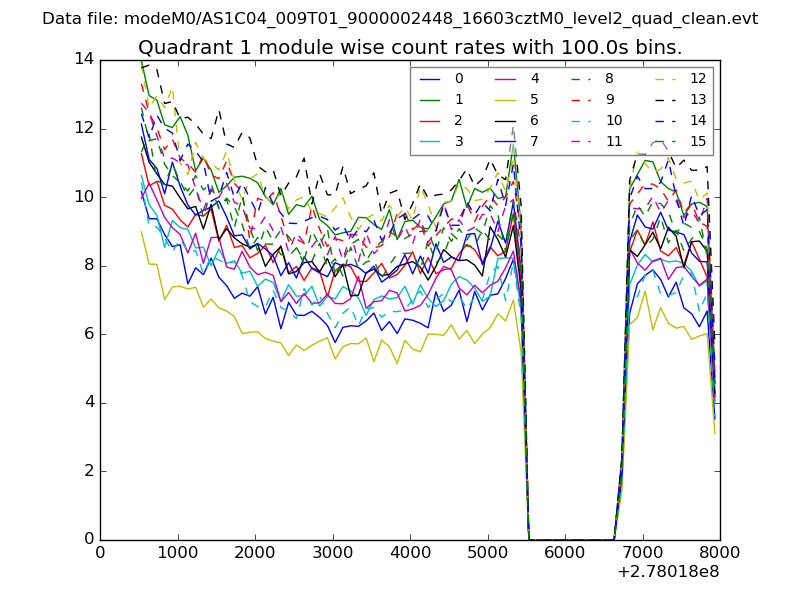
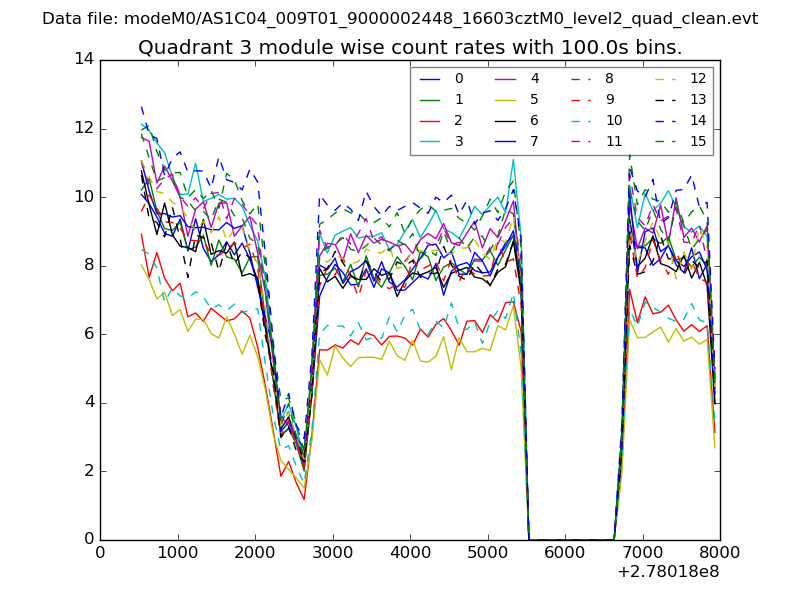
| Module-wise count rates for Quadrant A Data is divided into 100 sec bins |
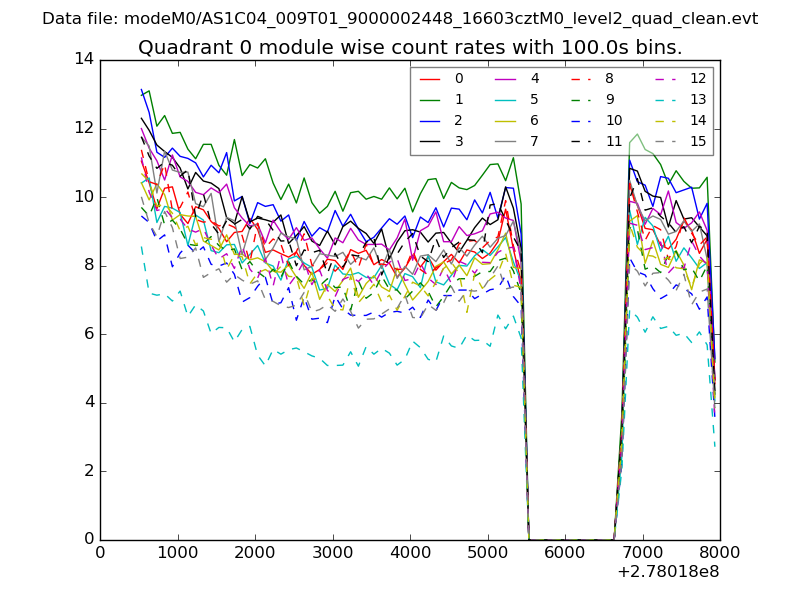 |
 |
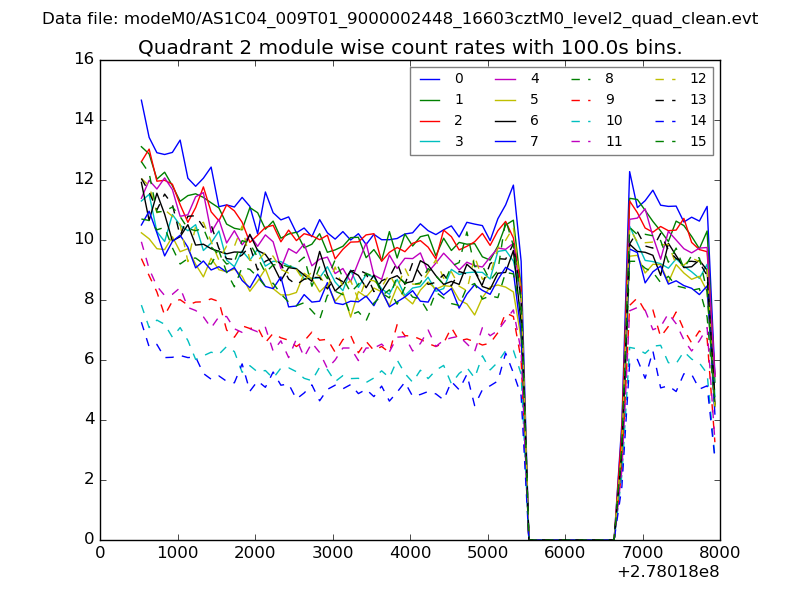
| Module-wise count rates for Quadrant B Data is divided into 100 sec bins |
 |
 |
| Module-wise count rates for Quadrant C Data is divided into 100 sec bins |
 |
 |
| Module-wise count rates for Quadrant D Data is divided into 100 sec bins |
 |
 |
| Parameter | Plot |
|---|---|
| CZT HV Monitor | 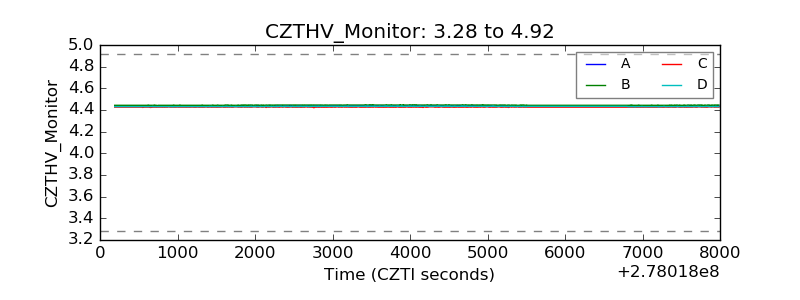 |
| D_VDD | 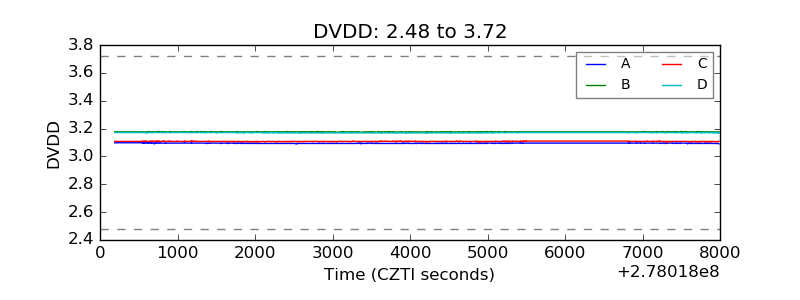 |
| Temperature 1 | 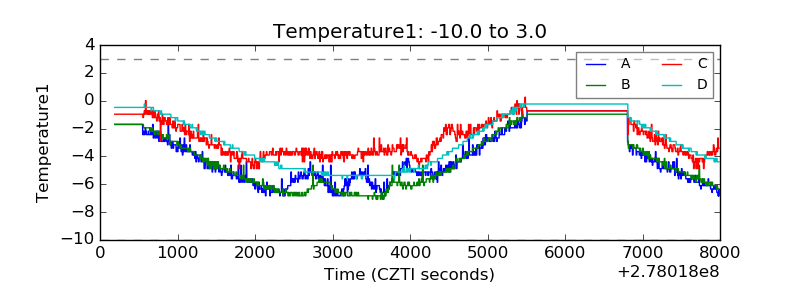 |
| Veto HV Monitor | 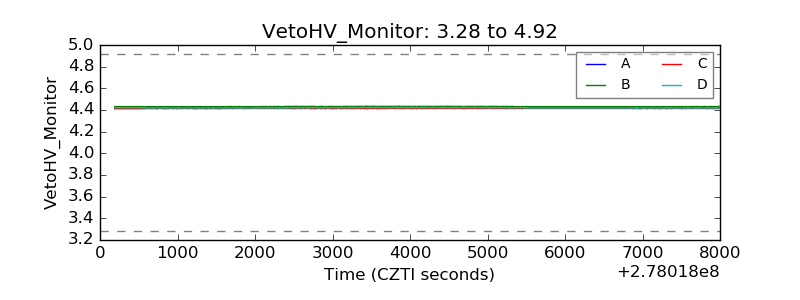 |
| Veto LLD | 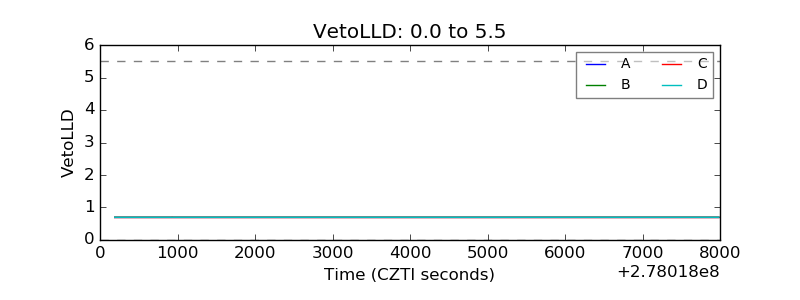 |
| Alpha Counter | 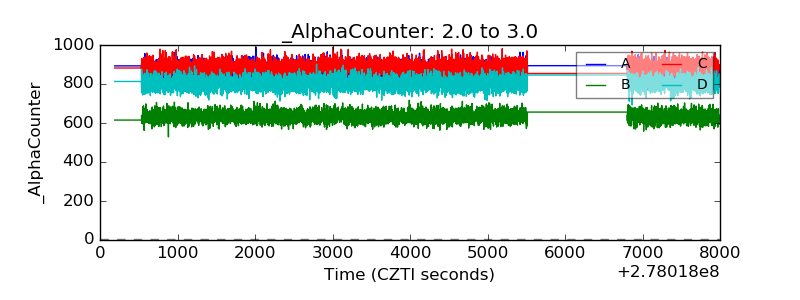 |
| _CPM_Rate | 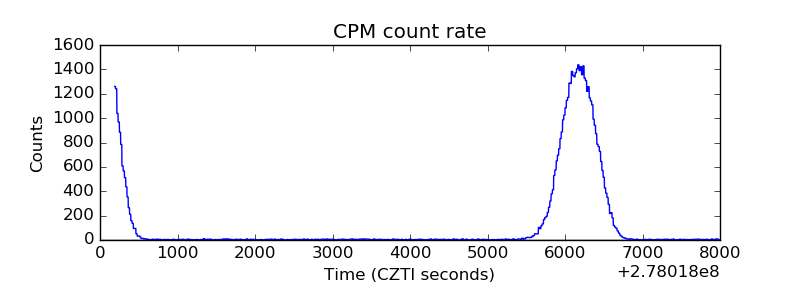 |
| CZT Counter | 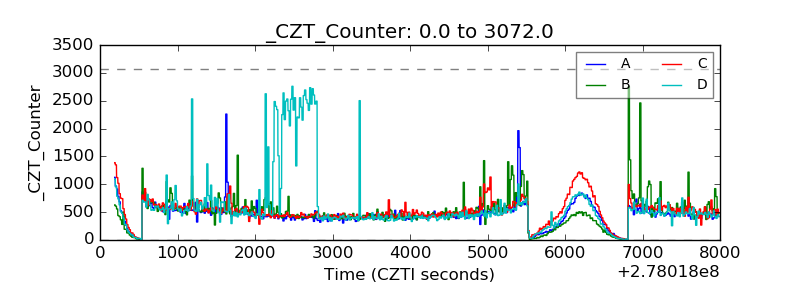 |
| +2.5 Volts monitor |  |
| +5 Volts monitor | 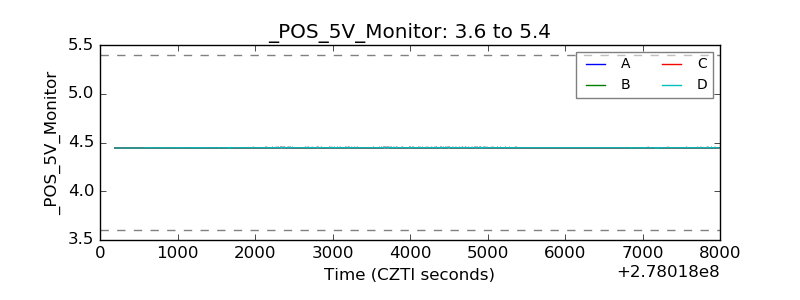 |
| _ROLL_ROT | 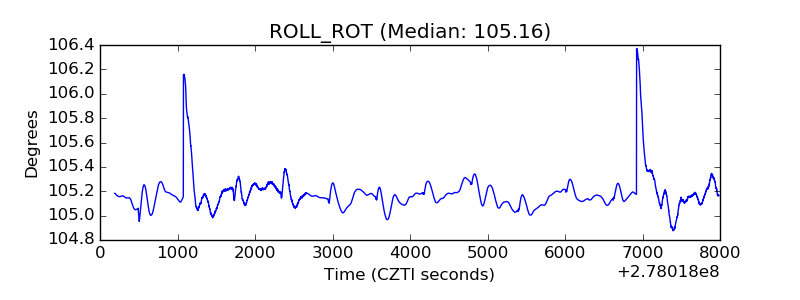 |
| _Roll_DEC | 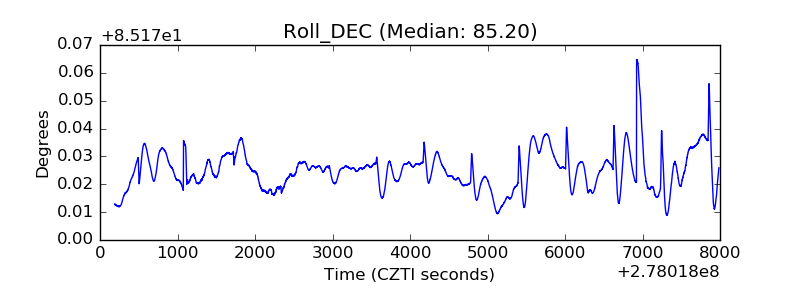 |
| _Roll_RA | 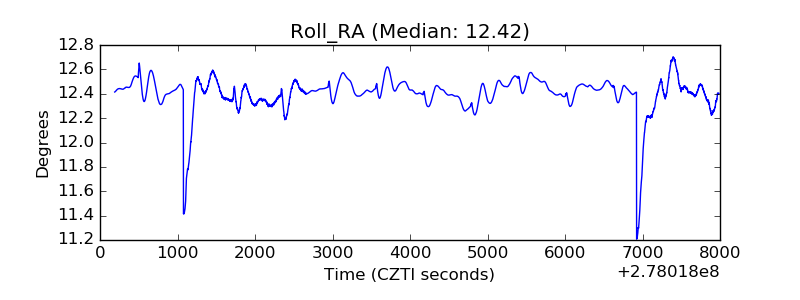 |
| Veto Counter | 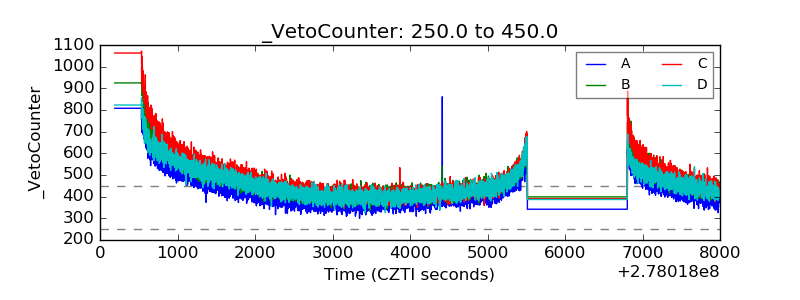 |