| Param | Original file | Final file |
|---|---|---|
| Filename | modeM0/AS1C04_009T01_9000002448_16604cztM0_level2.evt | modeM0/AS1C04_009T01_9000002448_16604cztM0_level2_quad_clean.evt |
| Size (bytes) | 451,589,760 | 127,765,440 |
| Size | 430.7 MB | 121.8 MB |
| Events in quadrant A | 3,157,905 | 844,484 |
| Events in quadrant B | 3,577,580 | 873,239 |
| Events in quadrant C | 3,461,900 | 857,892 |
| Events in quadrant D | 3,029,281 | 832,976 |
| Mode M0 | |||
|---|---|---|---|
| Quadrant | BADHDUFLAG | Total packets | Discarded packets |
| A | 0 | 14107 | 3 |
| B | 0 | 15198 | 2 |
| C | 0 | 14502 | 2 |
| D | 0 | 13871 | 2 |
| Mode SS | |||
|---|---|---|---|
| Quadrant | BADHDUFLAG | Total packets | Discarded packets |
| A | 0 | 134 | 0 |
| B | 0 | 134 | 0 |
| C | 0 | 134 | 0 |
| D | 0 | 134 | 0 |
| Mode M9 | |||
|---|---|---|---|
| Quadrant | BADHDUFLAG | Total packets | Discarded packets |
| A | 0 | 14 | 0 |
| B | 0 | 14 | 0 |
| C | 0 | 14 | 0 |
| D | 0 | 15 | 0 |
| Quadrant | Total seconds | Saturated seconds | Saturation percentage |
|---|---|---|---|
| A | 6613 | 126 | 1.905338% |
| B | 6613 | 131 | 1.980947% |
| C | 6613 | 122 | 1.844851% |
| D | 6613 | 55 | 0.831695% |
Noise dominated data is calculated using 1-second bins in cleaned event files. If a bin has >2000 counts, and if more than 50% of those come from <1% of pixels, then it is considered to be noise-dominated and hence unusable.
| Quadrant | # 1 sec bins | Bins with >0 counts | Bins with >2000 counts | High rate bins dominated by noise | Noise dominated (total time) | Noise dominated (detector-on time) | Marked lightcurve |
|---|---|---|---|---|---|---|---|
| A | 7629 | 6615 | 62 | 62 | 0.81% | 0.94% | 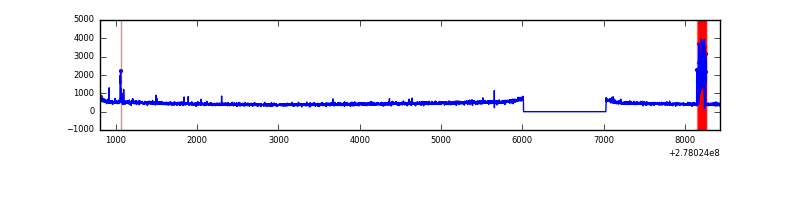 |
| B | 7629 | 6615 | 39 | 39 | 0.51% | 0.59% | 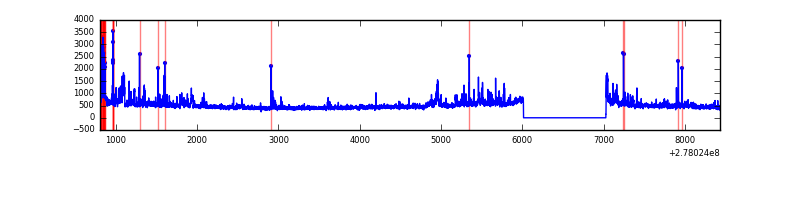 |
| C | 7629 | 6615 | 0 | 0 | 0.00% | 0.00% |  |
| D | 7629 | 6615 | 15 | 15 | 0.20% | 0.23% | 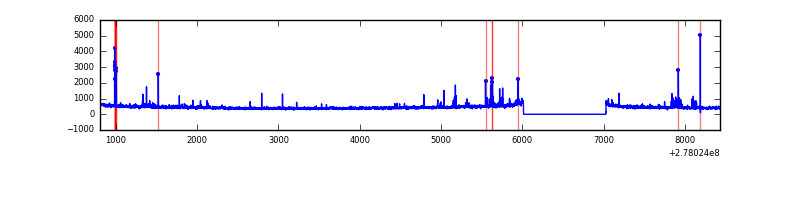 |
Top three noisy pixels from each quadrant. If the there are fewer than three noisy pixels in the level2.evt file, extra rows are filled as -1
| Pixel properties | Quadrant properties | ||||||
|---|---|---|---|---|---|---|---|
| Quadrant | DetID | PixID | Counts | Sigma | Mean | Median | Sigma |
| A | 15 | 174 | 214834 | 1400.89 | 757 | 740 | 152.8 |
| A | 9 | 143 | 24378 | 154.67 | 757 | 740 | 152.8 |
| A | 15 | 69 | 7145 | 41.91 | 757 | 740 | 152.8 |
| B | 15 | 35 | 245881 | 1695.99 | 772 | 752 | 144.5 |
| B | 15 | 19 | 90835 | 623.26 | 772 | 752 | 144.5 |
| B | 0 | 189 | 43145 | 293.31 | 772 | 752 | 144.5 |
| C | 7 | 247 | 211404 | 1211.66 | 753 | 759 | 173.8 |
| C | 3 | 233 | 198533 | 1137.63 | 753 | 759 | 173.8 |
| C | 14 | 238 | 117169 | 669.61 | 753 | 759 | 173.8 |
| D | 10 | 70 | 104936 | 566.93 | 753 | 729 | 183.8 |
| D | 2 | 234 | 27067 | 143.29 | 753 | 729 | 183.8 |
| D | 1 | 52 | 25584 | 135.22 | 753 | 729 | 183.8 |
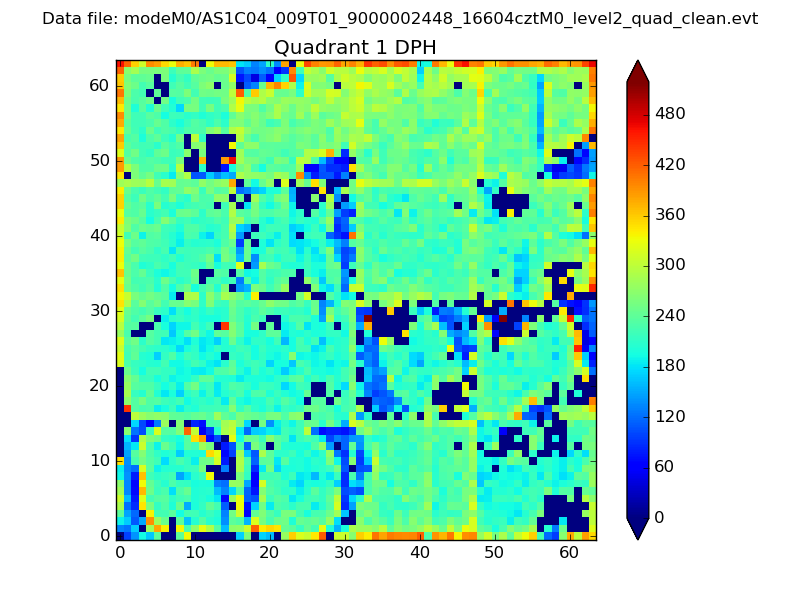
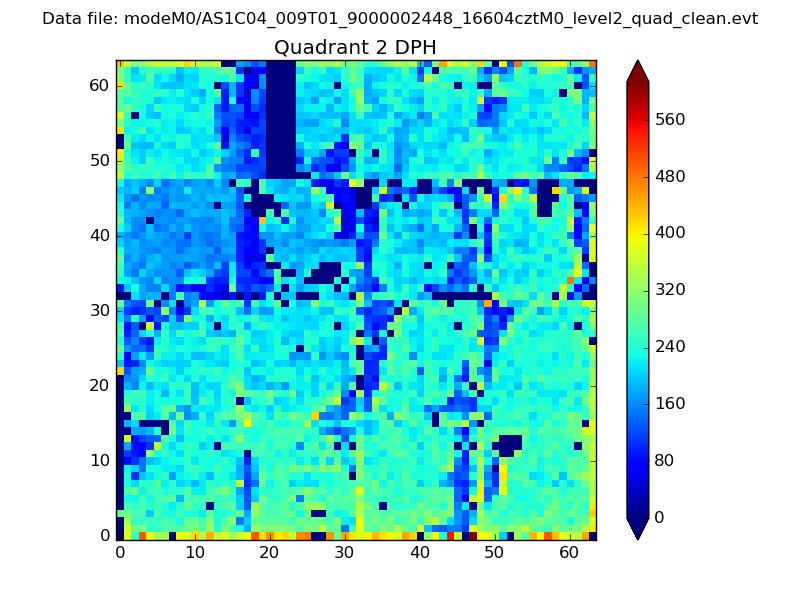
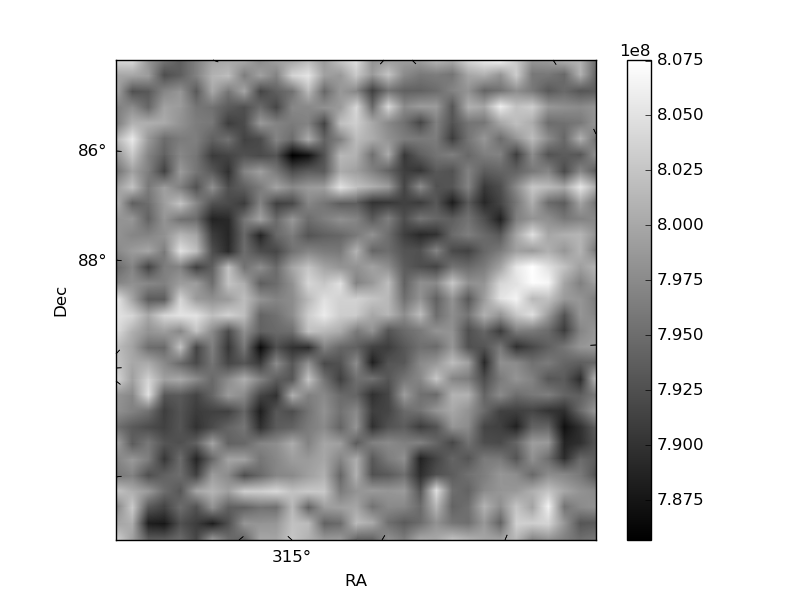
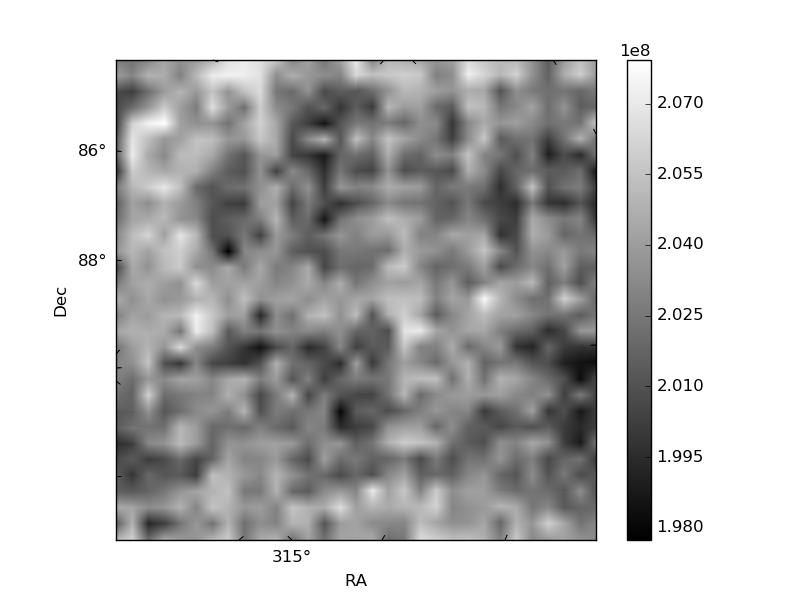
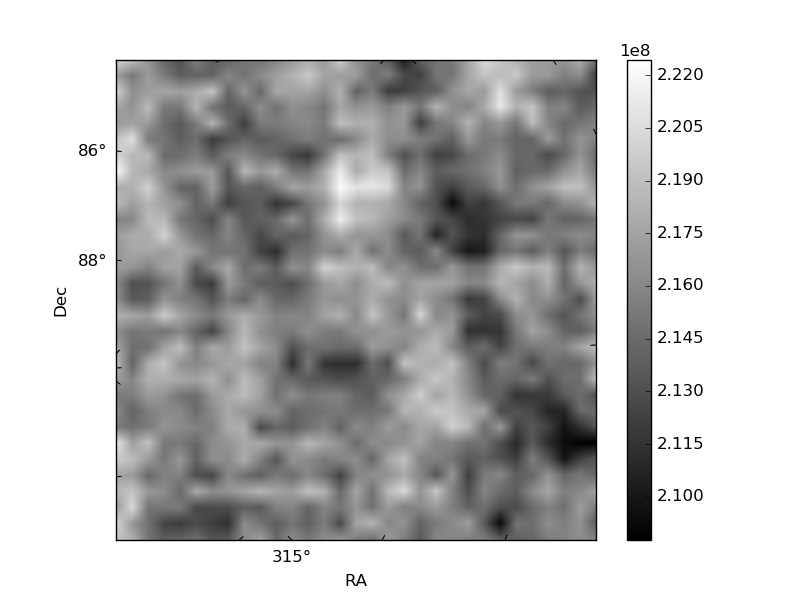
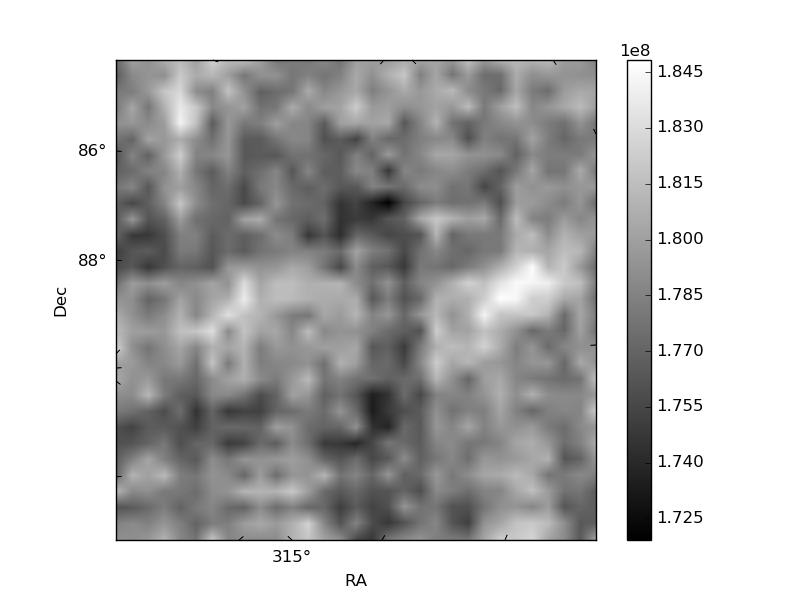
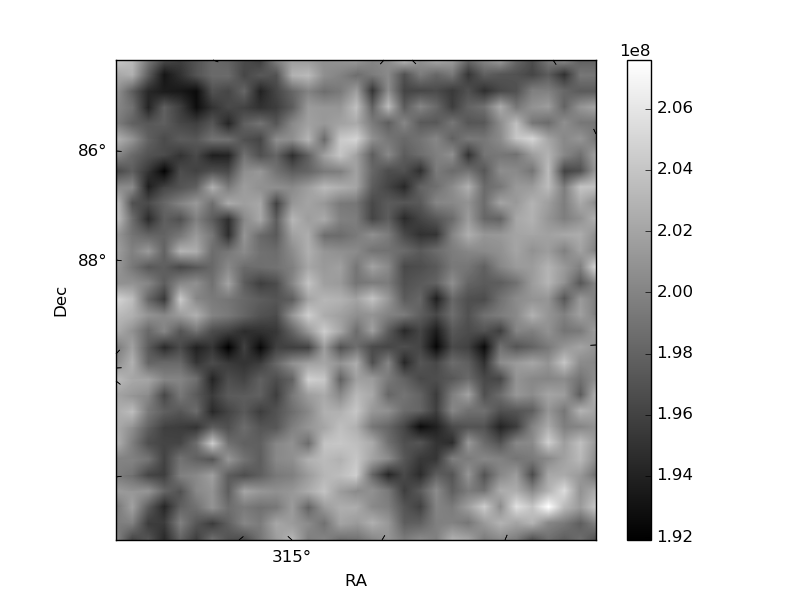
Histogram calculated using DETX and DETY for each event in the final _common_clean file
| Quadrant A | 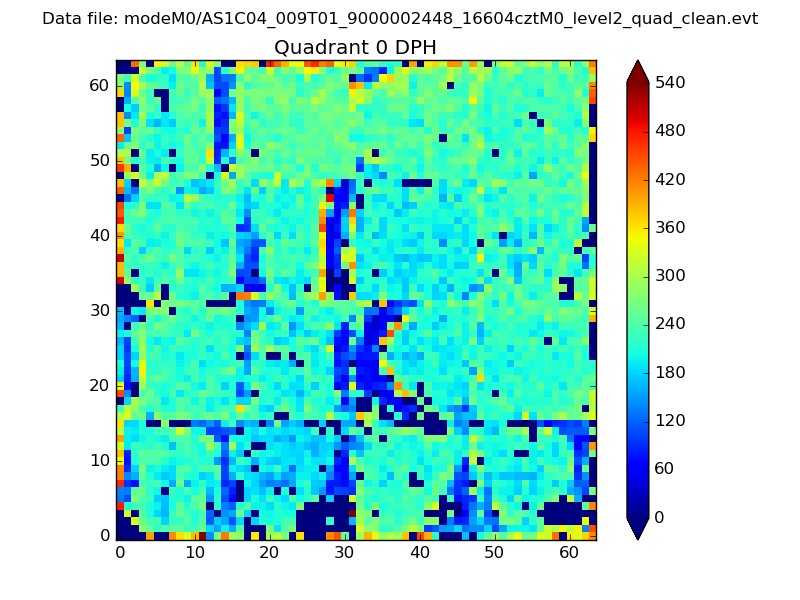 |
 |
Quadrant B |
|---|---|---|---|
| Quadrant D | 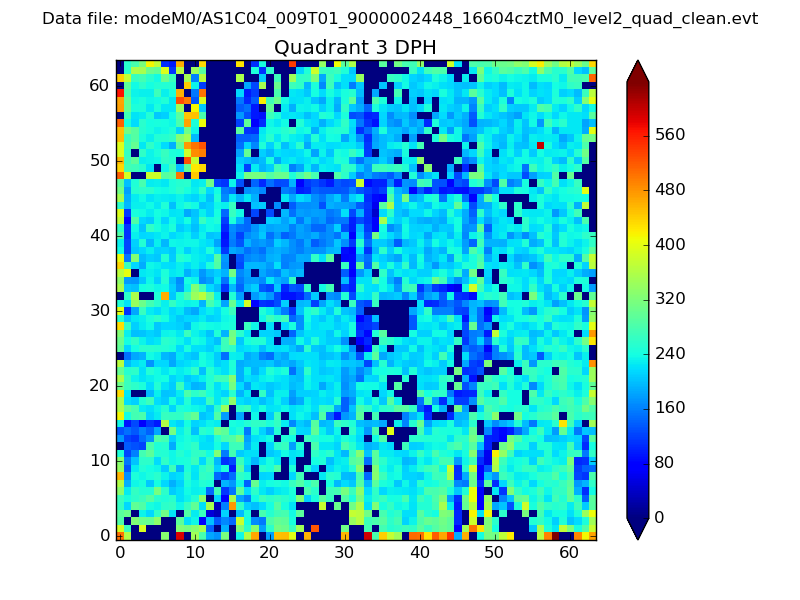 |
 |
Quadrant C |
| Plot type | Count rate plots | Images |
|---|---|---|
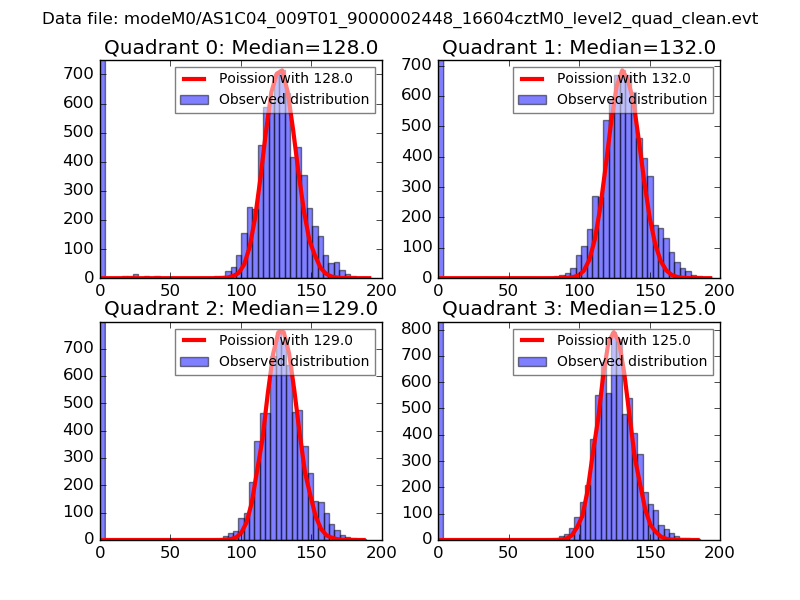
| Comparison with Poisson distribution Blue bars denote a histogram of data divided into 1 sec bins. Red curve is a Poisson curve with rate = median count rate of data. |
 |
 |
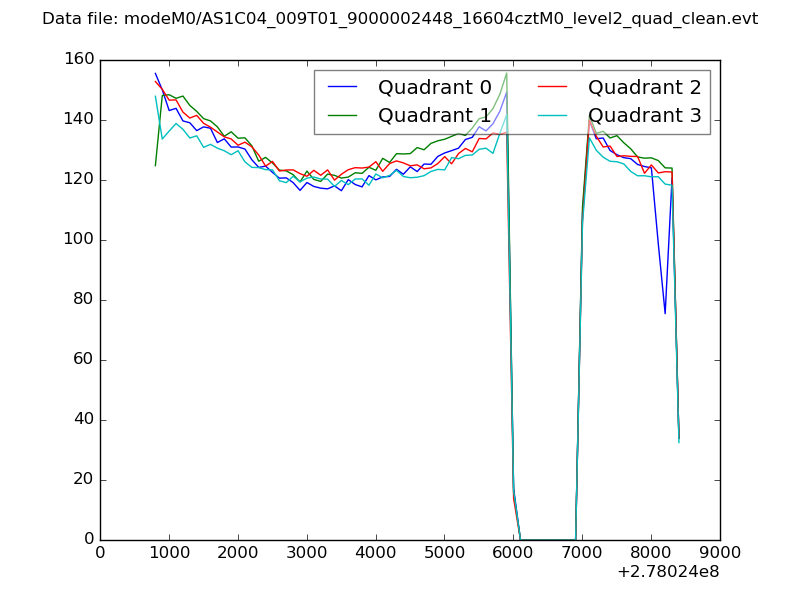
| Quadrant-wise count rates Data is divided into 100 sec bins |
 |
|
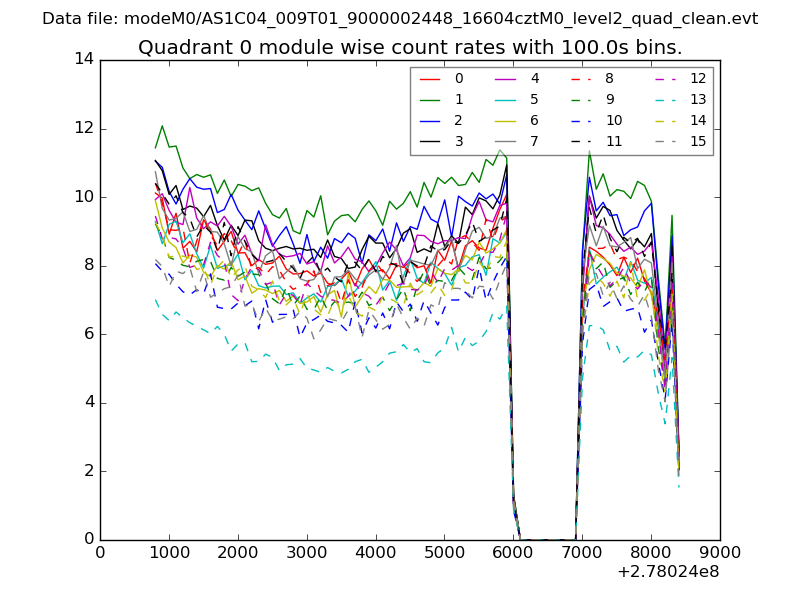
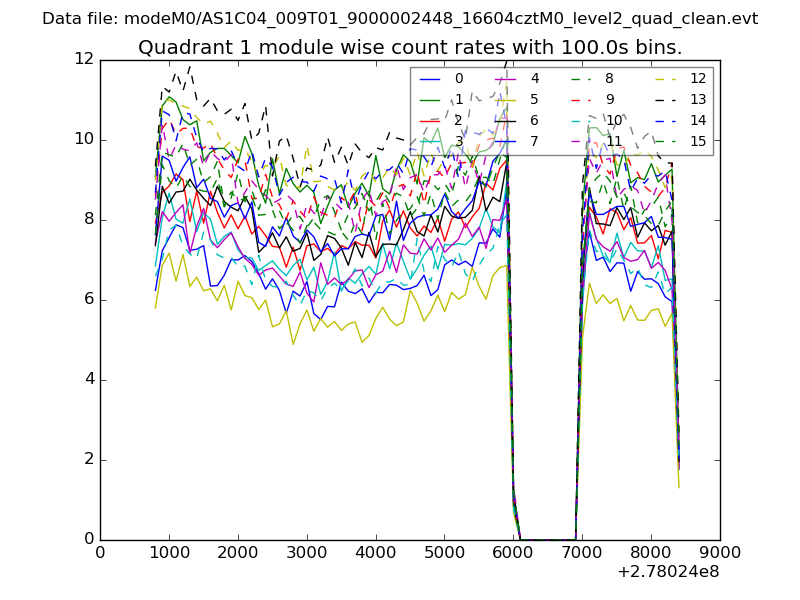
| Module-wise count rates for Quadrant A Data is divided into 100 sec bins |
 |
 |
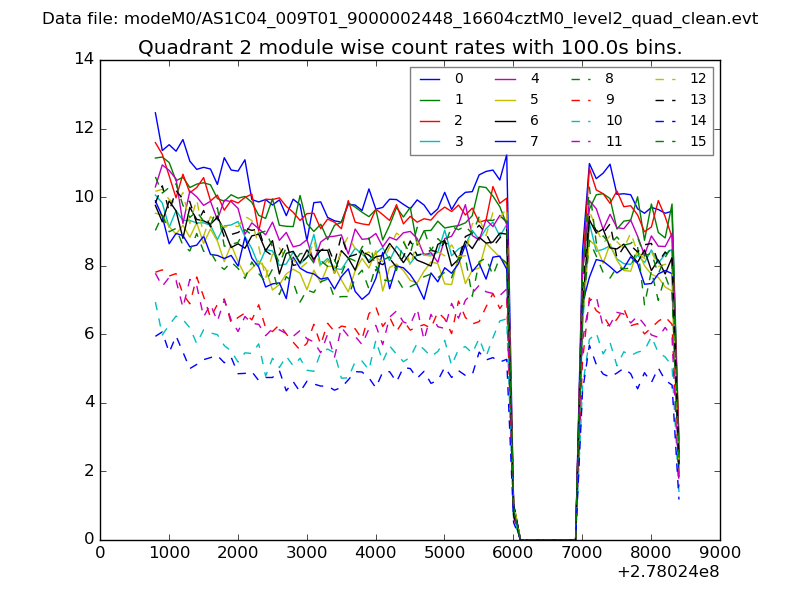
| Module-wise count rates for Quadrant B Data is divided into 100 sec bins |
 |
 |
| Module-wise count rates for Quadrant C Data is divided into 100 sec bins |
 |
 |
| Module-wise count rates for Quadrant D Data is divided into 100 sec bins |
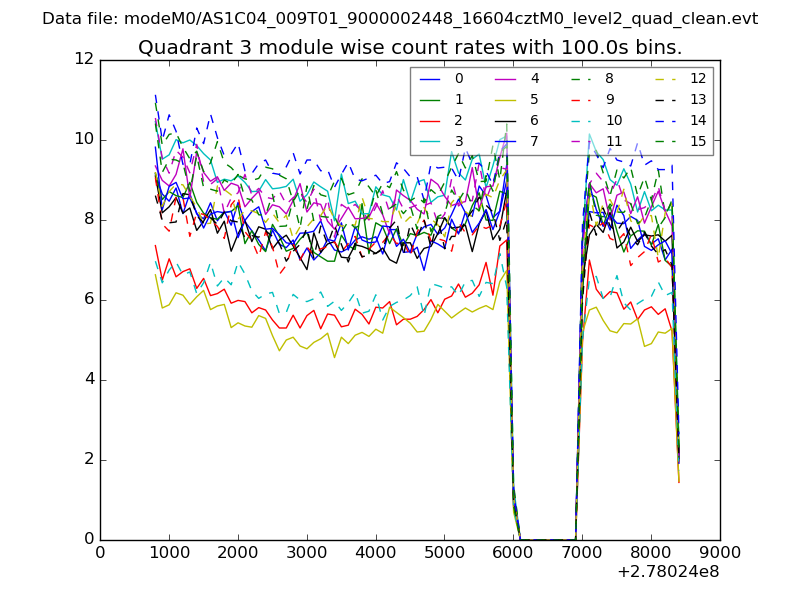 |
 |
| Parameter | Plot |
|---|---|
| CZT HV Monitor | 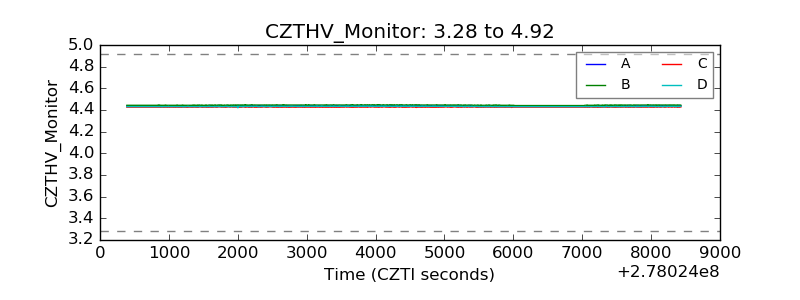 |
| D_VDD | 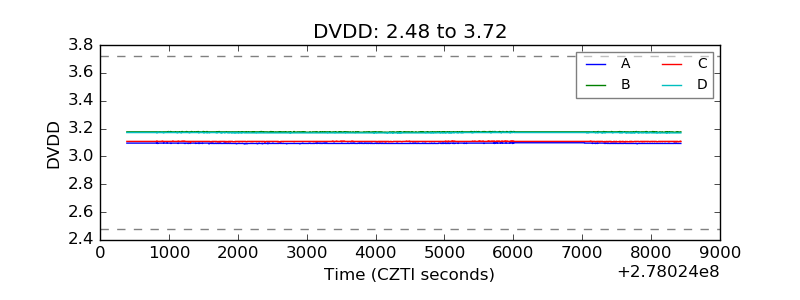 |
| Temperature 1 | 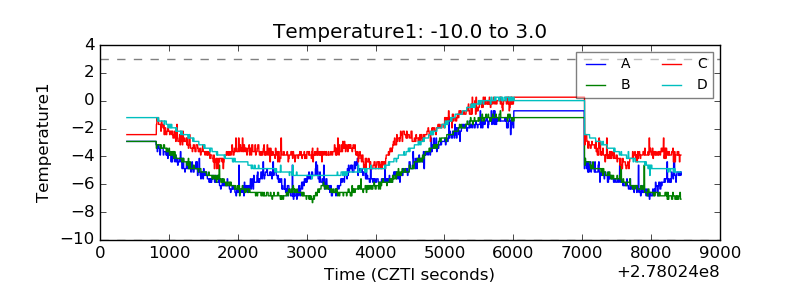 |
| Veto HV Monitor |  |
| Veto LLD | 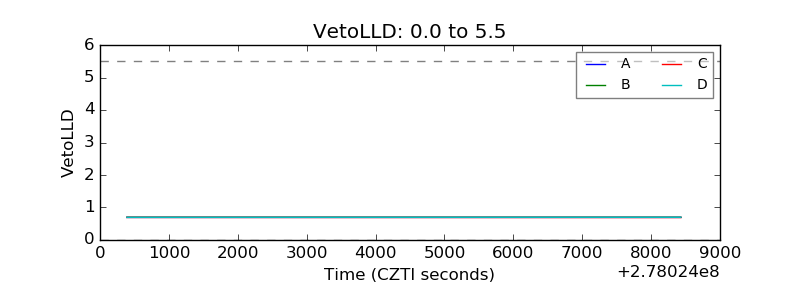 |
| Alpha Counter | 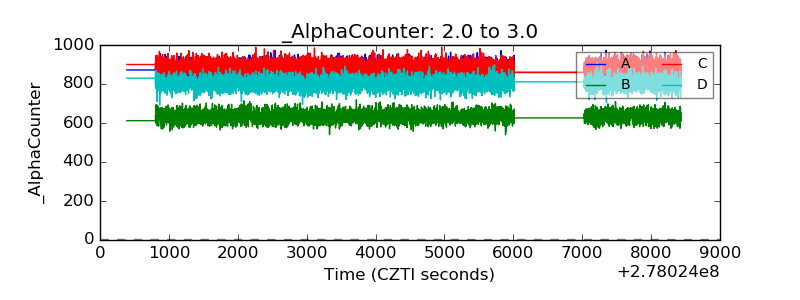 |
| _CPM_Rate | 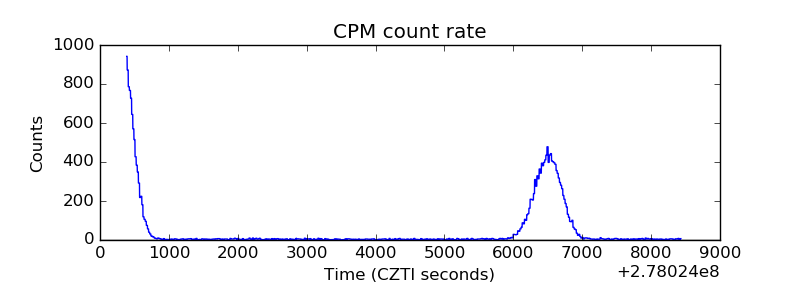 |
| CZT Counter | 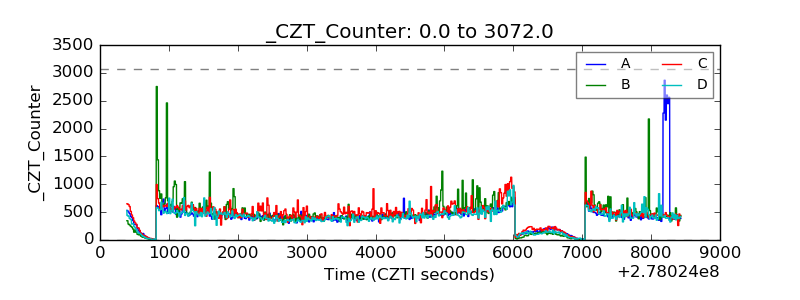 |
| +2.5 Volts monitor |  |
| +5 Volts monitor |  |
| _ROLL_ROT | 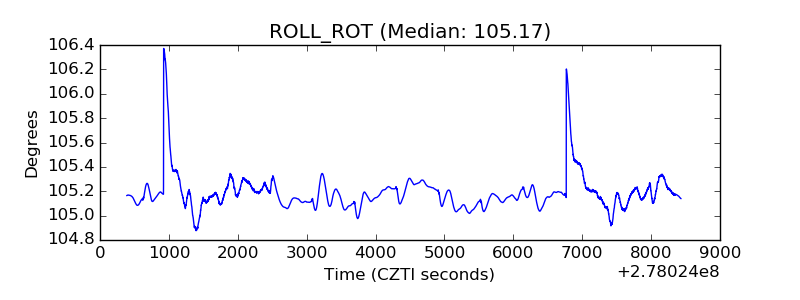 |
| _Roll_DEC | 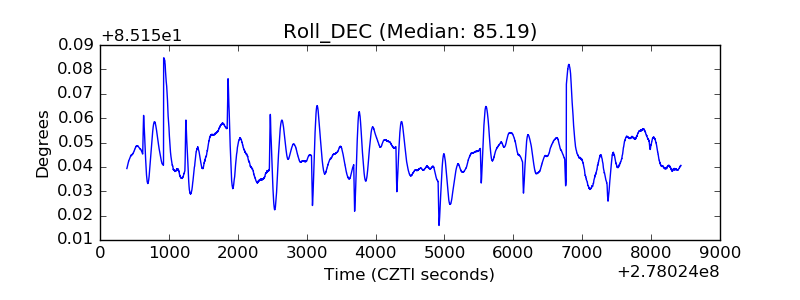 |
| _Roll_RA | 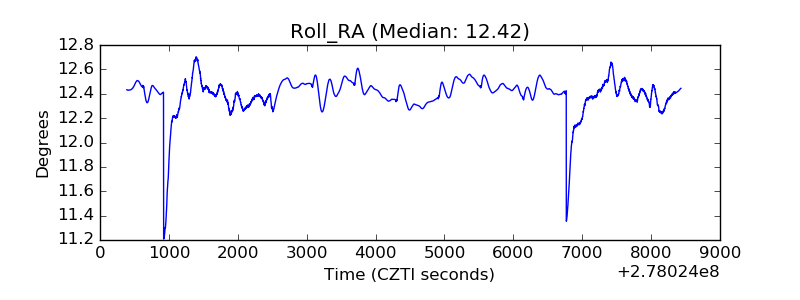 |
| Veto Counter | 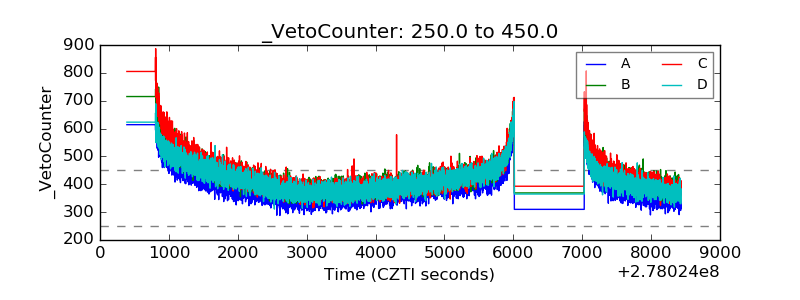 |