| Param | Original file | Final file |
|---|---|---|
| Filename | modeM0/AS1C04_009T01_9000002448_16605cztM0_level2.evt | modeM0/AS1C04_009T01_9000002448_16605cztM0_level2_quad_clean.evt |
| Size (bytes) | 498,640,320 | 138,484,800 |
| Size | 475.5 MB | 132.1 MB |
| Events in quadrant A | 3,497,321 | 915,522 |
| Events in quadrant B | 3,921,553 | 944,727 |
| Events in quadrant C | 3,660,639 | 921,870 |
| Events in quadrant D | 3,517,523 | 895,826 |
| Mode M0 | |||
|---|---|---|---|
| Quadrant | BADHDUFLAG | Total packets | Discarded packets |
| A | 0 | 15763 | 3 |
| B | 0 | 16898 | 2 |
| C | 0 | 15717 | 2 |
| D | 0 | 15947 | 2 |
| Mode SS | |||
|---|---|---|---|
| Quadrant | BADHDUFLAG | Total packets | Discarded packets |
| A | 0 | 152 | 0 |
| B | 0 | 152 | 0 |
| C | 0 | 152 | 0 |
| D | 0 | 152 | 0 |
| Mode M9 | |||
|---|---|---|---|
| Quadrant | BADHDUFLAG | Total packets | Discarded packets |
| A | 0 | 17 | 0 |
| B | 0 | 17 | 0 |
| C | 0 | 17 | 0 |
| D | 0 | 17 | 0 |
| Quadrant | Total seconds | Saturated seconds | Saturation percentage |
|---|---|---|---|
| A | 7422 | 122 | 1.643762% |
| B | 7422 | 170 | 2.290488% |
| C | 7422 | 146 | 1.967125% |
| D | 7422 | 72 | 0.970089% |
Noise dominated data is calculated using 1-second bins in cleaned event files. If a bin has >2000 counts, and if more than 50% of those come from <1% of pixels, then it is considered to be noise-dominated and hence unusable.
| Quadrant | # 1 sec bins | Bins with >0 counts | Bins with >2000 counts | High rate bins dominated by noise | Noise dominated (total time) | Noise dominated (detector-on time) | Marked lightcurve |
|---|---|---|---|---|---|---|---|
| A | 9083 | 7425 | 61 | 61 | 0.67% | 0.82% | 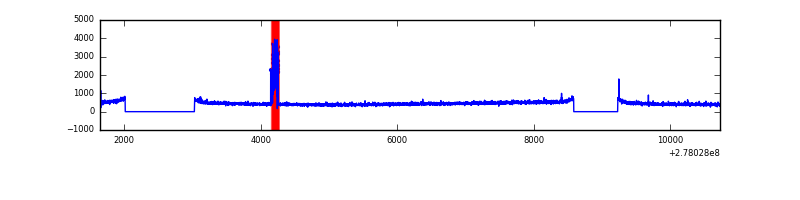 |
| B | 9083 | 7425 | 6 | 6 | 0.07% | 0.08% | 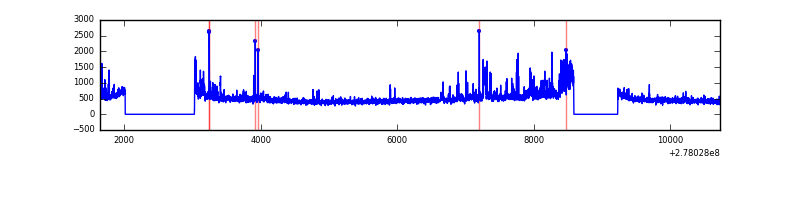 |
| C | 9083 | 7425 | 0 | 0 | 0.00% | 0.00% | 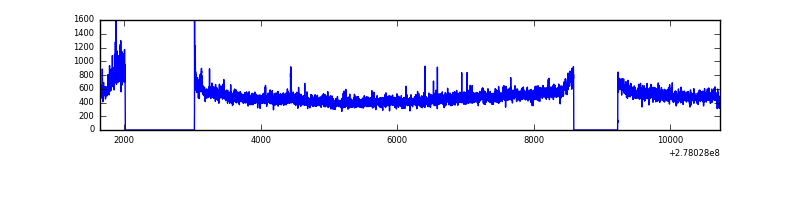 |
| D | 9083 | 7425 | 19 | 19 | 0.21% | 0.26% | 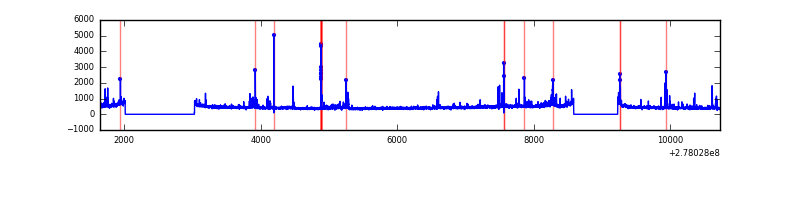 |
Top three noisy pixels from each quadrant. If the there are fewer than three noisy pixels in the level2.evt file, extra rows are filled as -1
| Pixel properties | Quadrant properties | ||||||
|---|---|---|---|---|---|---|---|
| Quadrant | DetID | PixID | Counts | Sigma | Mean | Median | Sigma |
| A | 15 | 174 | 212471 | 1240.25 | 849 | 831 | 170.6 |
| A | 15 | 69 | 11699 | 63.69 | 849 | 831 | 170.6 |
| A | 0 | 226 | 7327 | 38.06 | 849 | 831 | 170.6 |
| B | 0 | 189 | 179203 | 1095.15 | 863 | 842 | 162.9 |
| B | 15 | 35 | 136207 | 831.15 | 863 | 842 | 162.9 |
| B | 4 | 216 | 46520 | 280.47 | 863 | 842 | 162.9 |
| C | 3 | 233 | 224026 | 1151.43 | 837 | 842 | 193.8 |
| C | 14 | 238 | 129059 | 661.48 | 837 | 842 | 193.8 |
| C | 7 | 247 | 39250 | 198.15 | 837 | 842 | 193.8 |
| D | 10 | 70 | 94350 | 456.92 | 838 | 812 | 204.7 |
| D | 2 | 16 | 79000 | 381.93 | 838 | 812 | 204.7 |
| D | 1 | 52 | 76566 | 370.04 | 838 | 812 | 204.7 |
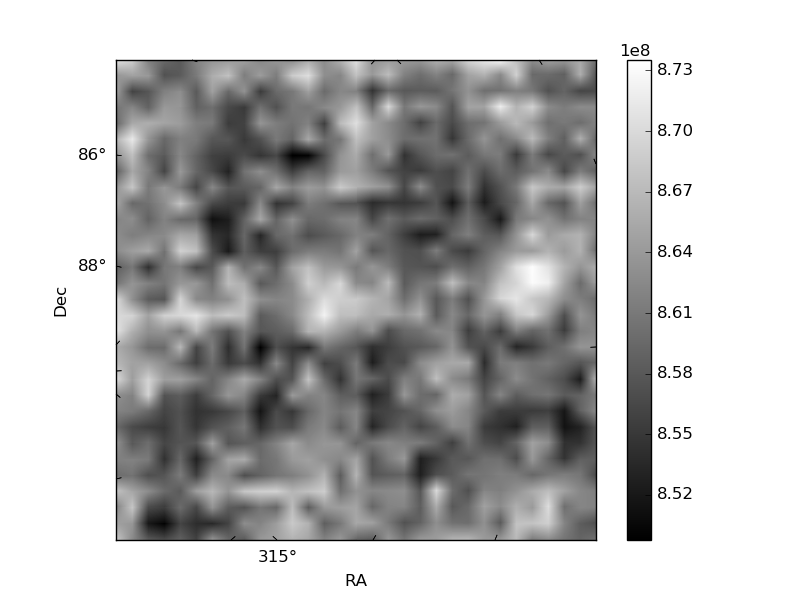
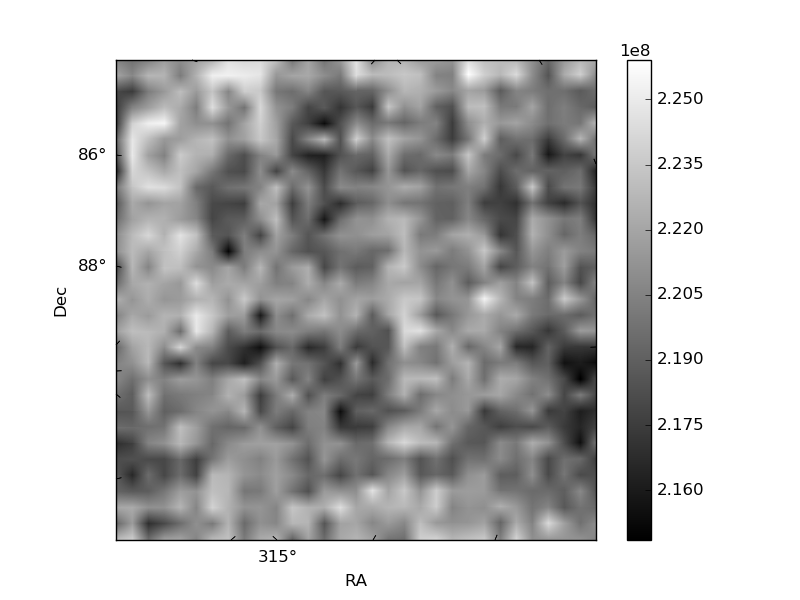
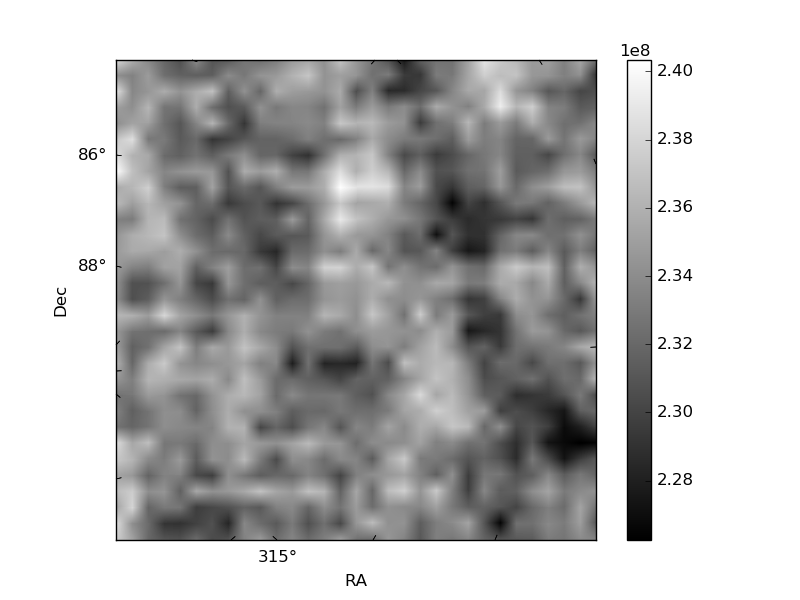
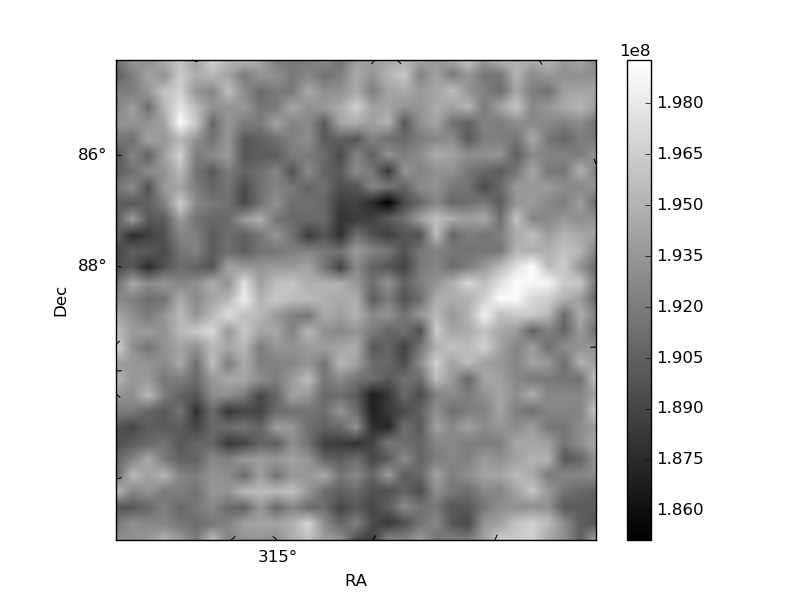
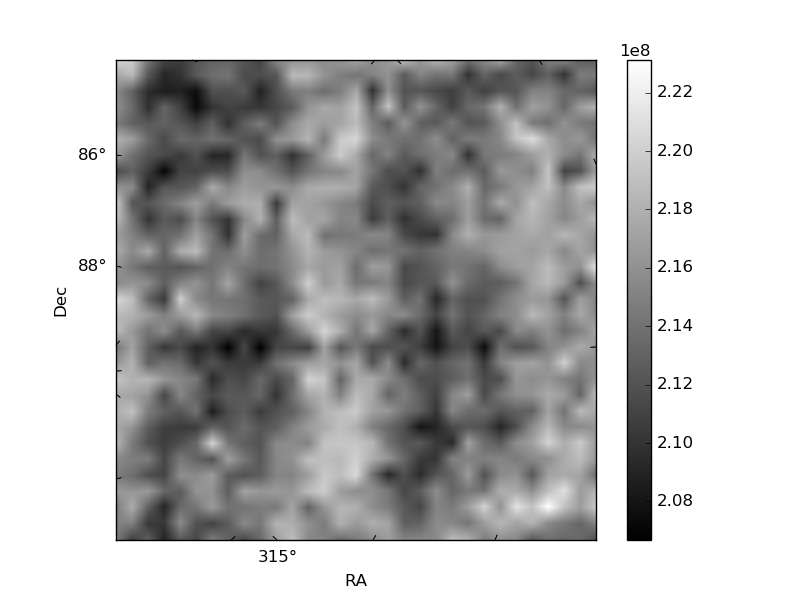
Histogram calculated using DETX and DETY for each event in the final _common_clean file
| Quadrant A | 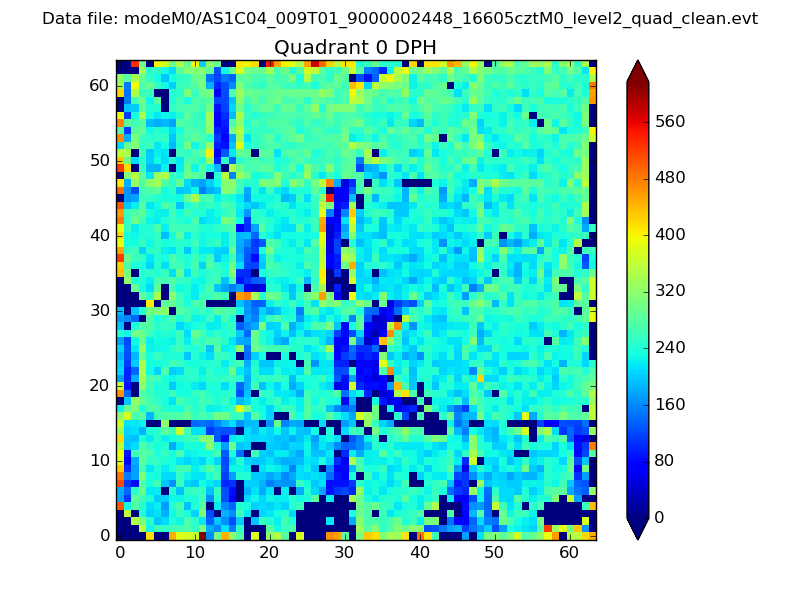 |
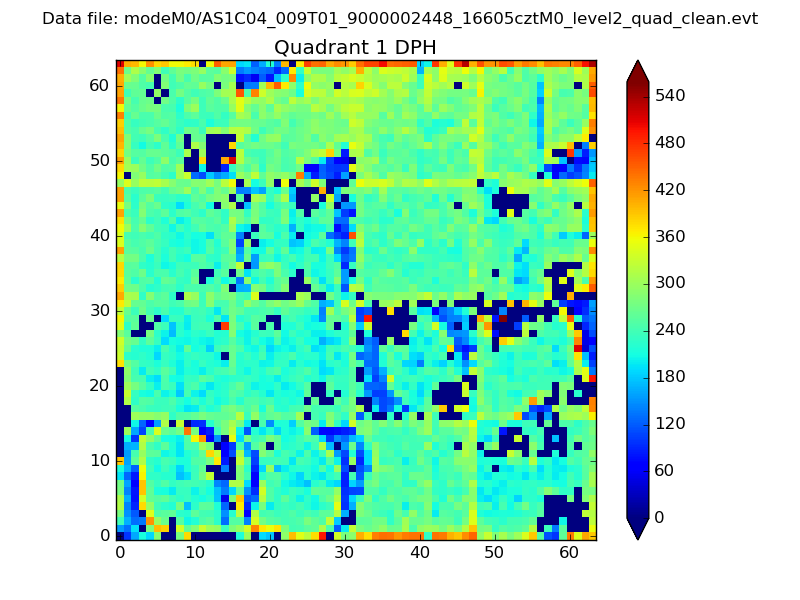 |
Quadrant B |
|---|---|---|---|
| Quadrant D | 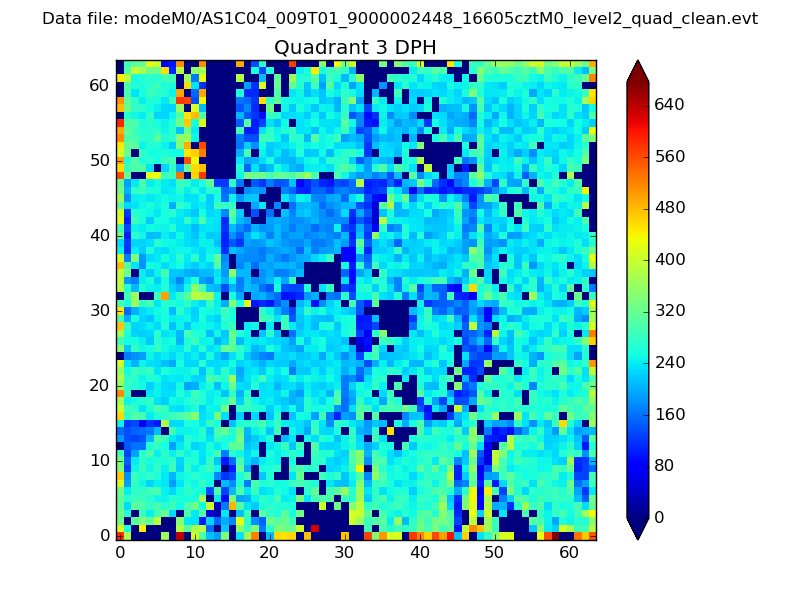 |
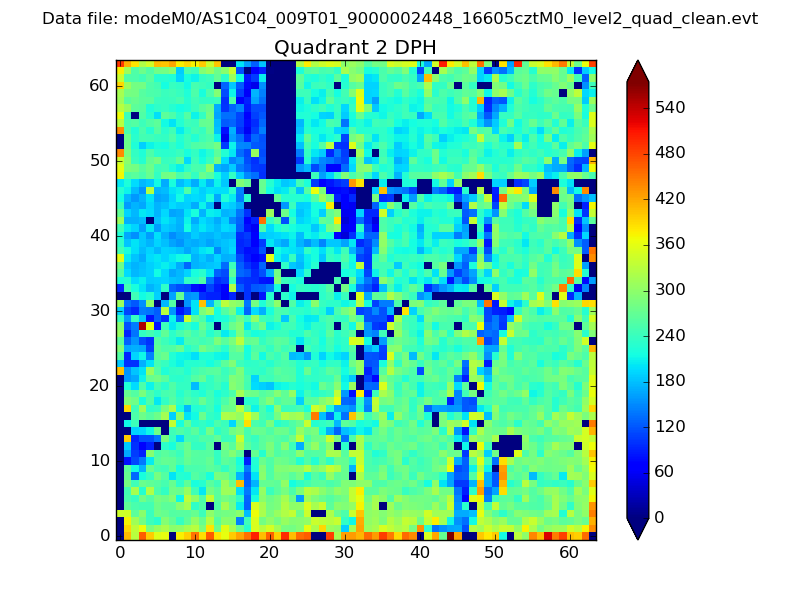 |
Quadrant C |
| Plot type | Count rate plots | Images |
|---|---|---|
| Comparison with Poisson distribution Blue bars denote a histogram of data divided into 1 sec bins. Red curve is a Poisson curve with rate = median count rate of data. |
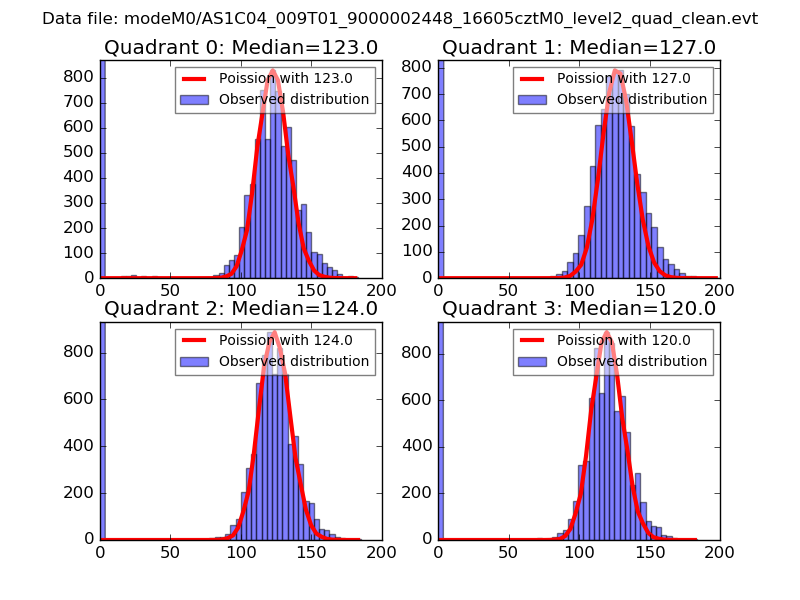 |
 |
| Quadrant-wise count rates Data is divided into 100 sec bins |
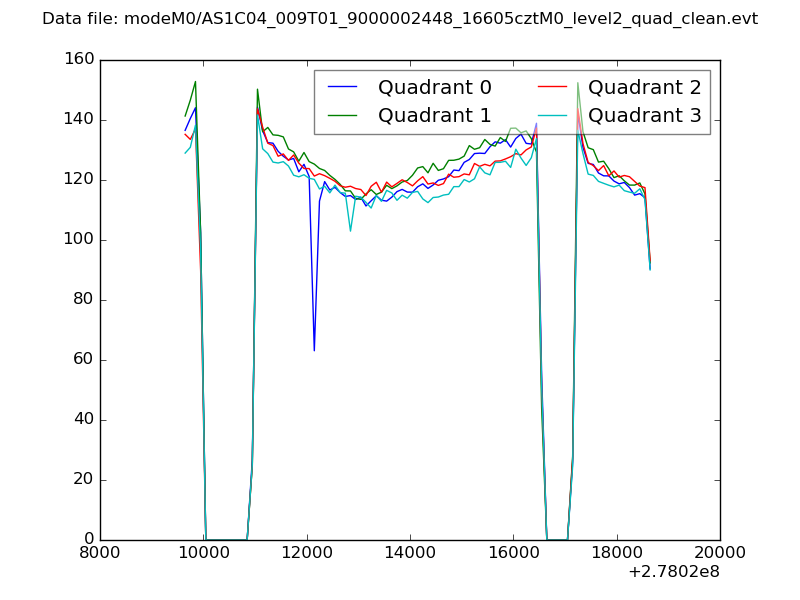 |
|
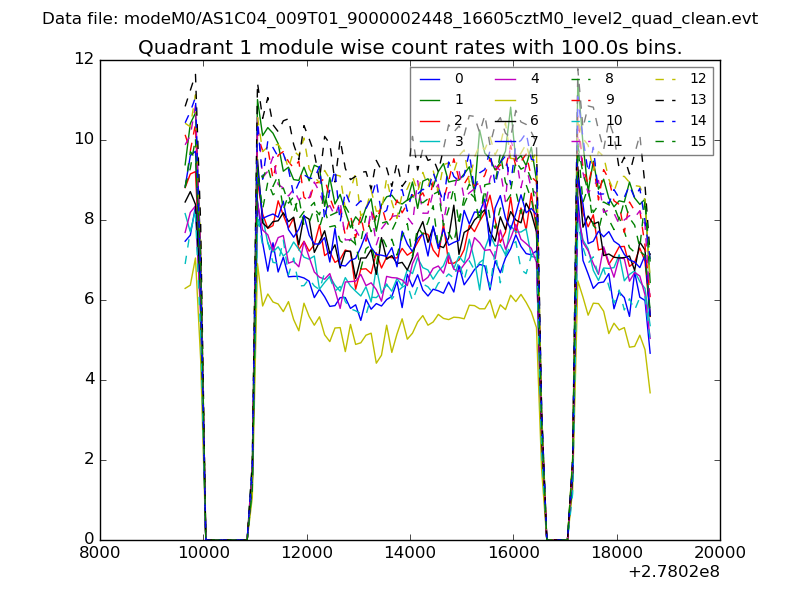
| Module-wise count rates for Quadrant A Data is divided into 100 sec bins |
 |
 |
| Module-wise count rates for Quadrant B Data is divided into 100 sec bins |
 |
 |
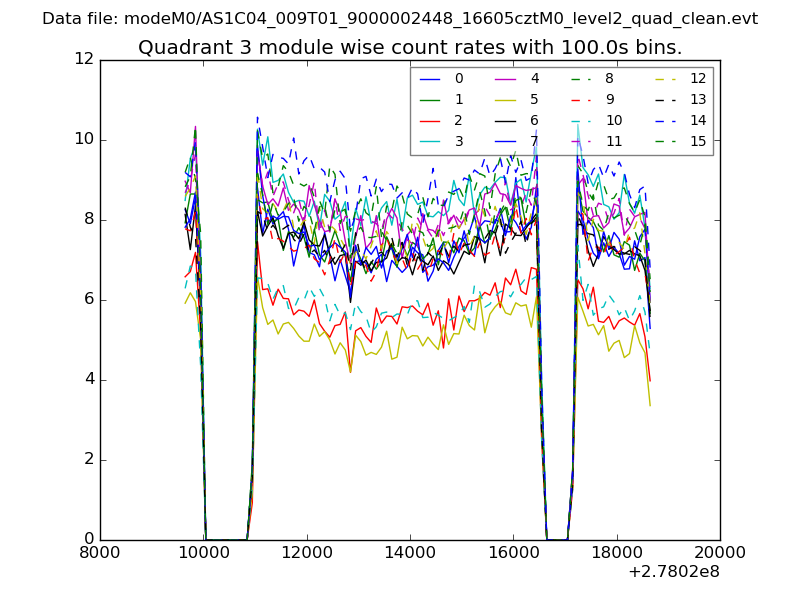
| Module-wise count rates for Quadrant C Data is divided into 100 sec bins |
 |
 |
| Module-wise count rates for Quadrant D Data is divided into 100 sec bins |
 |
 |
| Parameter | Plot |
|---|---|
| CZT HV Monitor |  |
| D_VDD | 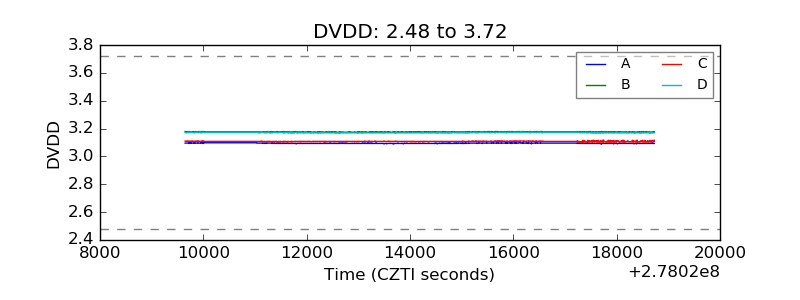 |
| Temperature 1 | 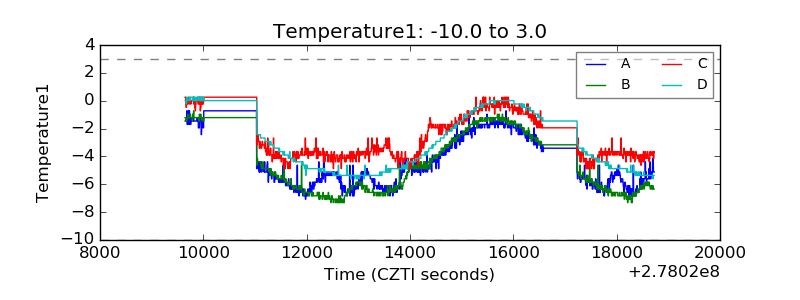 |
| Veto HV Monitor | 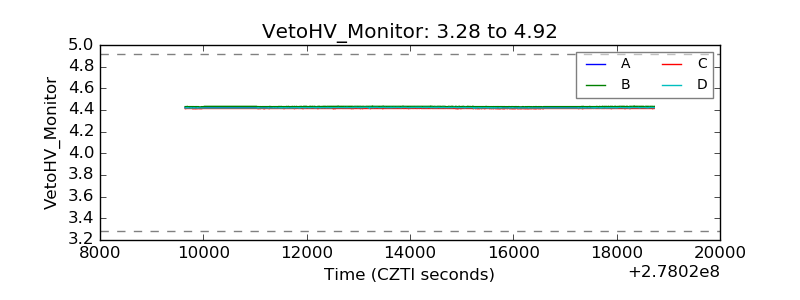 |
| Veto LLD | 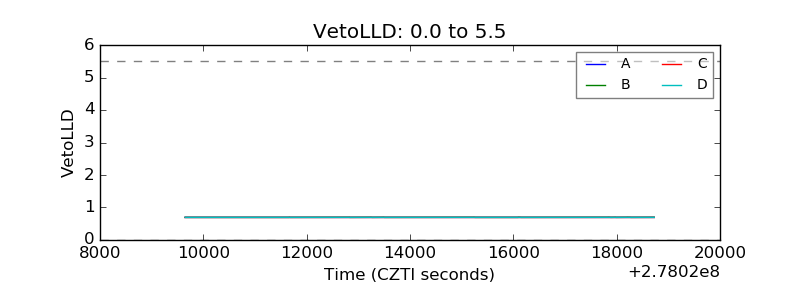 |
| Alpha Counter | 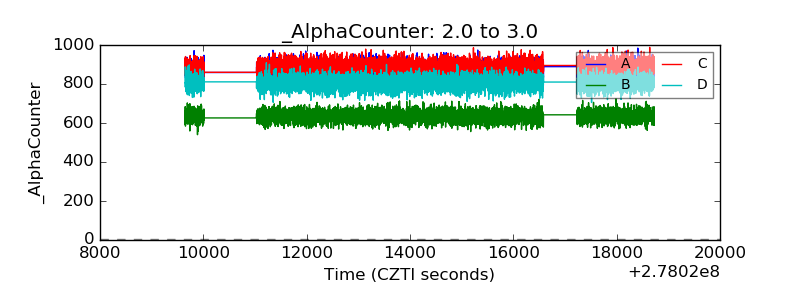 |
| _CPM_Rate | 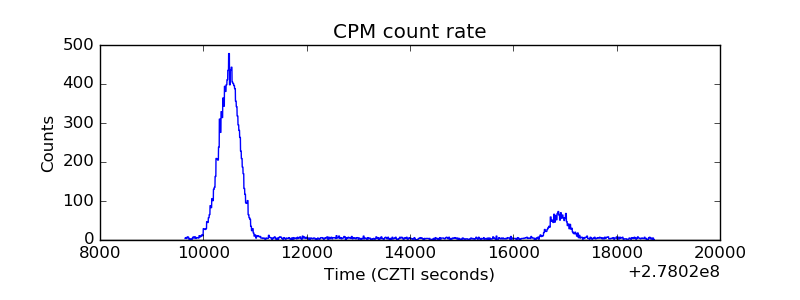 |
| CZT Counter | 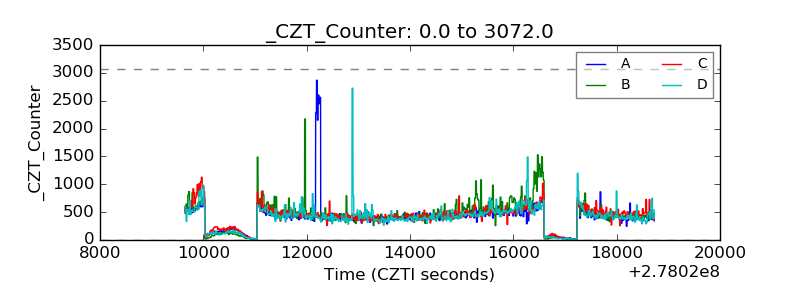 |
| +2.5 Volts monitor |  |
| +5 Volts monitor |  |
| _ROLL_ROT | 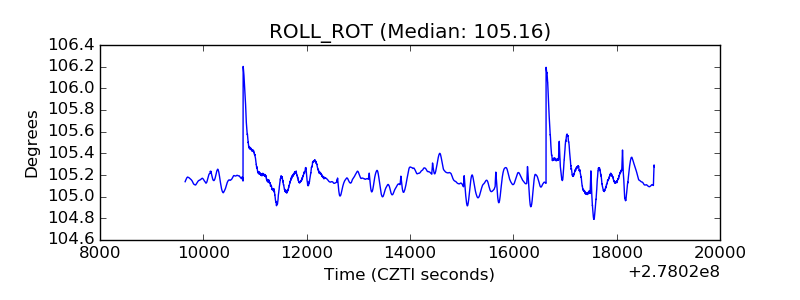 |
| _Roll_DEC | 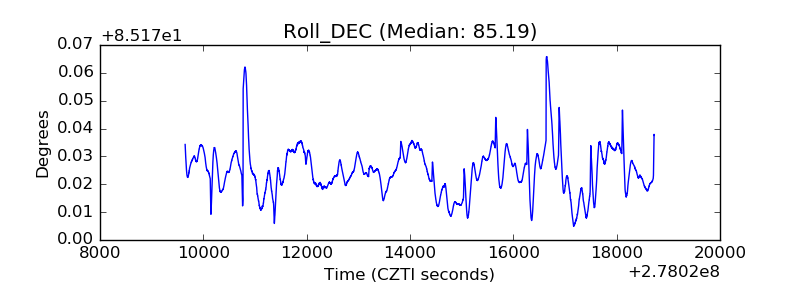 |
| _Roll_RA | 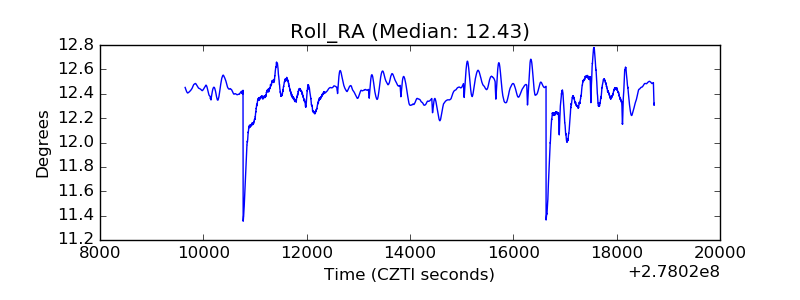 |
| Veto Counter | 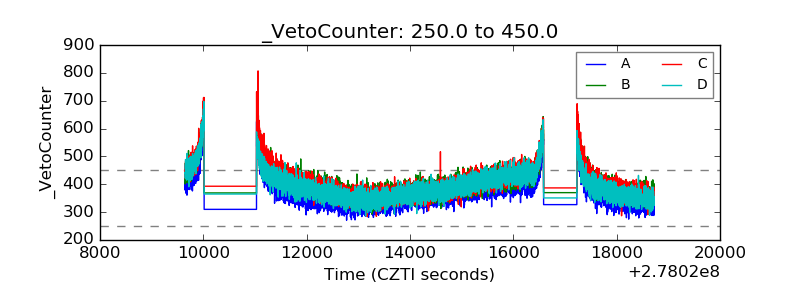 |