| Param | Original file | Final file |
|---|---|---|
| Filename | modeM0/AS1C04_009T01_9000002448_16606cztM0_level2.evt | modeM0/AS1C04_009T01_9000002448_16606cztM0_level2_quad_clean.evt |
| Size (bytes) | 568,152,000 | 154,693,440 |
| Size | 541.8 MB | 147.5 MB |
| Events in quadrant A | 3,778,531 | 1,026,103 |
| Events in quadrant B | 4,599,855 | 1,049,342 |
| Events in quadrant C | 4,204,802 | 1,023,799 |
| Events in quadrant D | 4,051,474 | 1,001,034 |
| Mode M0 | |||
|---|---|---|---|
| Quadrant | BADHDUFLAG | Total packets | Discarded packets |
| A | 0 | 17281 | 3 |
| B | 0 | 19510 | 2 |
| C | 0 | 17903 | 2 |
| D | 0 | 18182 | 2 |
| Mode SS | |||
|---|---|---|---|
| Quadrant | BADHDUFLAG | Total packets | Discarded packets |
| A | 0 | 172 | 0 |
| B | 0 | 172 | 0 |
| C | 0 | 172 | 0 |
| D | 0 | 172 | 0 |
| Mode M9 | |||
|---|---|---|---|
| Quadrant | BADHDUFLAG | Total packets | Discarded packets |
| A | 0 | 10 | 0 |
| B | 0 | 10 | 0 |
| C | 0 | 10 | 0 |
| D | 0 | 10 | 0 |
| Quadrant | Total seconds | Saturated seconds | Saturation percentage |
|---|---|---|---|
| A | 8429 | 23 | 0.272867% |
| B | 8429 | 172 | 2.040574% |
| C | 8429 | 88 | 1.044015% |
| D | 8429 | 40 | 0.474552% |
Noise dominated data is calculated using 1-second bins in cleaned event files. If a bin has >2000 counts, and if more than 50% of those come from <1% of pixels, then it is considered to be noise-dominated and hence unusable.
| Quadrant | # 1 sec bins | Bins with >0 counts | Bins with >2000 counts | High rate bins dominated by noise | Noise dominated (total time) | Noise dominated (detector-on time) | Marked lightcurve |
|---|---|---|---|---|---|---|---|
| A | 9355 | 8432 | 1 | 1 | 0.01% | 0.01% | 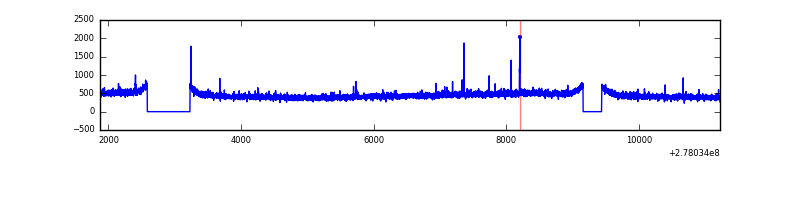 |
| B | 9355 | 8432 | 8 | 8 | 0.09% | 0.09% | 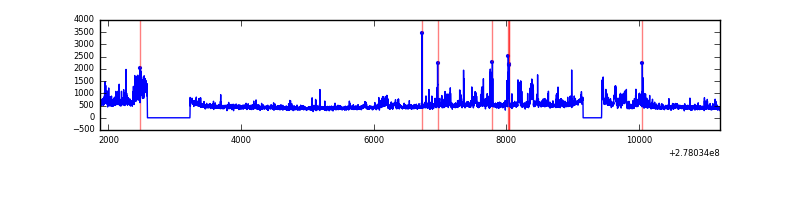 |
| C | 9355 | 8432 | 0 | 0 | 0.00% | 0.00% | 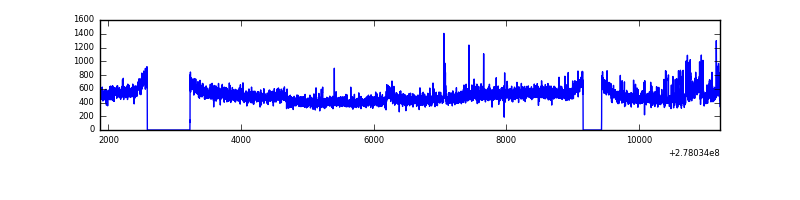 |
| D | 9355 | 8432 | 18 | 18 | 0.19% | 0.21% | 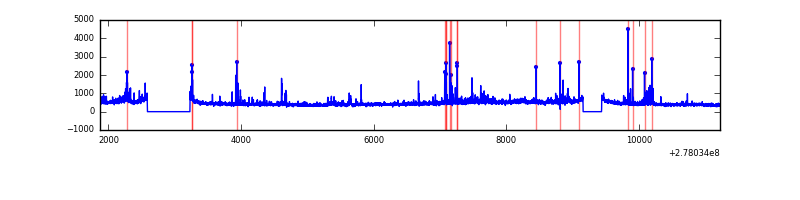 |
Top three noisy pixels from each quadrant. If the there are fewer than three noisy pixels in the level2.evt file, extra rows are filled as -1
| Pixel properties | Quadrant properties | ||||||
|---|---|---|---|---|---|---|---|
| Quadrant | DetID | PixID | Counts | Sigma | Mean | Median | Sigma |
| A | 9 | 143 | 20255 | 98.2 | 970 | 948 | 196.6 |
| A | 15 | 69 | 11287 | 52.59 | 970 | 948 | 196.6 |
| A | 15 | 174 | 8637 | 39.11 | 970 | 948 | 196.6 |
| B | 0 | 189 | 243513 | 1320.5 | 978 | 953 | 183.7 |
| B | 15 | 35 | 216789 | 1175.01 | 978 | 953 | 183.7 |
| B | 0 | 85 | 68966 | 370.26 | 978 | 953 | 183.7 |
| C | 3 | 233 | 205771 | 926.15 | 948 | 951 | 221.2 |
| C | 14 | 238 | 147200 | 661.3 | 948 | 951 | 221.2 |
| C | 7 | 247 | 138178 | 620.51 | 948 | 951 | 221.2 |
| D | 1 | 52 | 232126 | 1003.63 | 949 | 918 | 230.4 |
| D | 10 | 70 | 115230 | 496.21 | 949 | 918 | 230.4 |
| D | 7 | 38 | 76344 | 327.41 | 949 | 918 | 230.4 |
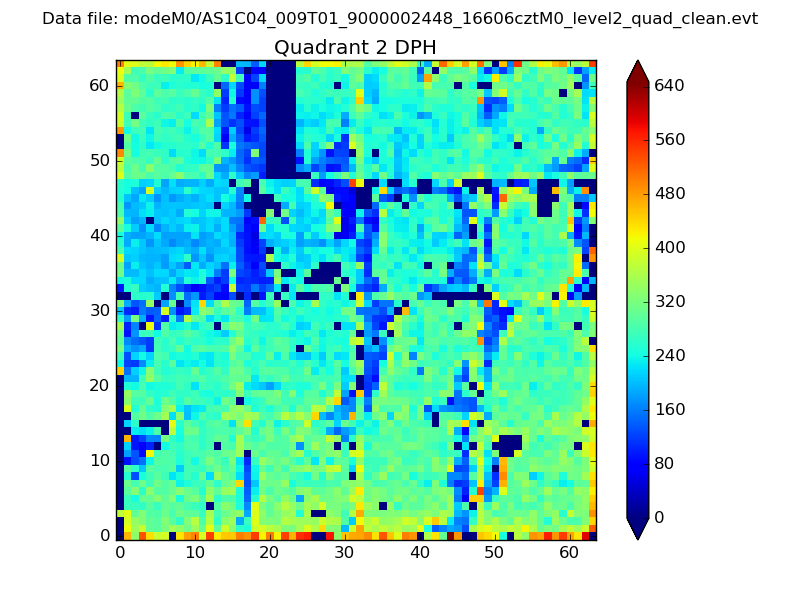
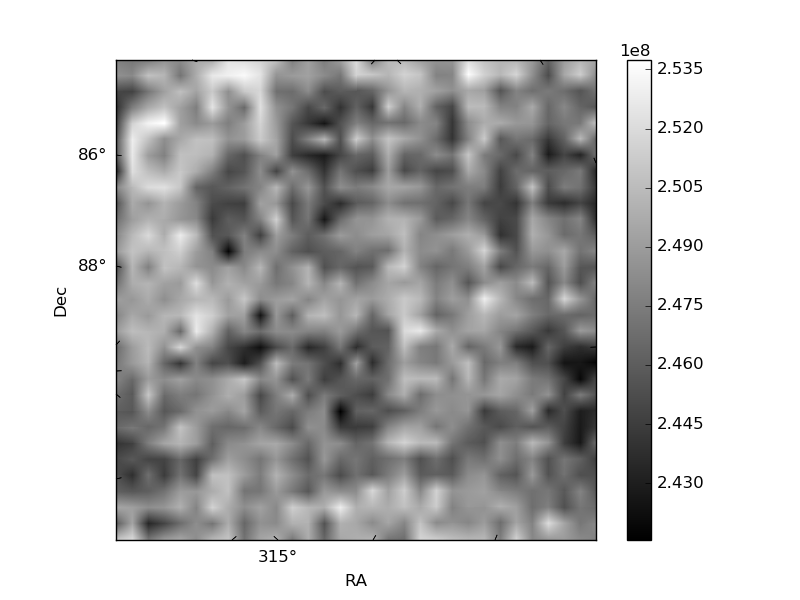
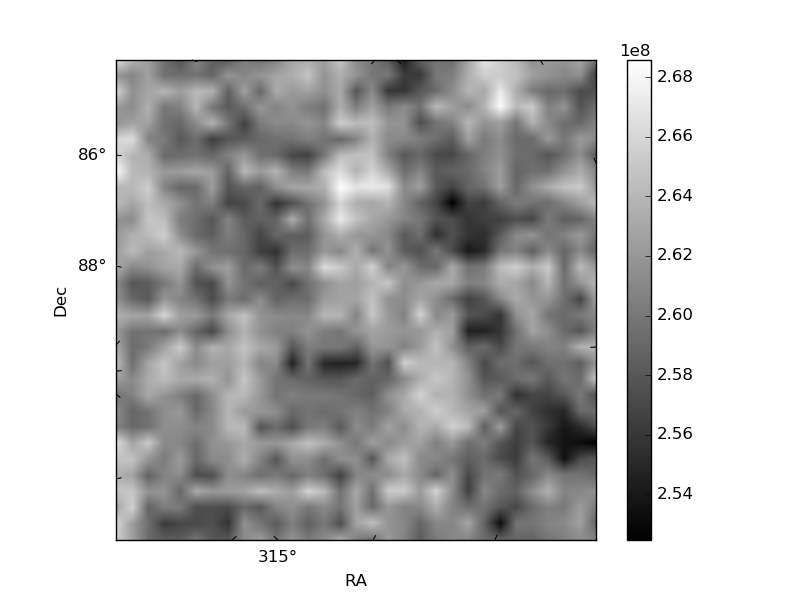
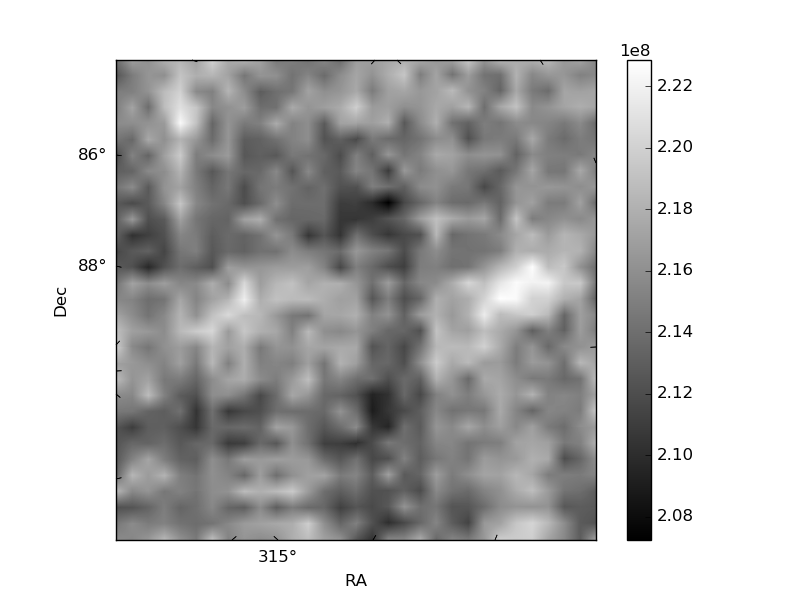
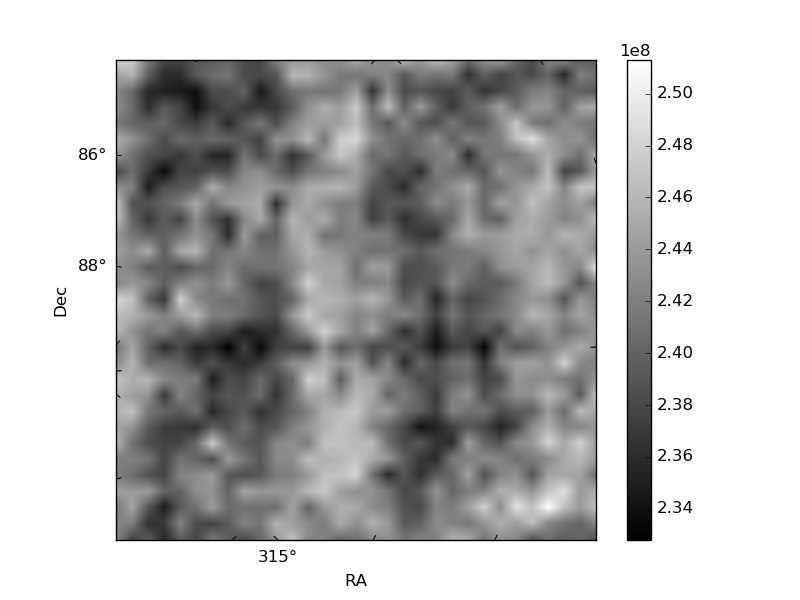
Histogram calculated using DETX and DETY for each event in the final _common_clean file
| Quadrant A | 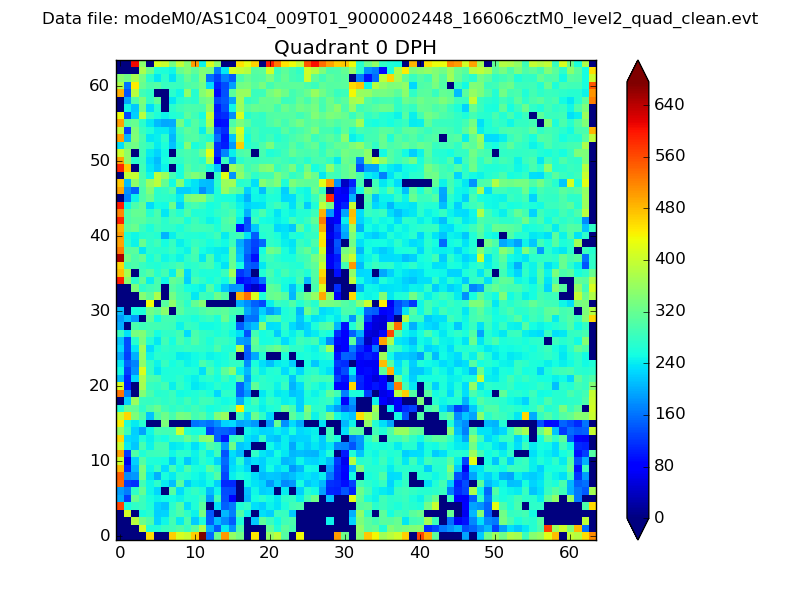 |
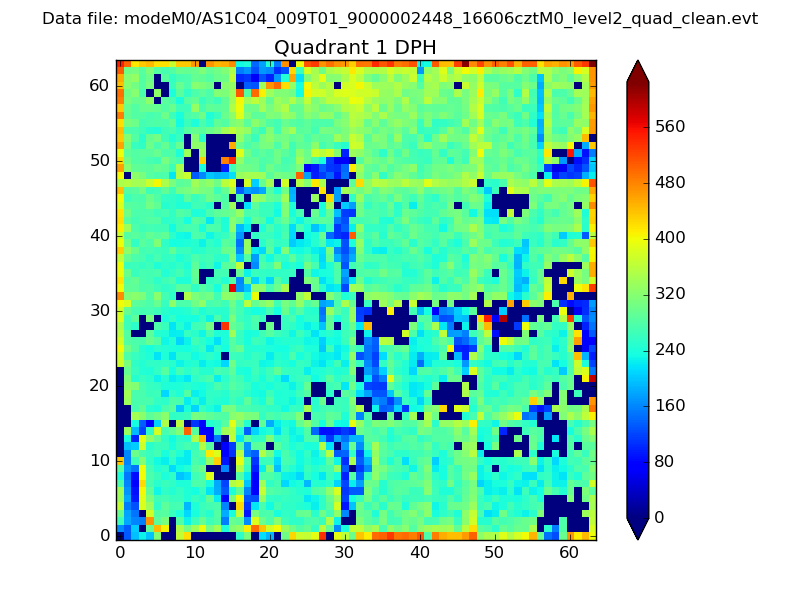 |
Quadrant B |
|---|---|---|---|
| Quadrant D | 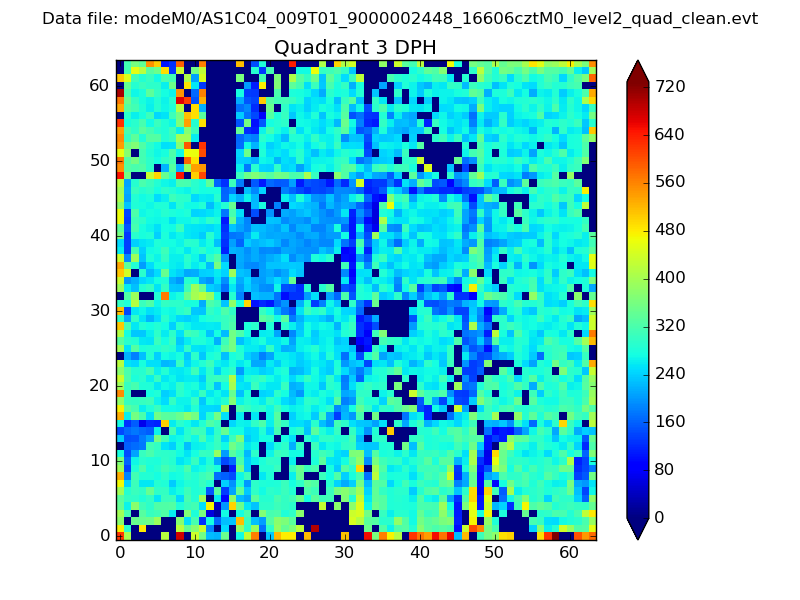 |
 |
Quadrant C |
| Plot type | Count rate plots | Images |
|---|---|---|
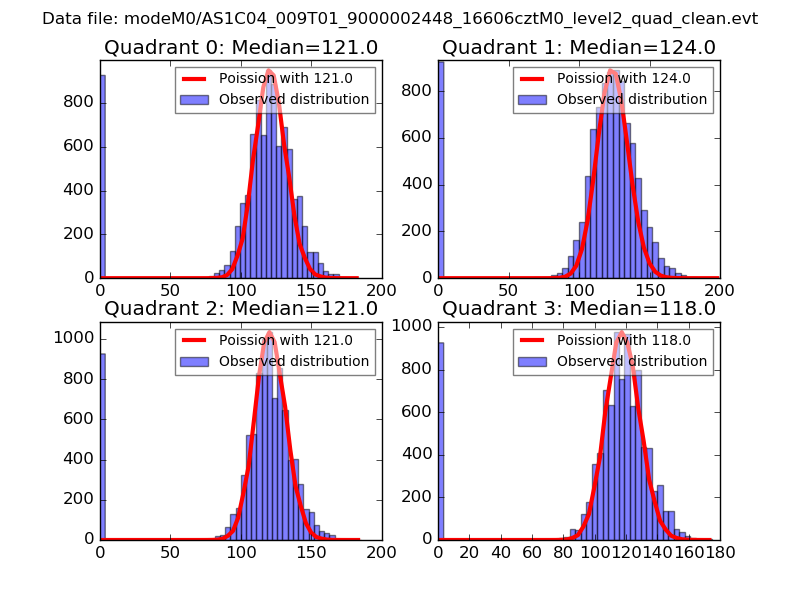
| Comparison with Poisson distribution Blue bars denote a histogram of data divided into 1 sec bins. Red curve is a Poisson curve with rate = median count rate of data. |
 |
 |
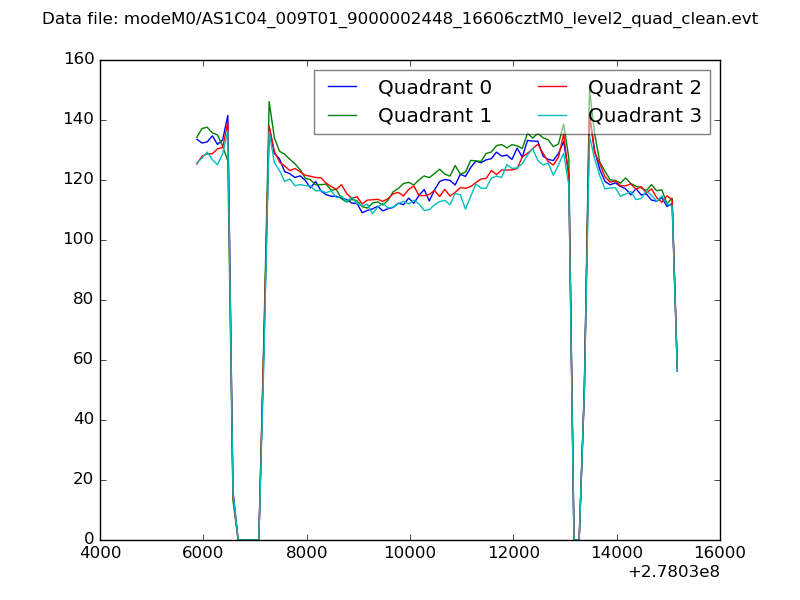
| Quadrant-wise count rates Data is divided into 100 sec bins |
 |
|
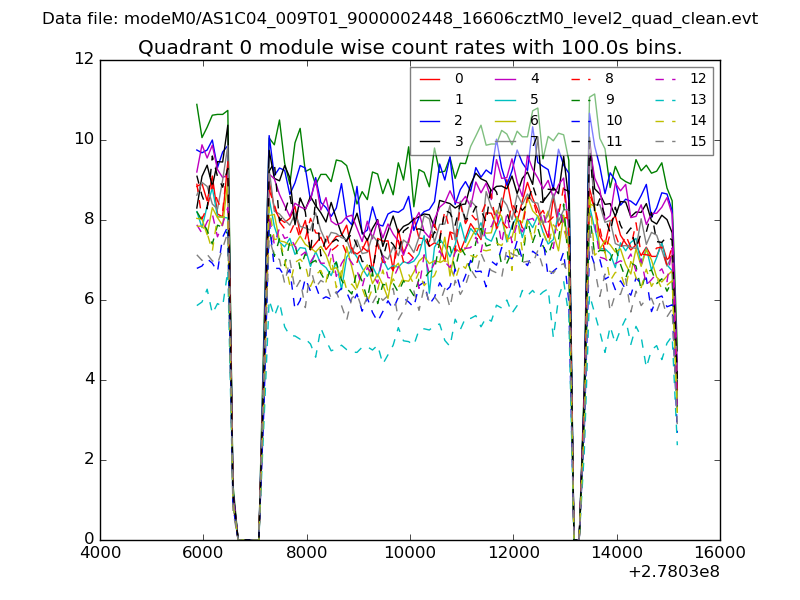
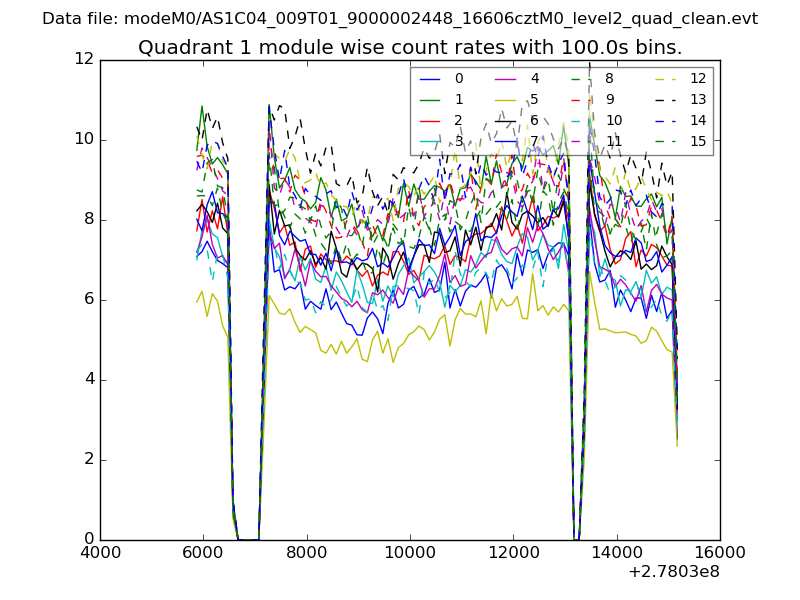
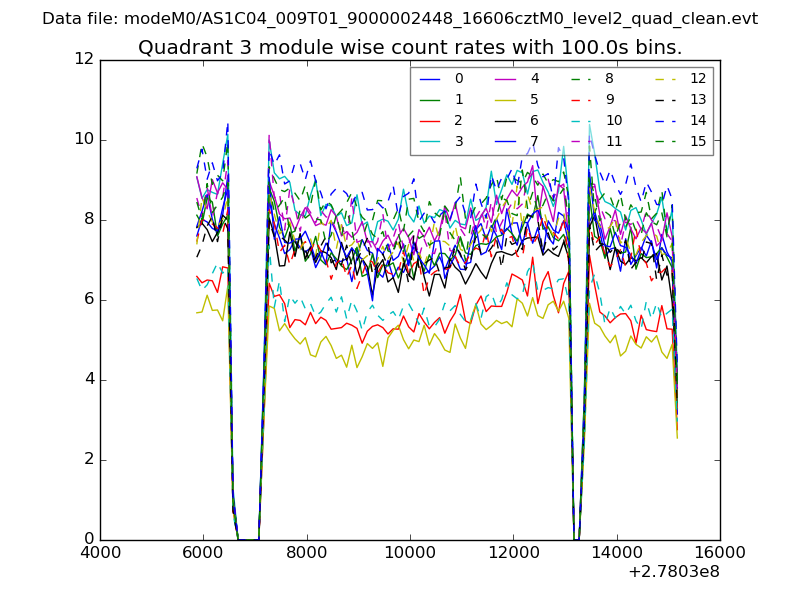
| Module-wise count rates for Quadrant A Data is divided into 100 sec bins |
 |
 |
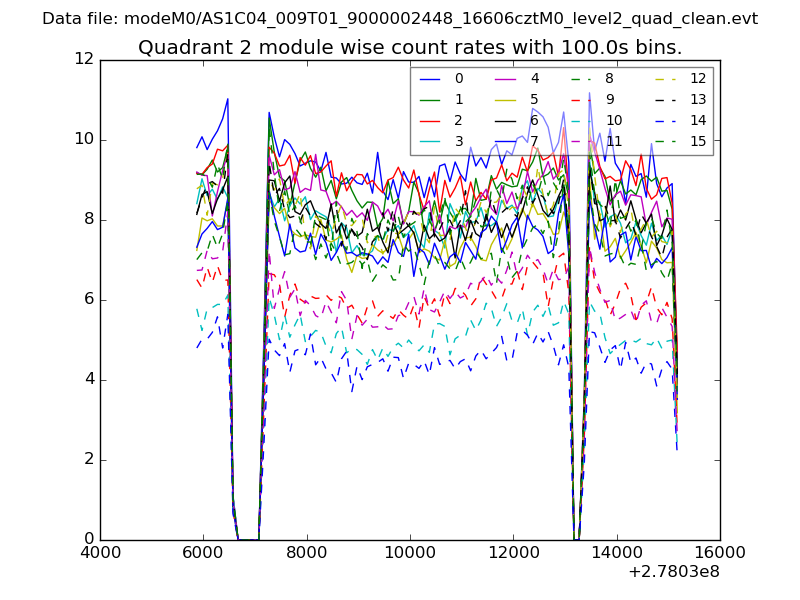
| Module-wise count rates for Quadrant B Data is divided into 100 sec bins |
 |
 |
| Module-wise count rates for Quadrant C Data is divided into 100 sec bins |
 |
 |
| Module-wise count rates for Quadrant D Data is divided into 100 sec bins |
 |
 |
| Parameter | Plot |
|---|---|
| CZT HV Monitor | 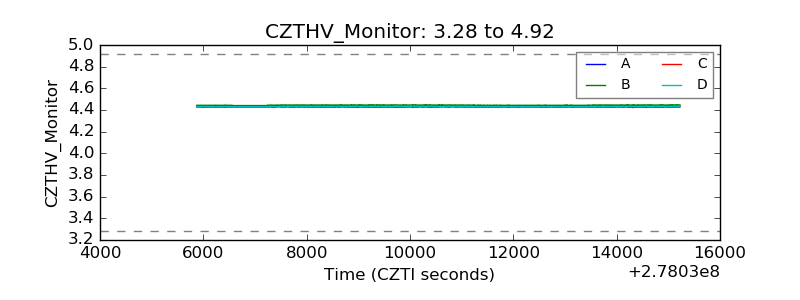 |
| D_VDD | 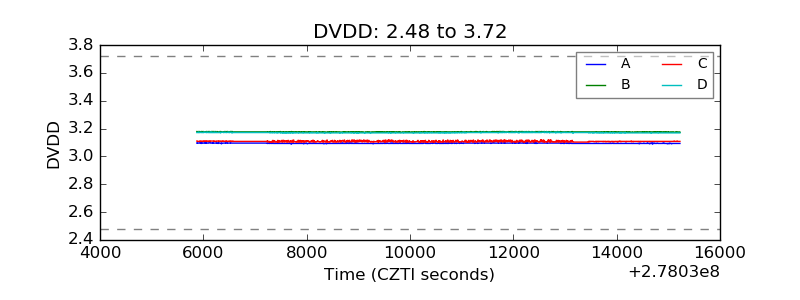 |
| Temperature 1 | 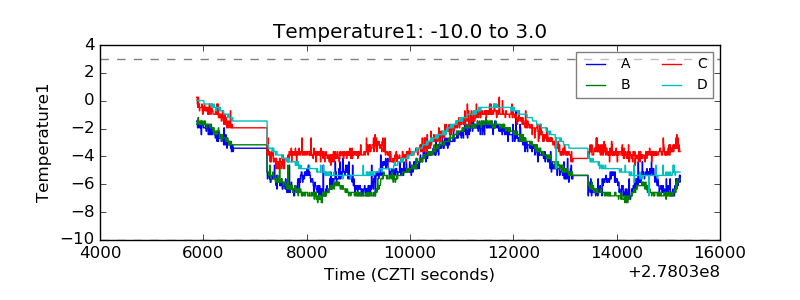 |
| Veto HV Monitor | 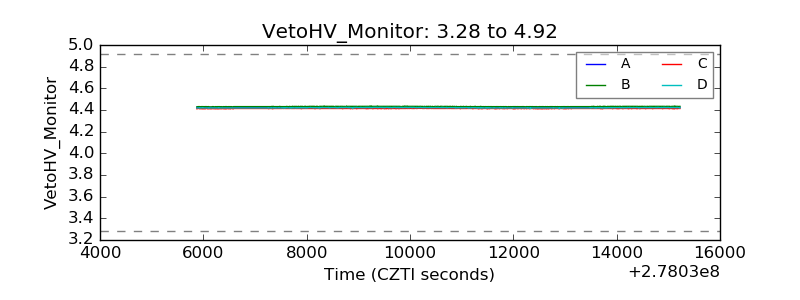 |
| Veto LLD | 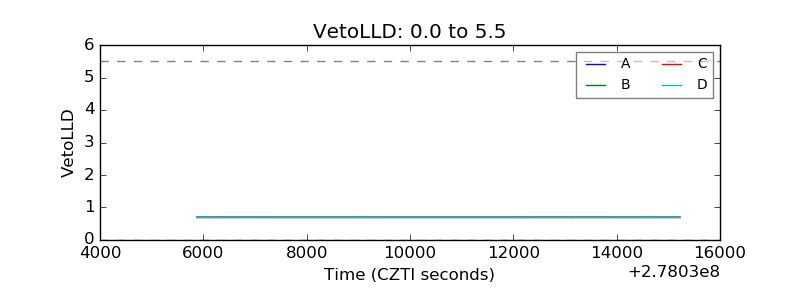 |
| Alpha Counter | 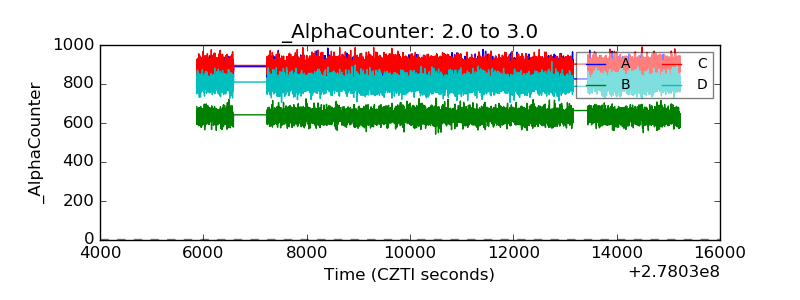 |
| _CPM_Rate | 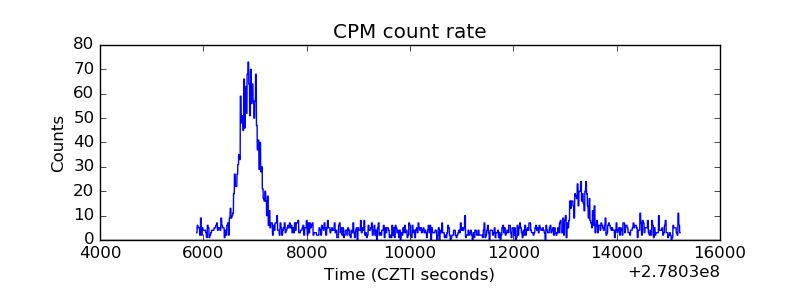 |
| CZT Counter | 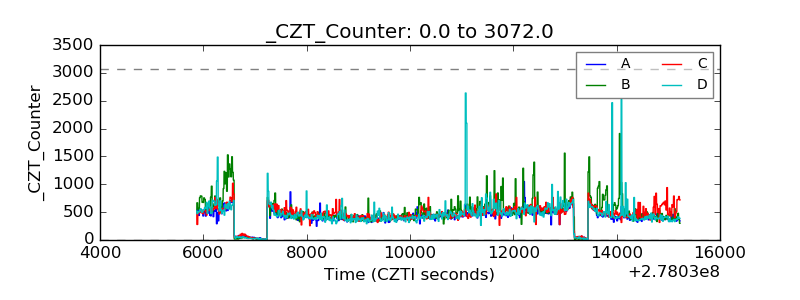 |
| +2.5 Volts monitor |  |
| +5 Volts monitor |  |
| _ROLL_ROT | 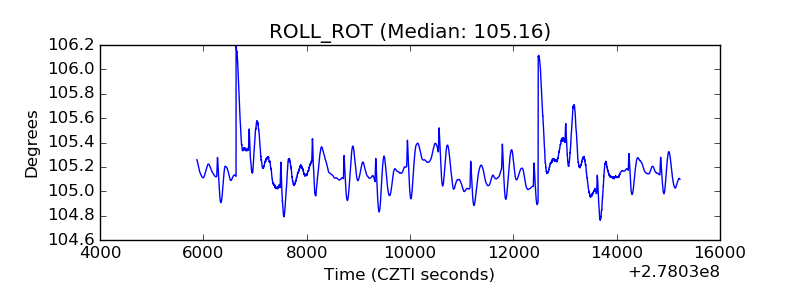 |
| _Roll_DEC | 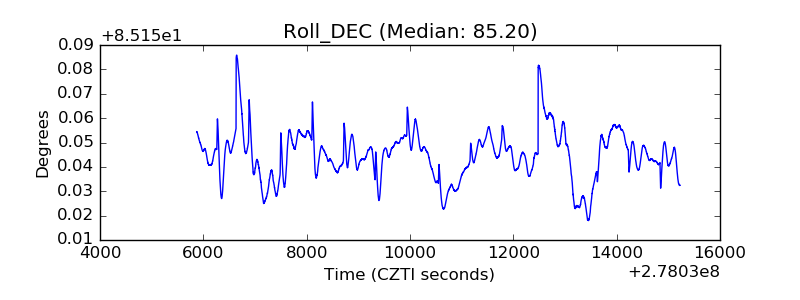 |
| _Roll_RA | 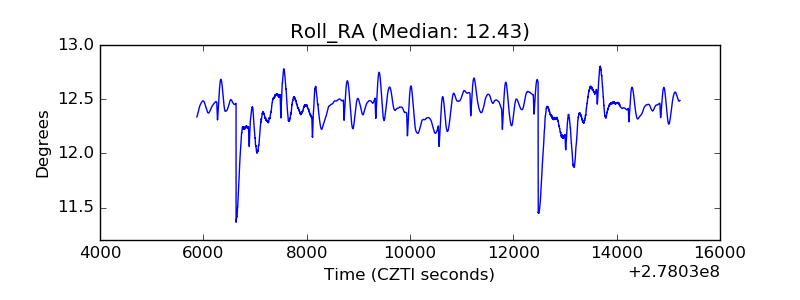 |
| Veto Counter | 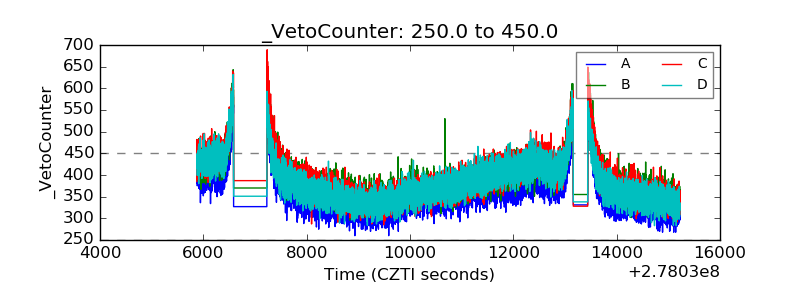 |