| Param | Original file | Final file |
|---|---|---|
| Filename | modeM0/AS1C04_009T01_9000002448_16607cztM0_level2.evt | modeM0/AS1C04_009T01_9000002448_16607cztM0_level2_quad_clean.evt |
| Size (bytes) | 522,829,440 | 128,327,040 |
| Size | 498.6 MB | 122.4 MB |
| Events in quadrant A | 4,010,603 | 833,258 |
| Events in quadrant B | 3,816,700 | 870,970 |
| Events in quadrant C | 4,075,442 | 848,379 |
| Events in quadrant D | 3,443,588 | 833,848 |
| Mode M0 | |||
|---|---|---|---|
| Quadrant | BADHDUFLAG | Total packets | Discarded packets |
| A | 0 | 17029 | 2 |
| B | 0 | 16244 | 1 |
| C | 0 | 17124 | 1 |
| D | 0 | 15661 | 1 |
| Mode SS | |||
|---|---|---|---|
| Quadrant | BADHDUFLAG | Total packets | Discarded packets |
| A | 0 | 146 | 0 |
| B | 0 | 146 | 0 |
| C | 0 | 146 | 0 |
| D | 0 | 146 | 0 |
| Mode M9 | |||
|---|---|---|---|
| Quadrant | BADHDUFLAG | Total packets | Discarded packets |
| A | 0 | 2 | 0 |
| B | 0 | 2 | 0 |
| C | 0 | 2 | 0 |
| D | 0 | 2 | 0 |
| Quadrant | Total seconds | Saturated seconds | Saturation percentage |
|---|---|---|---|
| A | 7183 | 319 | 4.441041% |
| B | 7183 | 60 | 0.835306% |
| C | 7183 | 81 | 1.127663% |
| D | 7183 | 36 | 0.501183% |
Noise dominated data is calculated using 1-second bins in cleaned event files. If a bin has >2000 counts, and if more than 50% of those come from <1% of pixels, then it is considered to be noise-dominated and hence unusable.
| Quadrant | # 1 sec bins | Bins with >0 counts | Bins with >2000 counts | High rate bins dominated by noise | Noise dominated (total time) | Noise dominated (detector-on time) | Marked lightcurve |
|---|---|---|---|---|---|---|---|
| A | 7434 | 7185 | 234 | 234 | 3.15% | 3.26% | 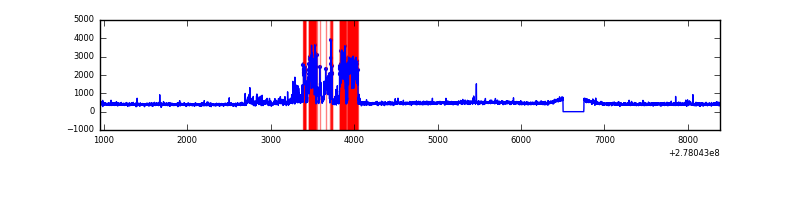 |
| B | 7434 | 7185 | 2 | 2 | 0.03% | 0.03% | 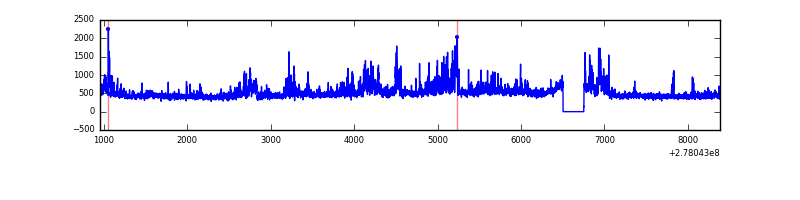 |
| C | 7434 | 7185 | 0 | 0 | 0.00% | 0.00% | 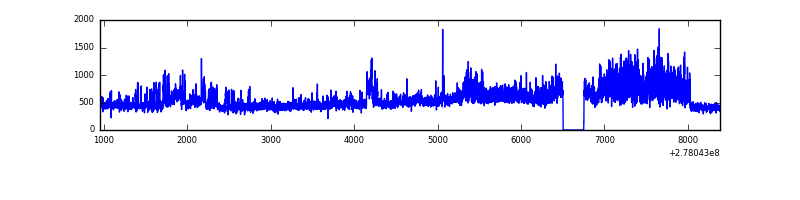 |
| D | 7434 | 7185 | 19 | 19 | 0.26% | 0.26% | 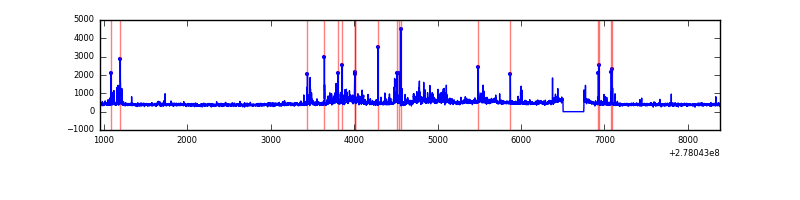 |
Top three noisy pixels from each quadrant. If the there are fewer than three noisy pixels in the level2.evt file, extra rows are filled as -1
| Pixel properties | Quadrant properties | ||||||
|---|---|---|---|---|---|---|---|
| Quadrant | DetID | PixID | Counts | Sigma | Mean | Median | Sigma |
| A | 15 | 174 | 932282 | 5776.16 | 792 | 774 | 161.3 |
| A | 15 | 69 | 18734 | 111.37 | 792 | 774 | 161.3 |
| A | 3 | 1 | 7558 | 42.07 | 792 | 774 | 161.3 |
| B | 0 | 189 | 161669 | 1037.35 | 814 | 792 | 155.1 |
| B | 0 | 85 | 157125 | 1008.05 | 814 | 792 | 155.1 |
| B | 15 | 35 | 133636 | 856.59 | 814 | 792 | 155.1 |
| C | 7 | 247 | 679098 | 3718.8 | 782 | 786 | 182.4 |
| C | 3 | 233 | 225993 | 1234.68 | 782 | 786 | 182.4 |
| C | 14 | 238 | 121151 | 659.89 | 782 | 786 | 182.4 |
| D | 1 | 52 | 297978 | 1573.45 | 784 | 758 | 188.9 |
| D | 10 | 70 | 112874 | 593.53 | 784 | 758 | 188.9 |
| D | 2 | 234 | 32208 | 166.49 | 784 | 758 | 188.9 |
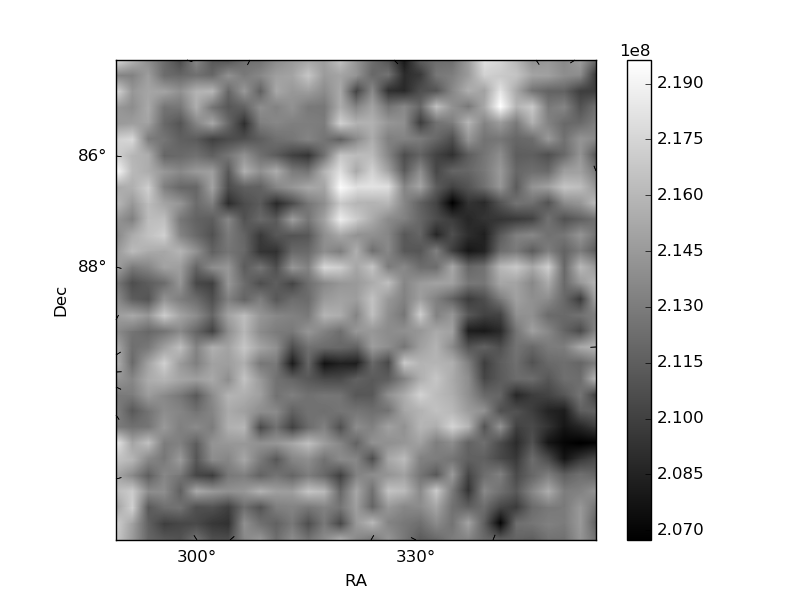
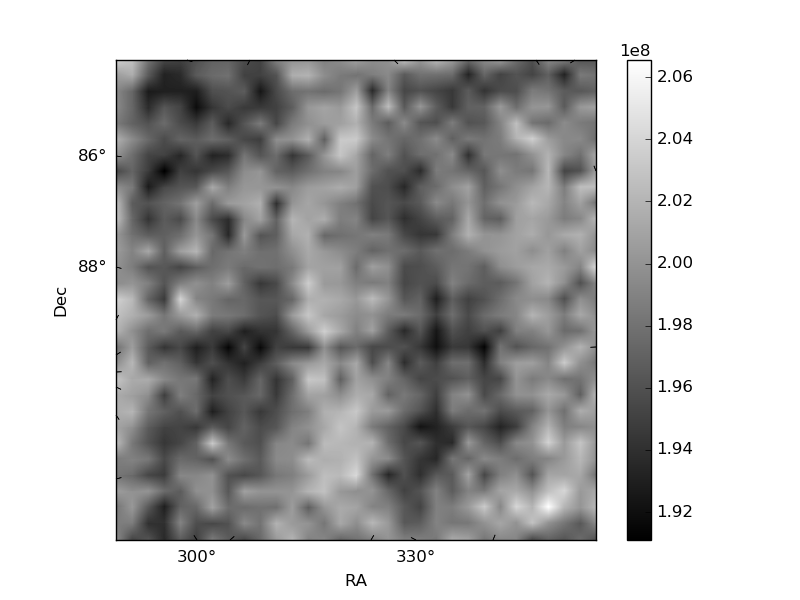
Histogram calculated using DETX and DETY for each event in the final _common_clean file
| Quadrant A | 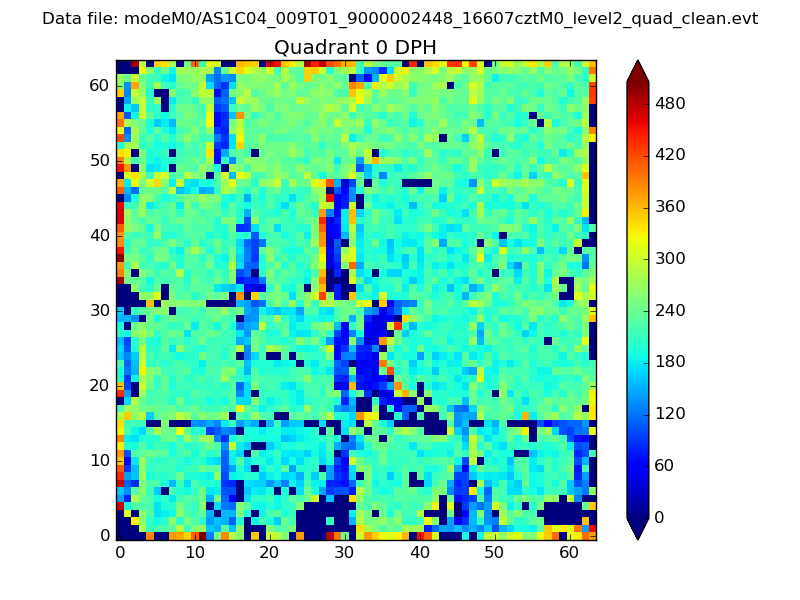 |
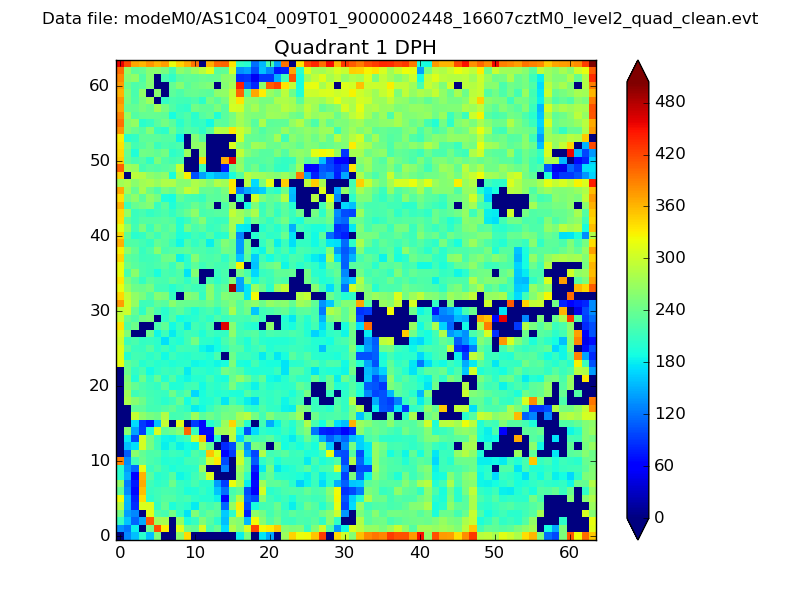 |
Quadrant B |
|---|---|---|---|
| Quadrant D | 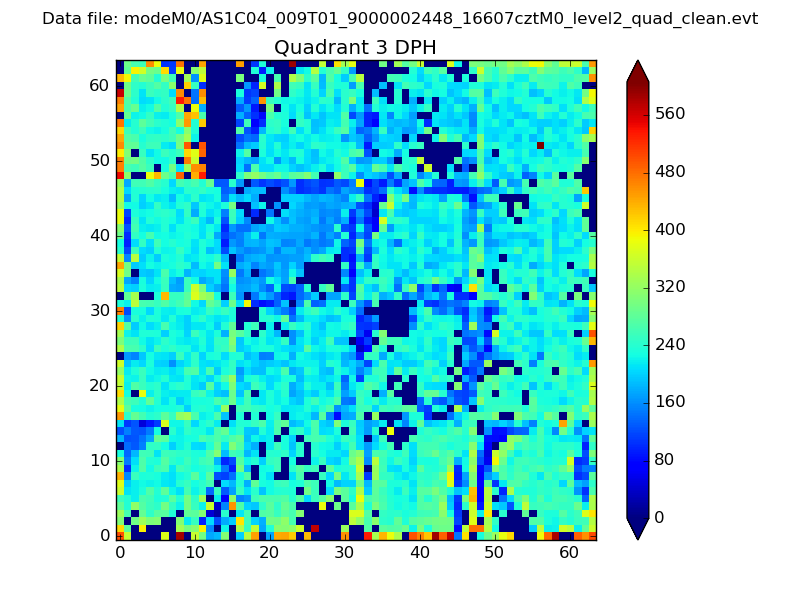 |
 |
Quadrant C |
| Plot type | Count rate plots | Images |
|---|---|---|
| Comparison with Poisson distribution Blue bars denote a histogram of data divided into 1 sec bins. Red curve is a Poisson curve with rate = median count rate of data. |
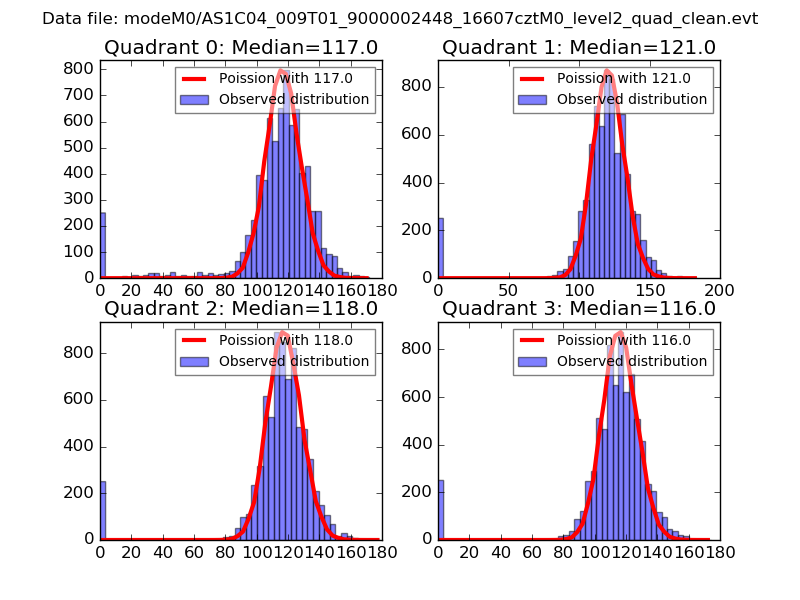 |
 |
| Quadrant-wise count rates Data is divided into 100 sec bins |
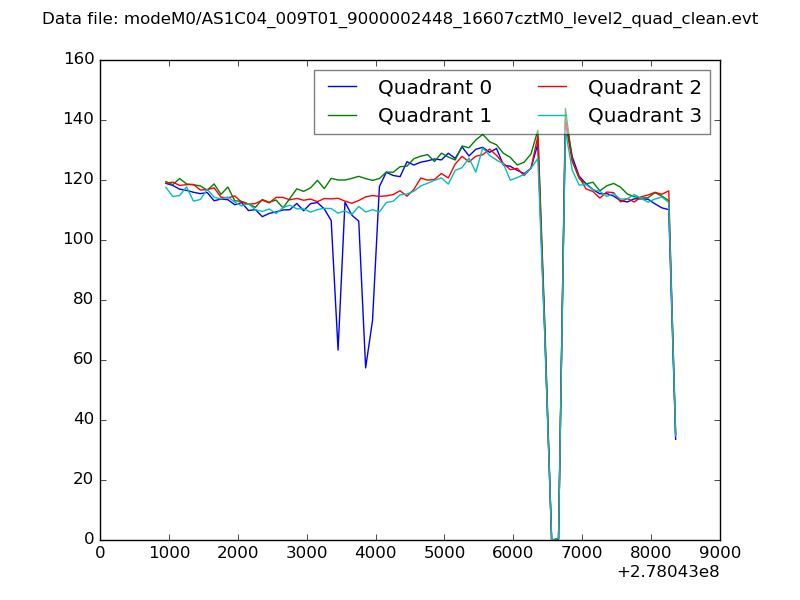 |
|
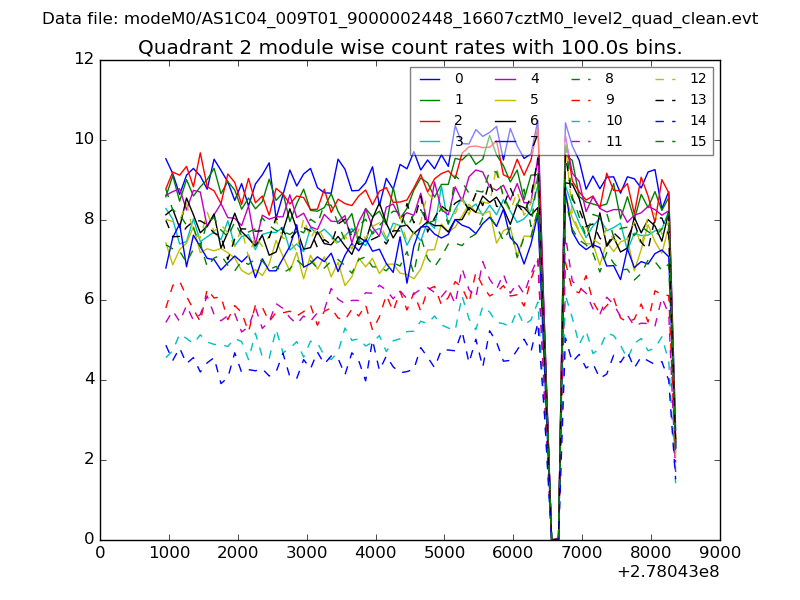
| Module-wise count rates for Quadrant A Data is divided into 100 sec bins |
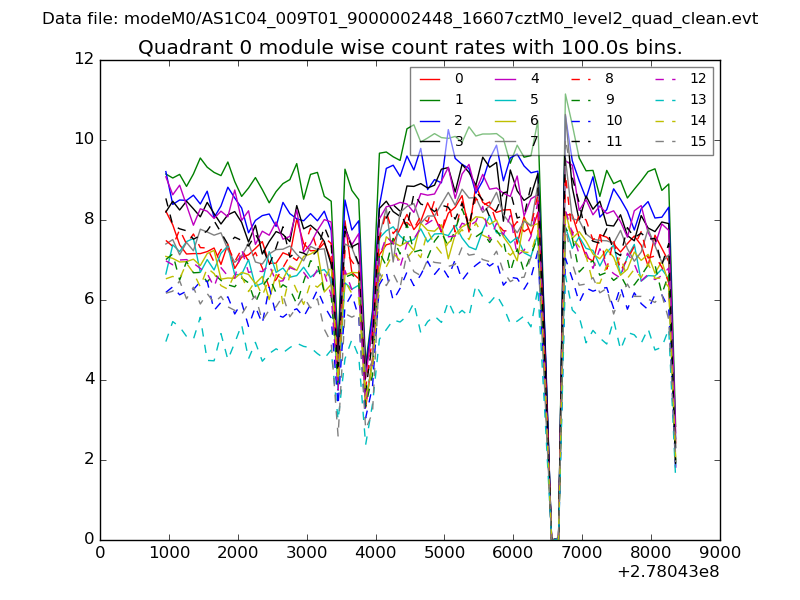 |
 |
| Module-wise count rates for Quadrant B Data is divided into 100 sec bins |
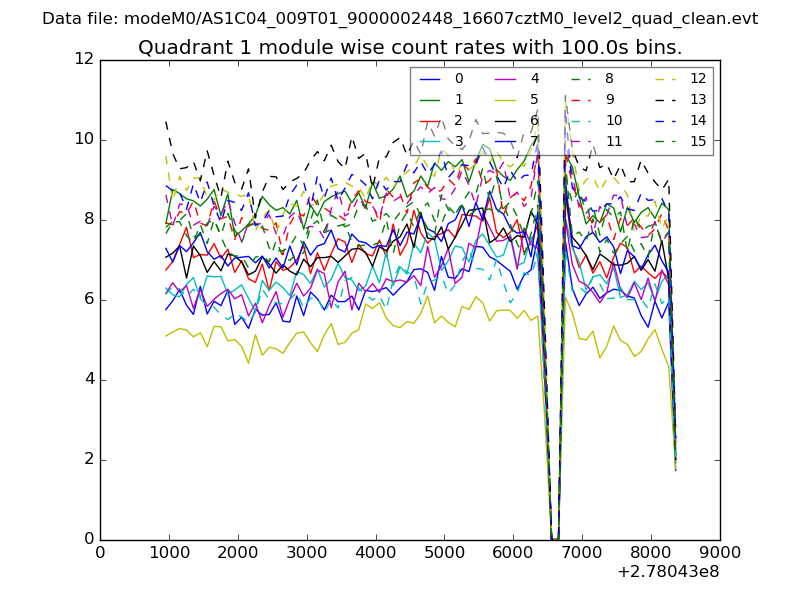 |
 |
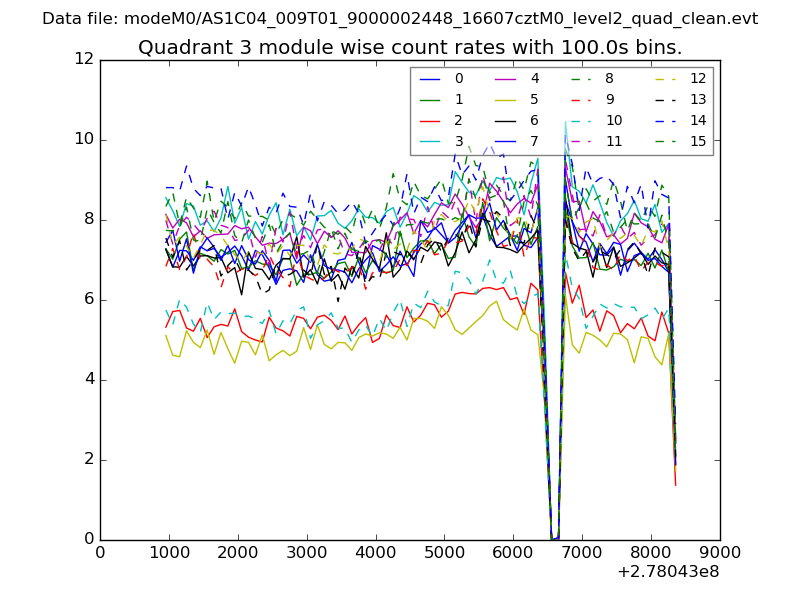
| Module-wise count rates for Quadrant C Data is divided into 100 sec bins |
 |
 |
| Module-wise count rates for Quadrant D Data is divided into 100 sec bins |
 |
 |
| Parameter | Plot |
|---|---|
| CZT HV Monitor | 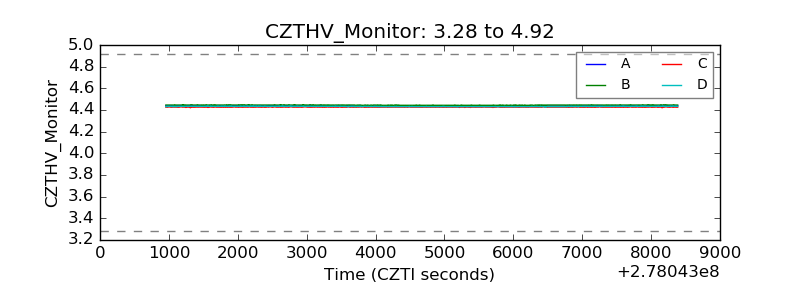 |
| D_VDD | 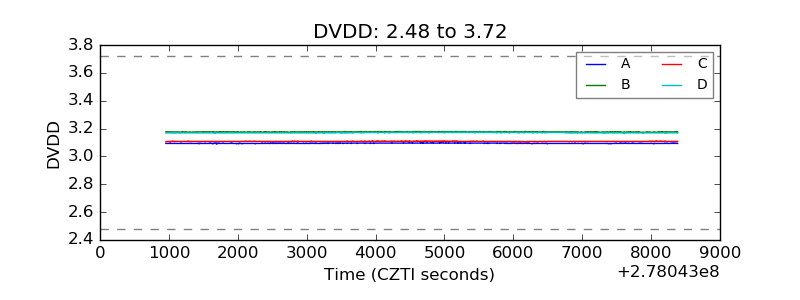 |
| Temperature 1 | 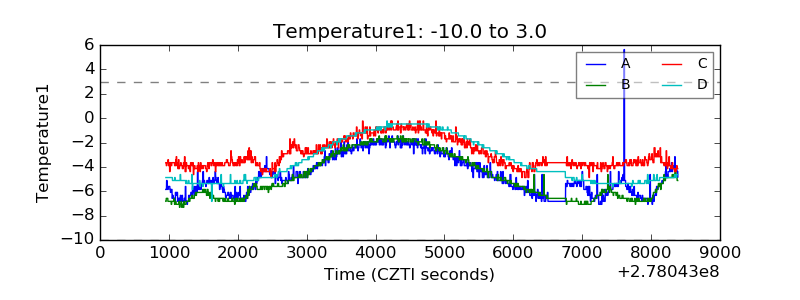 |
| Veto HV Monitor | 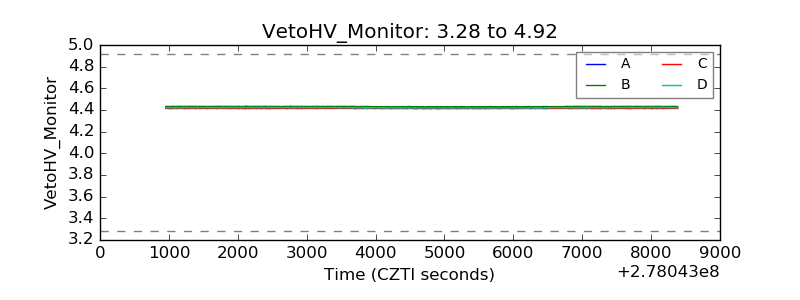 |
| Veto LLD | 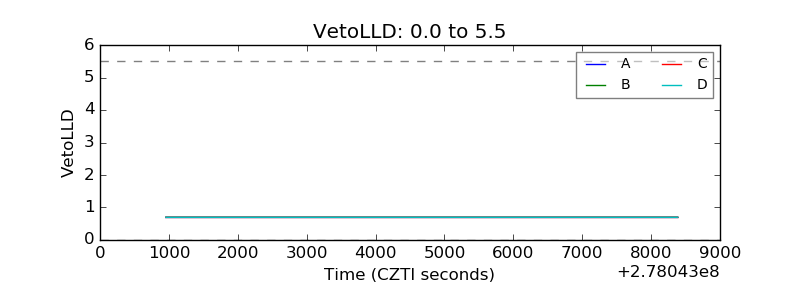 |
| Alpha Counter | 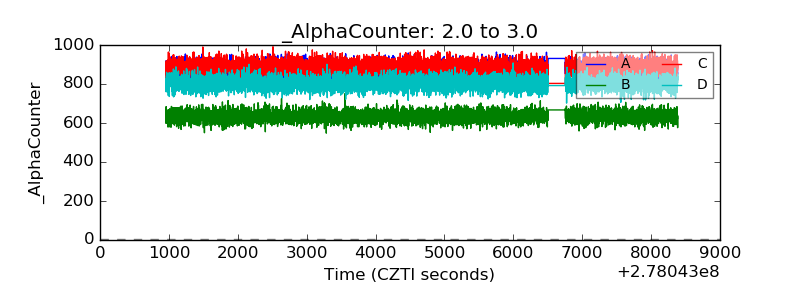 |
| _CPM_Rate | 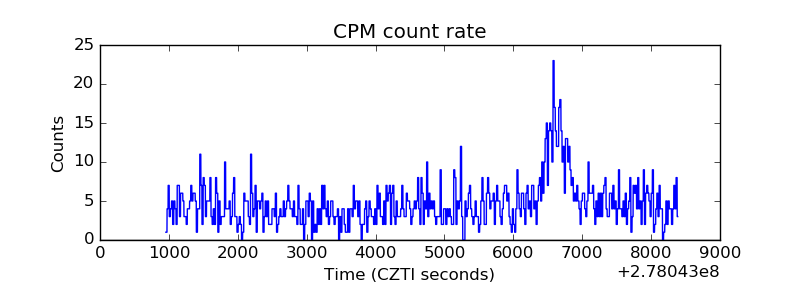 |
| CZT Counter | 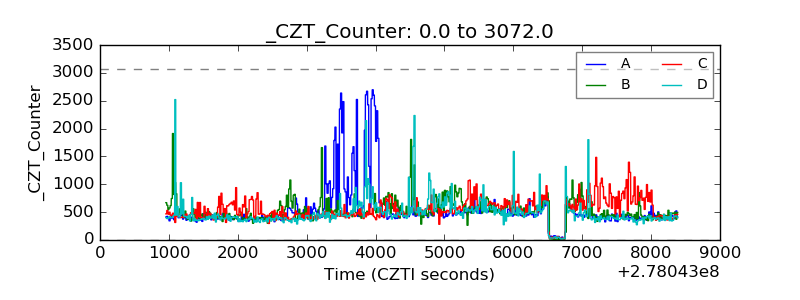 |
| +2.5 Volts monitor |  |
| +5 Volts monitor |  |
| _ROLL_ROT | 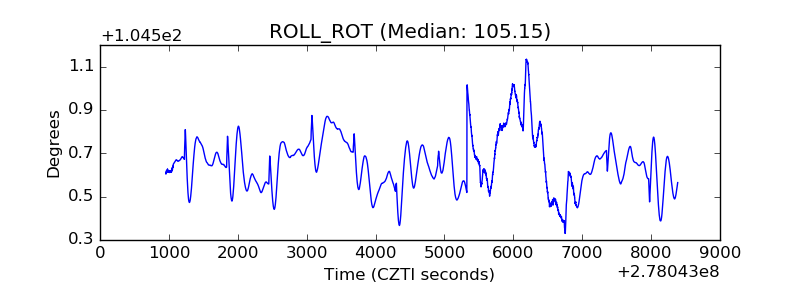 |
| _Roll_DEC | 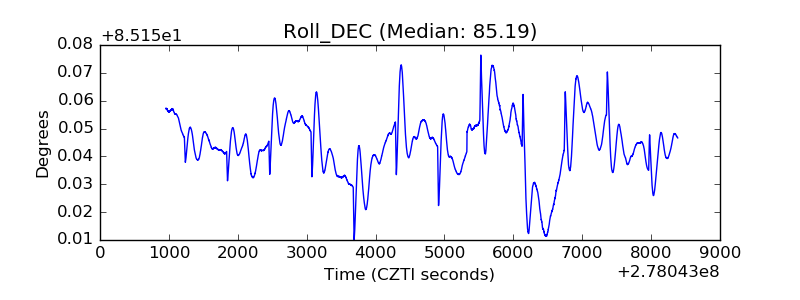 |
| _Roll_RA | 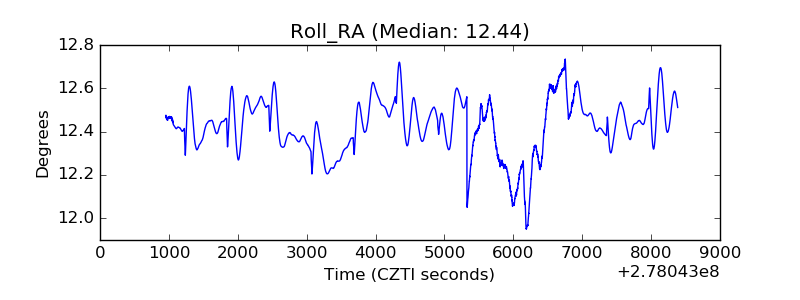 |
| Veto Counter | 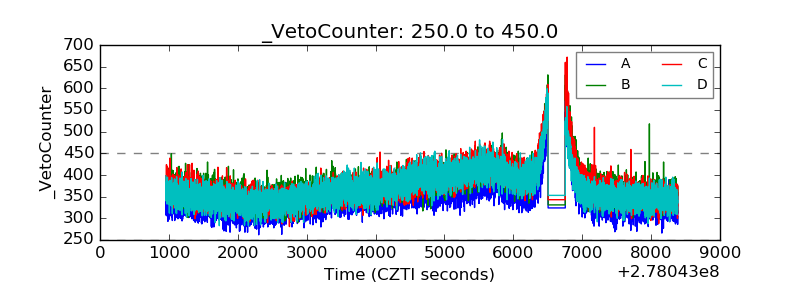 |