| Param | Original file | Final file |
|---|---|---|
| Filename | modeM0/AS1C04_009T01_9000002448_16610cztM0_level2.evt | modeM0/AS1C04_009T01_9000002448_16610cztM0_level2_quad_clean.evt |
| Size (bytes) | 870,387,840 | 223,136,640 |
| Size | 830.1 MB | 212.8 MB |
| Events in quadrant A | 5,754,299 | 1,485,881 |
| Events in quadrant B | 6,561,960 | 1,519,940 |
| Events in quadrant C | 6,290,688 | 1,466,813 |
| Events in quadrant D | 6,908,364 | 1,423,932 |
| Mode M0 | |||
|---|---|---|---|
| Quadrant | BADHDUFLAG | Total packets | Discarded packets |
| A | 0 | 25728 | 3 |
| B | 0 | 27439 | 2 |
| C | 0 | 26756 | 2 |
| D | 0 | 29502 | 2 |
| Mode SS | |||
|---|---|---|---|
| Quadrant | BADHDUFLAG | Total packets | Discarded packets |
| A | 0 | 254 | 0 |
| B | 0 | 254 | 0 |
| C | 0 | 254 | 0 |
| D | 0 | 254 | 0 |
| Mode M9 | |||
|---|---|---|---|
| Quadrant | BADHDUFLAG | Total packets | Discarded packets |
| A | 0 | 14 | 0 |
| B | 0 | 14 | 0 |
| C | 0 | 14 | 0 |
| D | 0 | 14 | 0 |
| Quadrant | Total seconds | Saturated seconds | Saturation percentage |
|---|---|---|---|
| A | 12471 | 113 | 0.906102% |
| B | 12471 | 87 | 0.697618% |
| C | 12471 | 109 | 0.874028% |
| D | 12471 | 379 | 3.039051% |
Noise dominated data is calculated using 1-second bins in cleaned event files. If a bin has >2000 counts, and if more than 50% of those come from <1% of pixels, then it is considered to be noise-dominated and hence unusable.
| Quadrant | # 1 sec bins | Bins with >0 counts | Bins with >2000 counts | High rate bins dominated by noise | Noise dominated (total time) | Noise dominated (detector-on time) | Marked lightcurve |
|---|---|---|---|---|---|---|---|
| A | 13857 | 12475 | 45 | 45 | 0.32% | 0.36% | 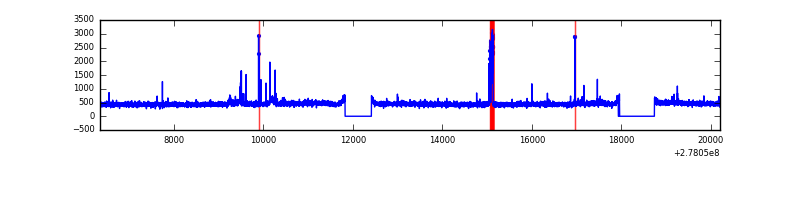 |
| B | 13857 | 12475 | 8 | 8 | 0.06% | 0.06% | 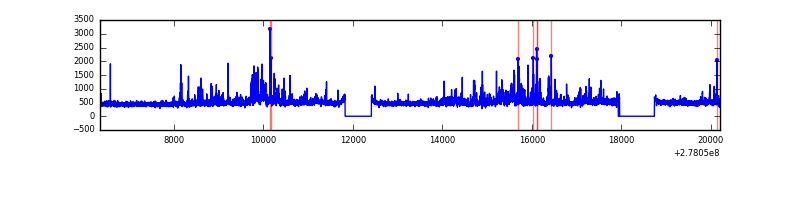 |
| C | 13857 | 12475 | 0 | 0 | 0.00% | 0.00% | 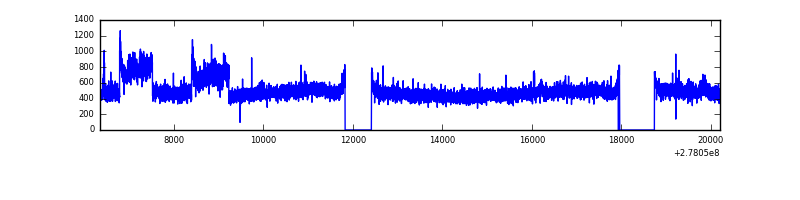 |
| D | 13857 | 12475 | 330 | 330 | 2.38% | 2.65% | 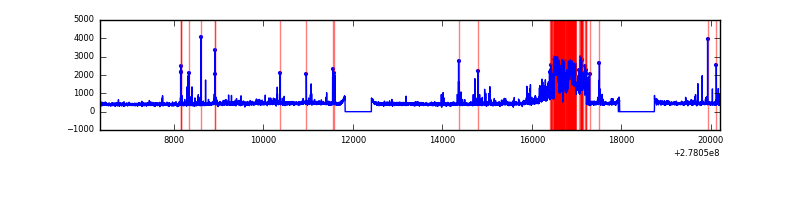 |
Top three noisy pixels from each quadrant. If the there are fewer than three noisy pixels in the level2.evt file, extra rows are filled as -1
| Pixel properties | Quadrant properties | ||||||
|---|---|---|---|---|---|---|---|
| Quadrant | DetID | PixID | Counts | Sigma | Mean | Median | Sigma |
| A | 15 | 174 | 221469 | 766.8 | 1426 | 1397 | 287.0 |
| A | 9 | 143 | 22514 | 73.58 | 1426 | 1397 | 287.0 |
| A | 0 | 226 | 12539 | 38.82 | 1426 | 1397 | 287.0 |
| B | 15 | 35 | 253071 | 927.75 | 1434 | 1395 | 271.3 |
| B | 0 | 189 | 186452 | 682.18 | 1434 | 1395 | 271.3 |
| B | 3 | 209 | 102835 | 373.94 | 1434 | 1395 | 271.3 |
| C | 3 | 233 | 644083 | 2007.51 | 1373 | 1380 | 320.1 |
| C | 14 | 238 | 216771 | 672.78 | 1373 | 1380 | 320.1 |
| C | 7 | 247 | 55586 | 169.32 | 1373 | 1380 | 320.1 |
| D | 2 | 16 | 1132304 | 3387.63 | 1380 | 1338 | 333.9 |
| D | 10 | 70 | 158309 | 470.18 | 1380 | 1338 | 333.9 |
| D | 10 | 199 | 148132 | 439.7 | 1380 | 1338 | 333.9 |
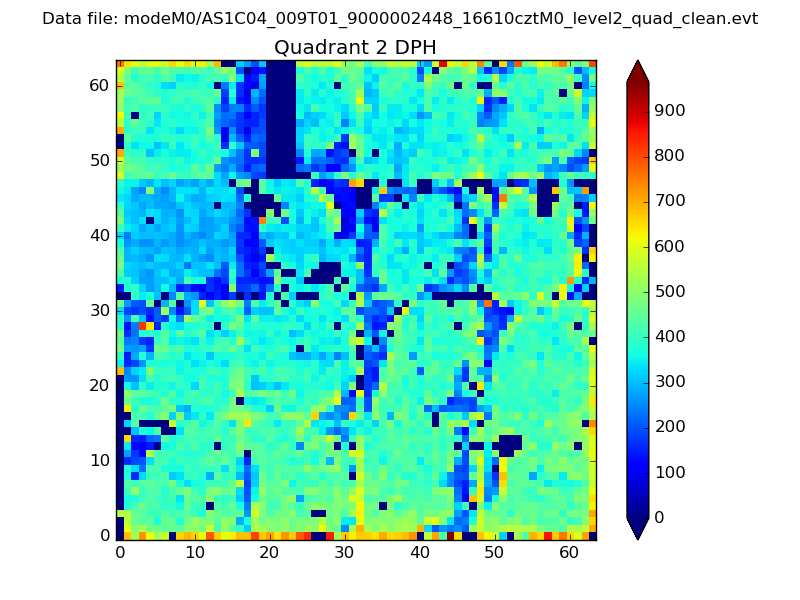
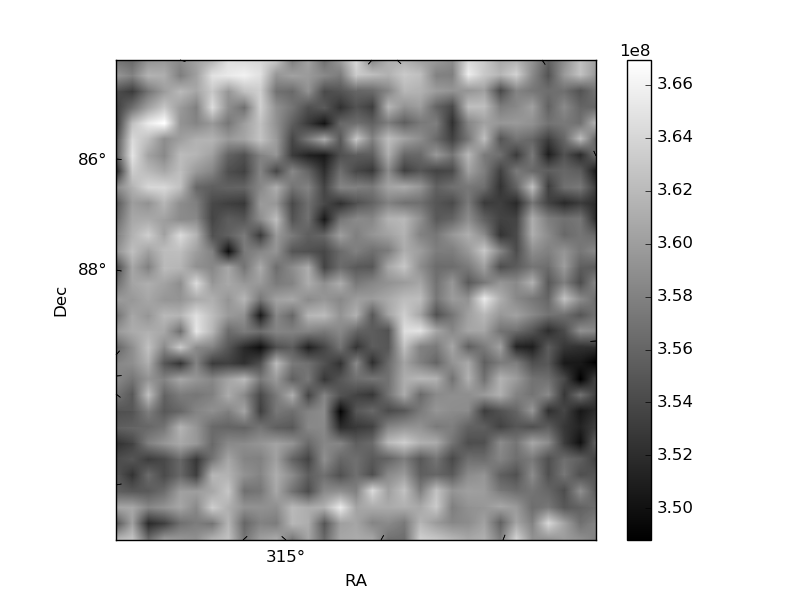
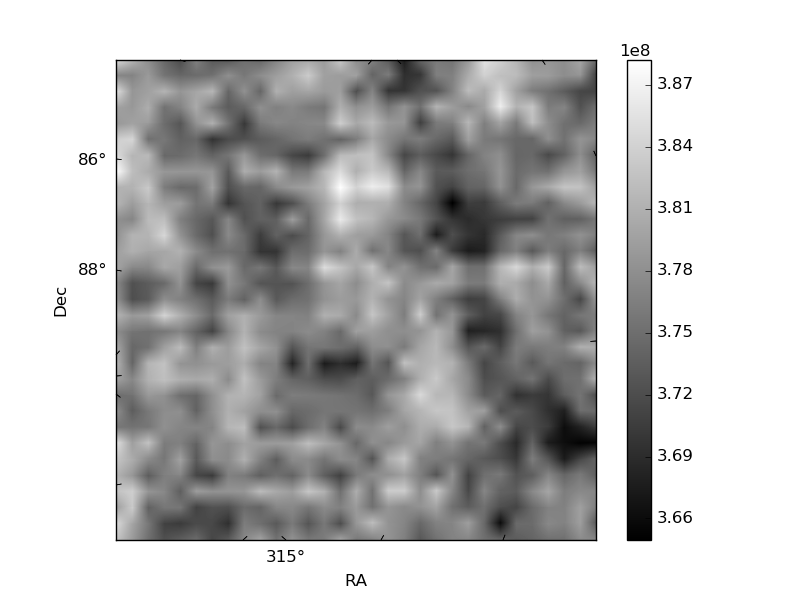
Histogram calculated using DETX and DETY for each event in the final _common_clean file
| Quadrant A | 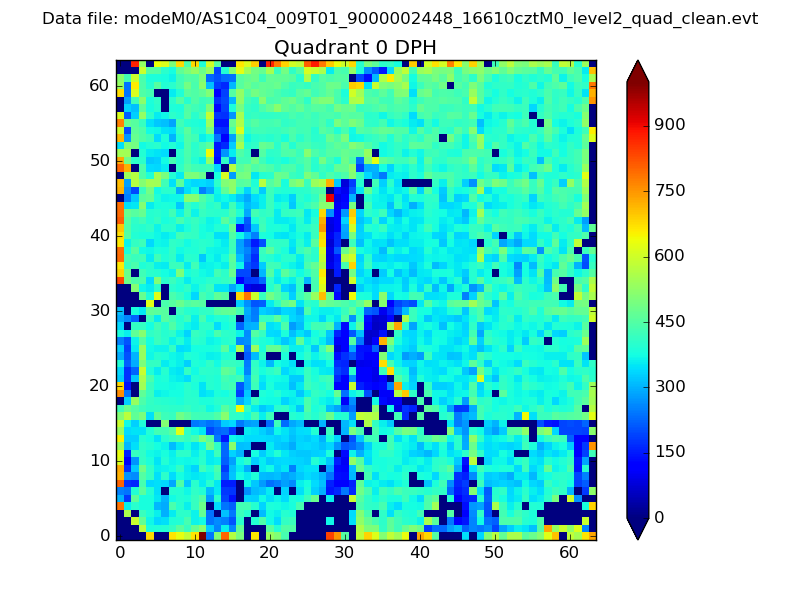 |
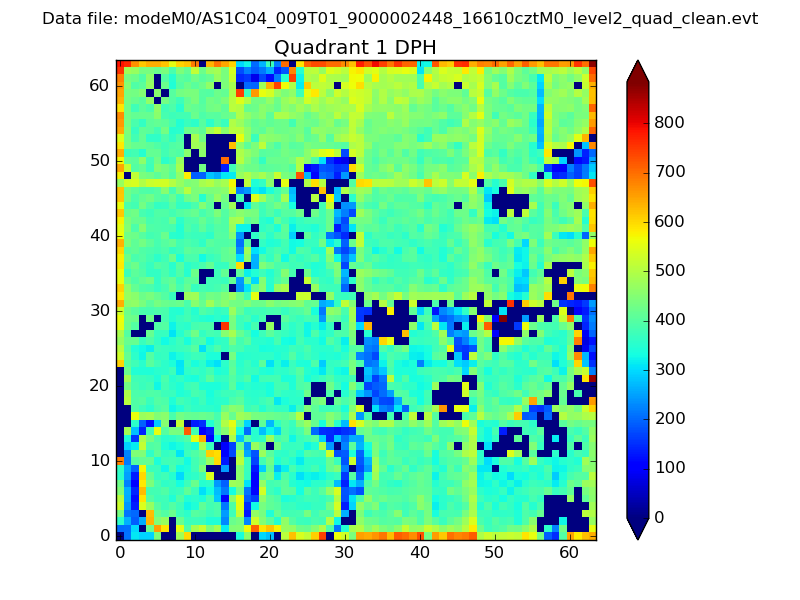 |
Quadrant B |
|---|---|---|---|
| Quadrant D | 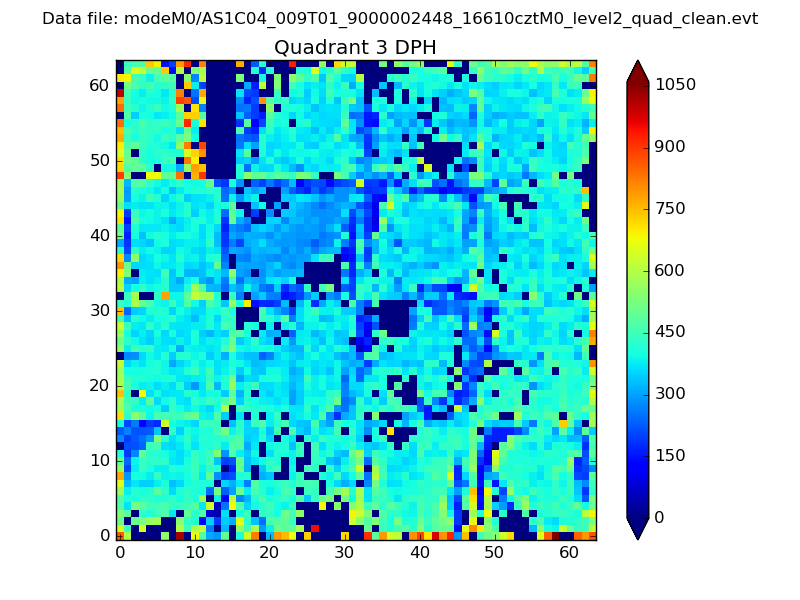 |
 |
Quadrant C |
| Plot type | Count rate plots | Images |
|---|---|---|
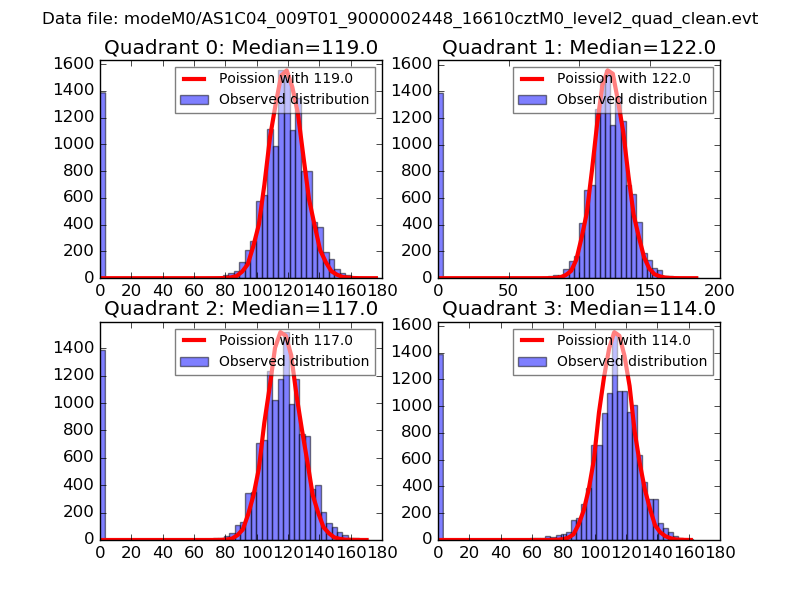
| Comparison with Poisson distribution Blue bars denote a histogram of data divided into 1 sec bins. Red curve is a Poisson curve with rate = median count rate of data. |
 |
 |
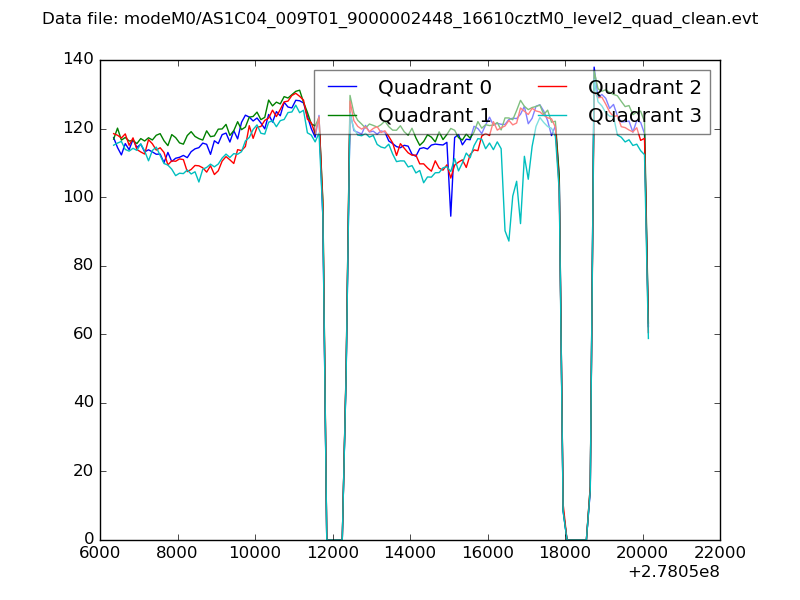
| Quadrant-wise count rates Data is divided into 100 sec bins |
 |
|
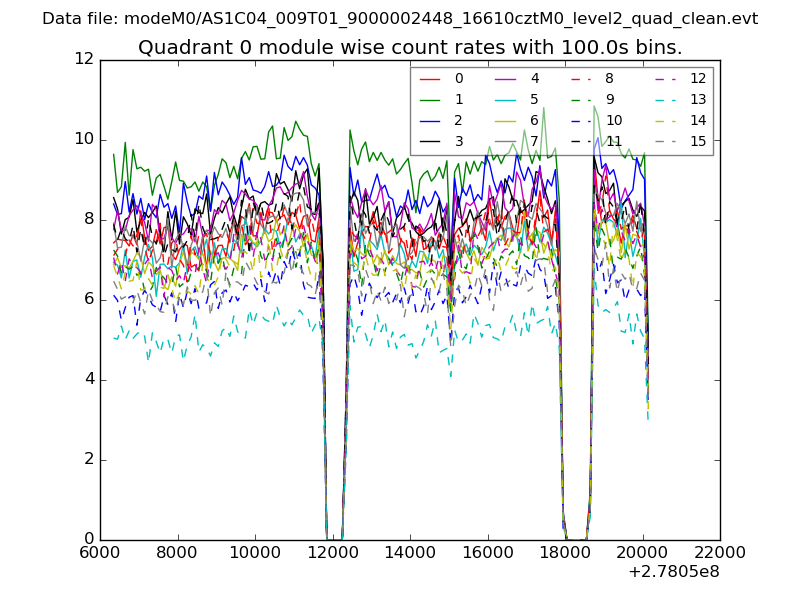
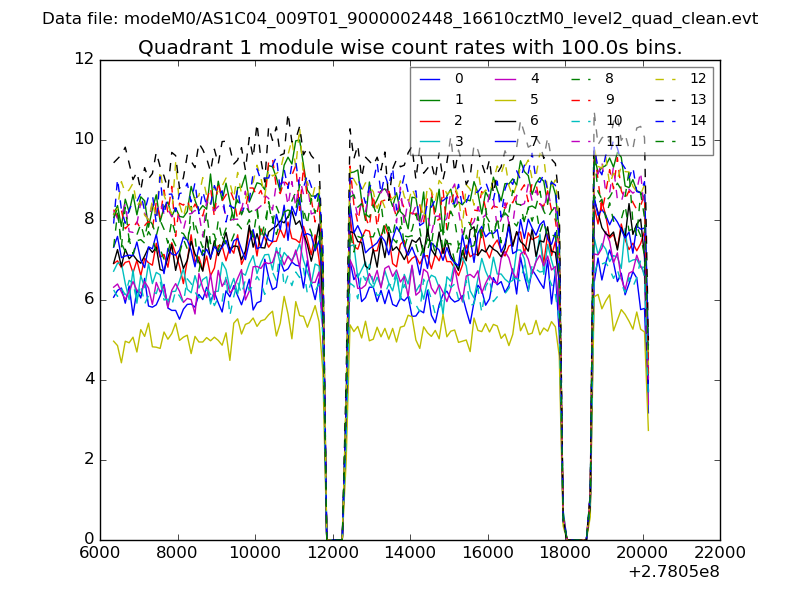
| Module-wise count rates for Quadrant A Data is divided into 100 sec bins |
 |
 |
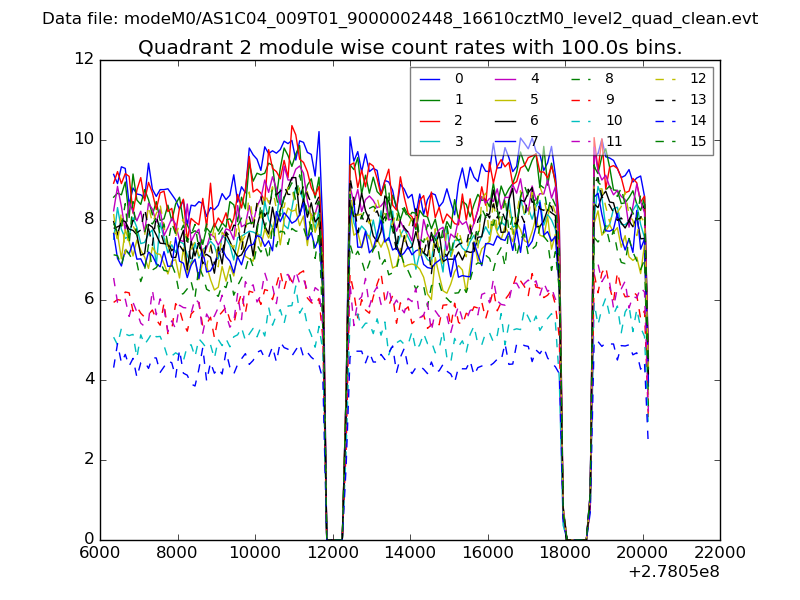
| Module-wise count rates for Quadrant B Data is divided into 100 sec bins |
 |
 |
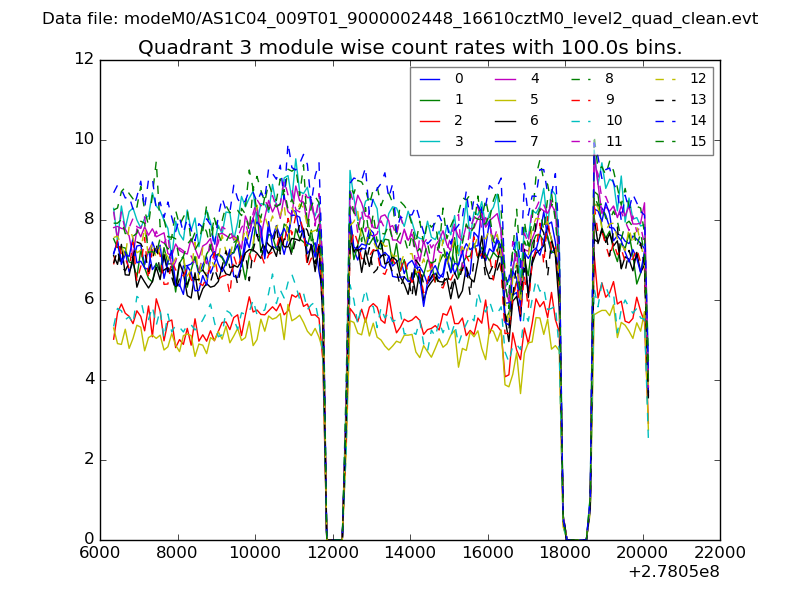
| Module-wise count rates for Quadrant C Data is divided into 100 sec bins |
 |
 |
| Module-wise count rates for Quadrant D Data is divided into 100 sec bins |
 |
 |
| Parameter | Plot |
|---|---|
| CZT HV Monitor | 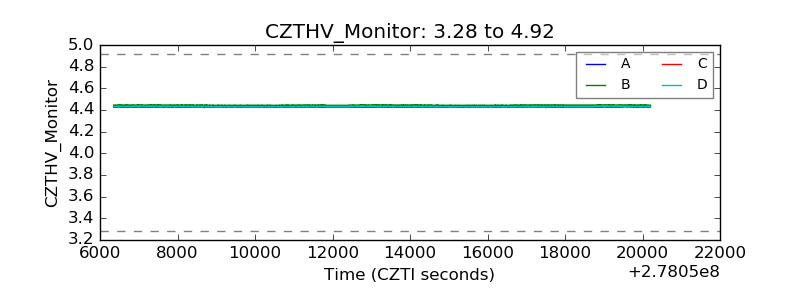 |
| D_VDD | 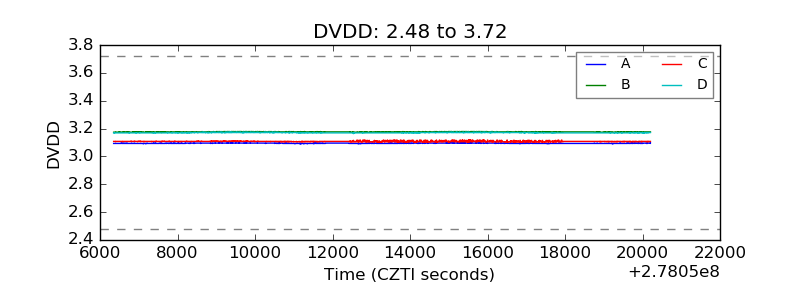 |
| Temperature 1 | 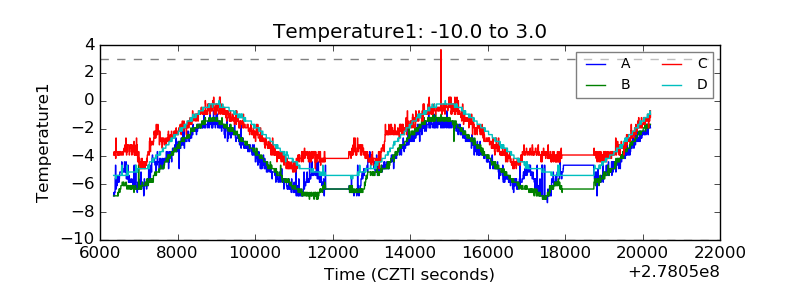 |
| Veto HV Monitor |  |
| Veto LLD | 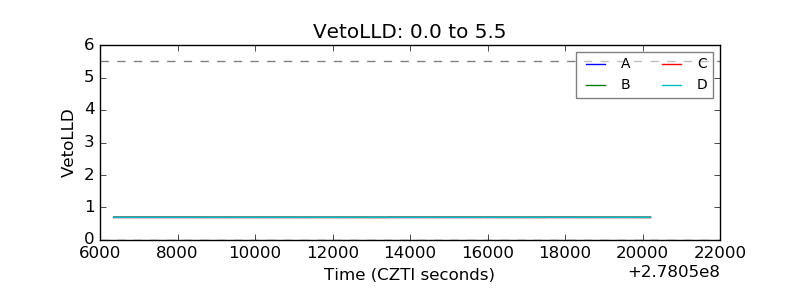 |
| Alpha Counter | 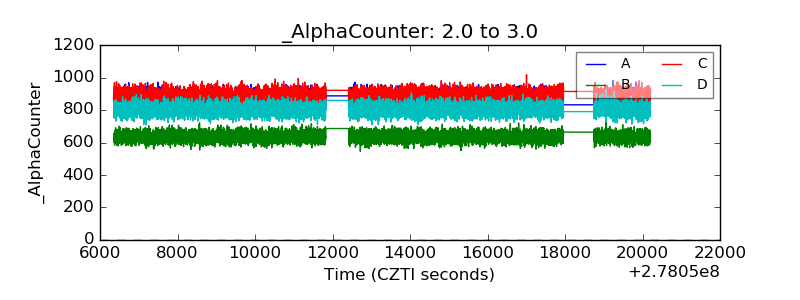 |
| _CPM_Rate | 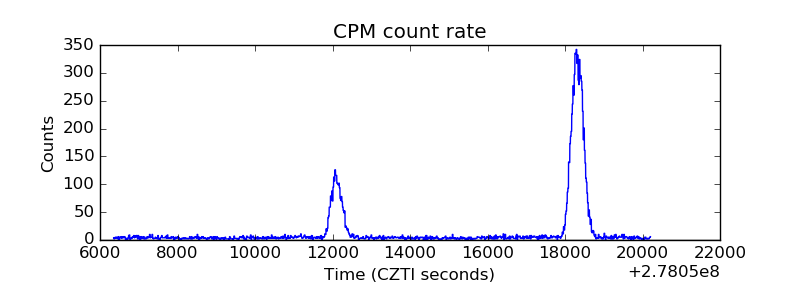 |
| CZT Counter |  |
| +2.5 Volts monitor |  |
| +5 Volts monitor |  |
| _ROLL_ROT | 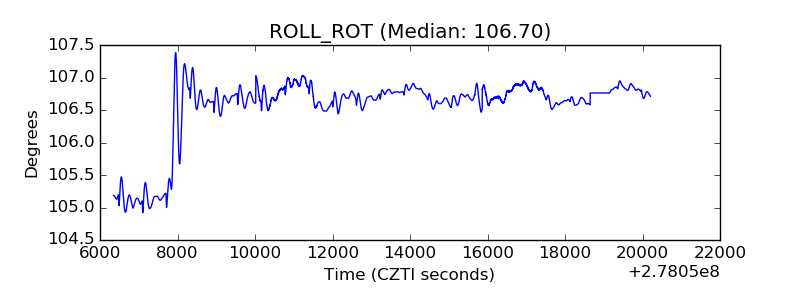 |
| _Roll_DEC | 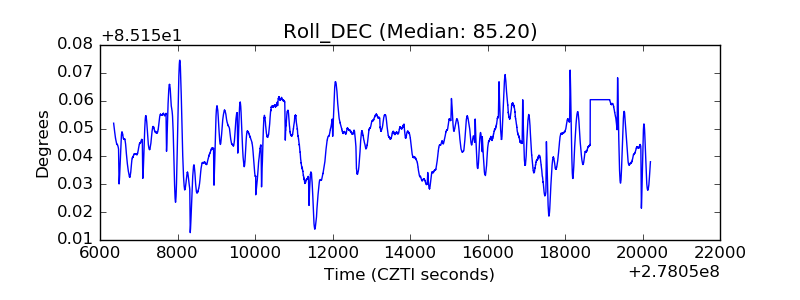 |
| _Roll_RA | 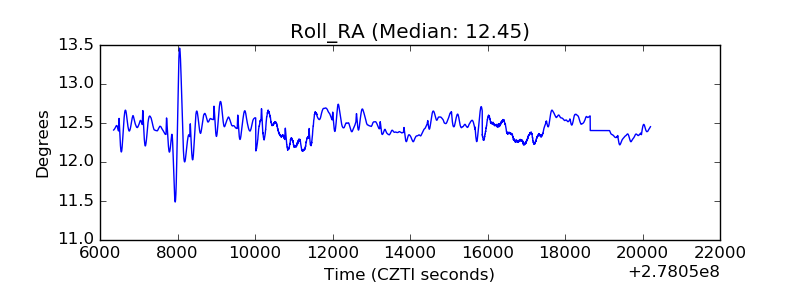 |
| Veto Counter | 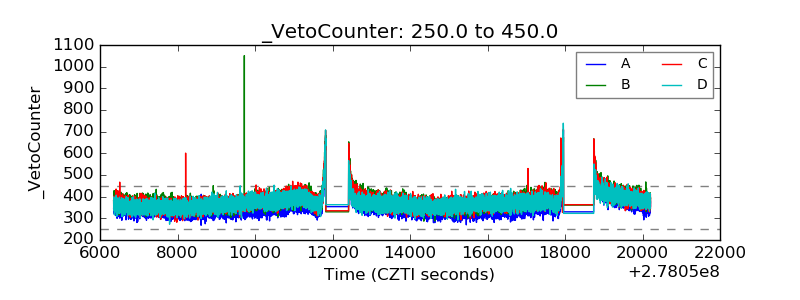 |