| Param | Original file | Final file |
|---|---|---|
| Filename | modeM0/AS1C04_009T01_9000002448_16611cztM0_level2.evt | modeM0/AS1C04_009T01_9000002448_16611cztM0_level2_quad_clean.evt |
| Size (bytes) | 432,267,840 | 113,639,040 |
| Size | 412.2 MB | 108.4 MB |
| Events in quadrant A | 2,821,560 | 763,113 |
| Events in quadrant B | 3,322,974 | 775,423 |
| Events in quadrant C | 3,052,245 | 745,332 |
| Events in quadrant D | 3,474,438 | 726,463 |
| Mode M0 | |||
|---|---|---|---|
| Quadrant | BADHDUFLAG | Total packets | Discarded packets |
| A | 0 | 12542 | 2 |
| B | 0 | 13677 | 1 |
| C | 0 | 12907 | 1 |
| D | 0 | 14540 | 1 |
| Mode SS | |||
|---|---|---|---|
| Quadrant | BADHDUFLAG | Total packets | Discarded packets |
| A | 0 | 126 | 0 |
| B | 0 | 126 | 0 |
| C | 0 | 126 | 0 |
| D | 0 | 126 | 0 |
| Mode M9 | |||
|---|---|---|---|
| Quadrant | BADHDUFLAG | Total packets | Discarded packets |
| A | 0 | 9 | 0 |
| B | 0 | 9 | 0 |
| C | 0 | 9 | 0 |
| D | 0 | 9 | 0 |
| Quadrant | Total seconds | Saturated seconds | Saturation percentage |
|---|---|---|---|
| A | 6179 | 47 | 0.760641% |
| B | 6179 | 73 | 1.181421% |
| C | 6179 | 62 | 1.003399% |
| D | 6179 | 92 | 1.488914% |
Noise dominated data is calculated using 1-second bins in cleaned event files. If a bin has >2000 counts, and if more than 50% of those come from <1% of pixels, then it is considered to be noise-dominated and hence unusable.
| Quadrant | # 1 sec bins | Bins with >0 counts | Bins with >2000 counts | High rate bins dominated by noise | Noise dominated (total time) | Noise dominated (detector-on time) | Marked lightcurve |
|---|---|---|---|---|---|---|---|
| A | 7115 | 6181 | 1 | 1 | 0.01% | 0.02% | 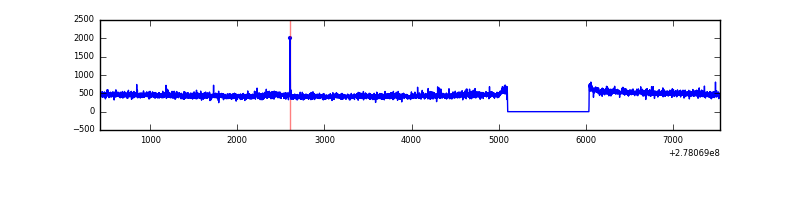 |
| B | 7115 | 6181 | 18 | 18 | 0.25% | 0.29% |  |
| C | 7115 | 6181 | 0 | 0 | 0.00% | 0.00% | 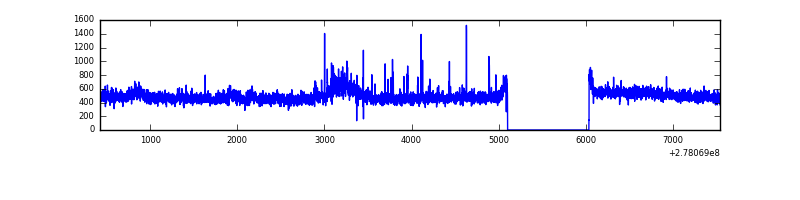 |
| D | 7115 | 6181 | 48 | 48 | 0.67% | 0.78% | 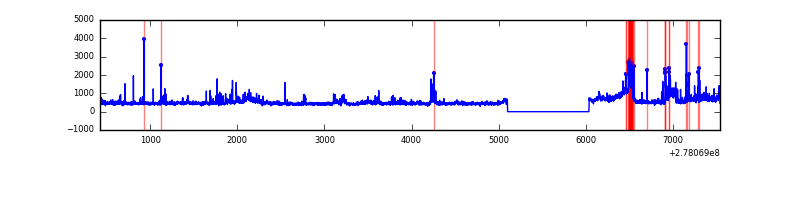 |
Top three noisy pixels from each quadrant. If the there are fewer than three noisy pixels in the level2.evt file, extra rows are filled as -1
| Pixel properties | Quadrant properties | ||||||
|---|---|---|---|---|---|---|---|
| Quadrant | DetID | PixID | Counts | Sigma | Mean | Median | Sigma |
| A | 15 | 69 | 22964 | 151.04 | 722 | 704 | 147.4 |
| A | 9 | 143 | 10139 | 64.02 | 722 | 704 | 147.4 |
| A | 3 | 1 | 7366 | 45.2 | 722 | 704 | 147.4 |
| B | 15 | 35 | 119531 | 864.49 | 721 | 701 | 137.5 |
| B | 7 | 220 | 82900 | 598.0 | 721 | 701 | 137.5 |
| B | 3 | 209 | 69007 | 496.93 | 721 | 701 | 137.5 |
| C | 3 | 233 | 156789 | 966.69 | 691 | 695 | 161.5 |
| C | 14 | 238 | 107573 | 661.9 | 691 | 695 | 161.5 |
| C | 7 | 247 | 93471 | 574.56 | 691 | 695 | 161.5 |
| D | 1 | 52 | 419609 | 2477.73 | 699 | 678 | 169.1 |
| D | 2 | 14 | 182043 | 1072.67 | 699 | 678 | 169.1 |
| D | 12 | 110 | 133844 | 787.6 | 699 | 678 | 169.1 |
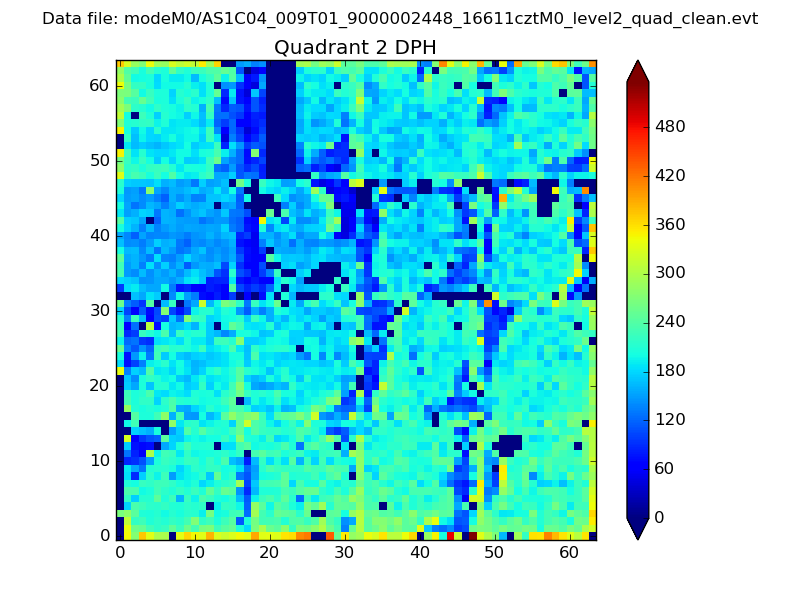
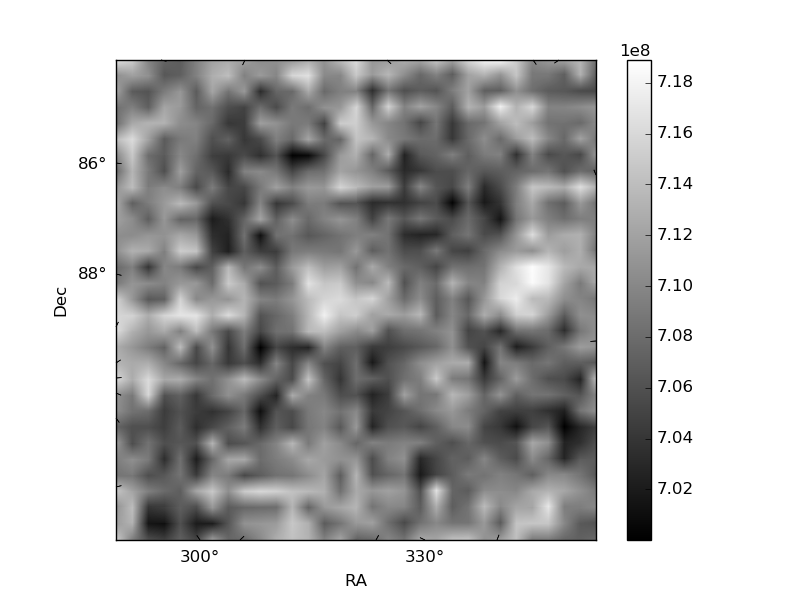
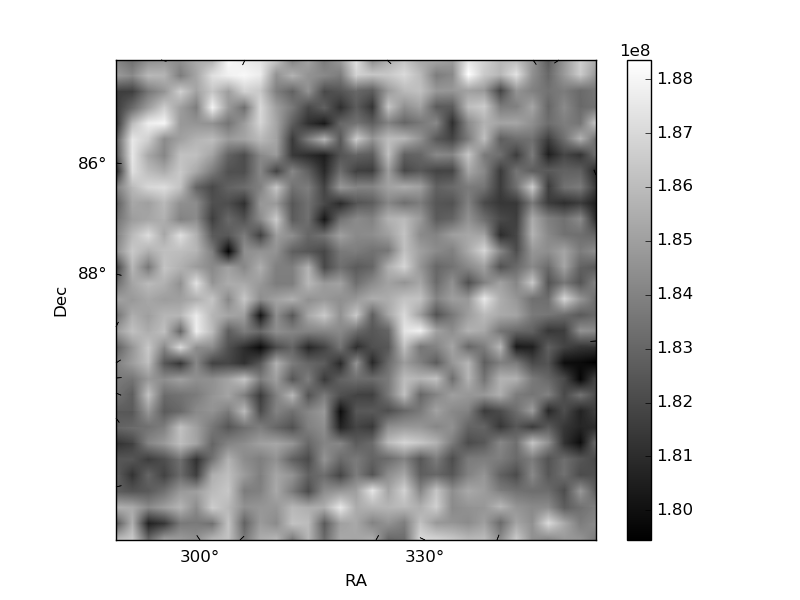
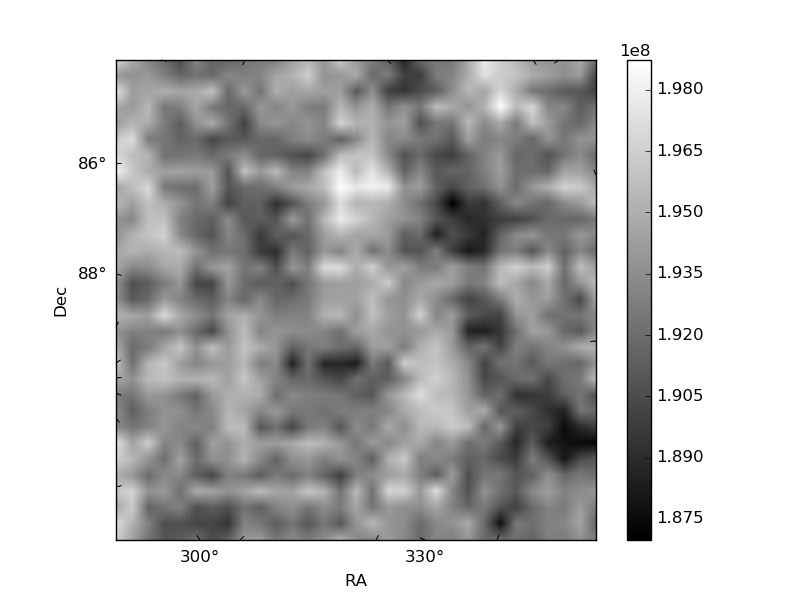
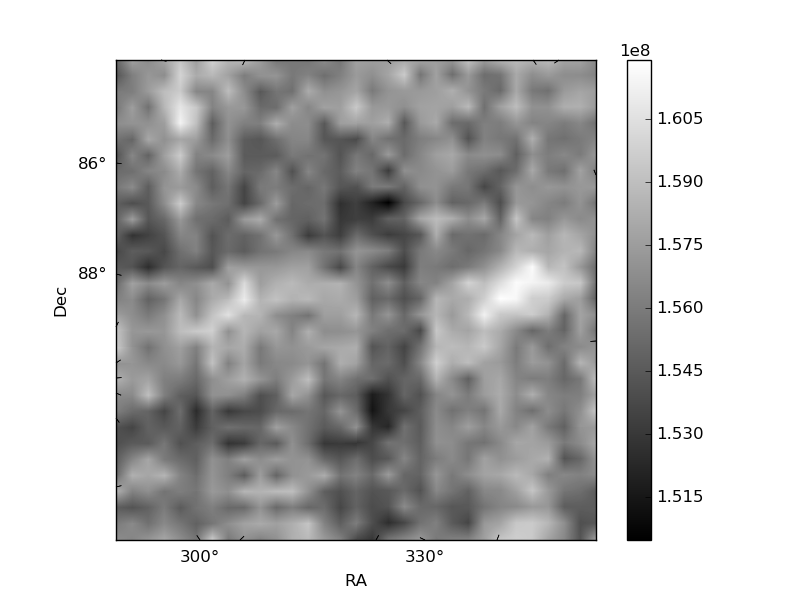
Histogram calculated using DETX and DETY for each event in the final _common_clean file
| Quadrant A | 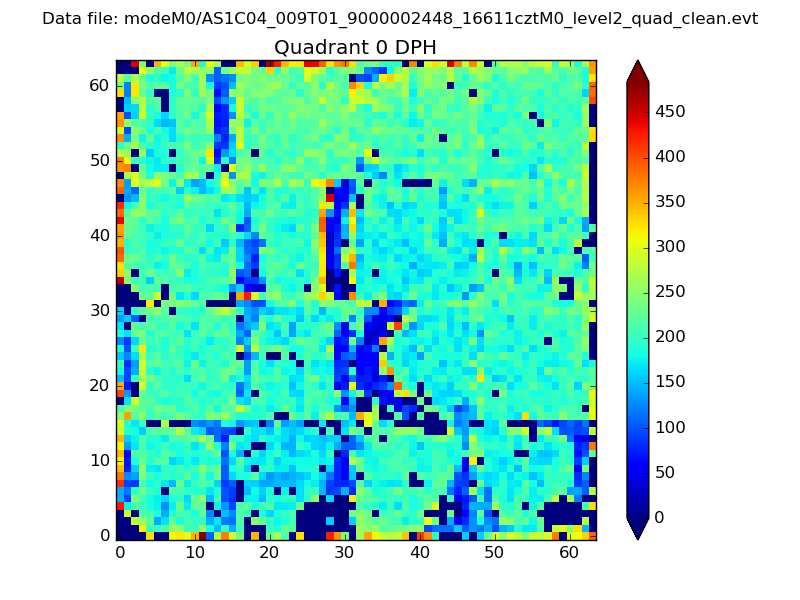 |
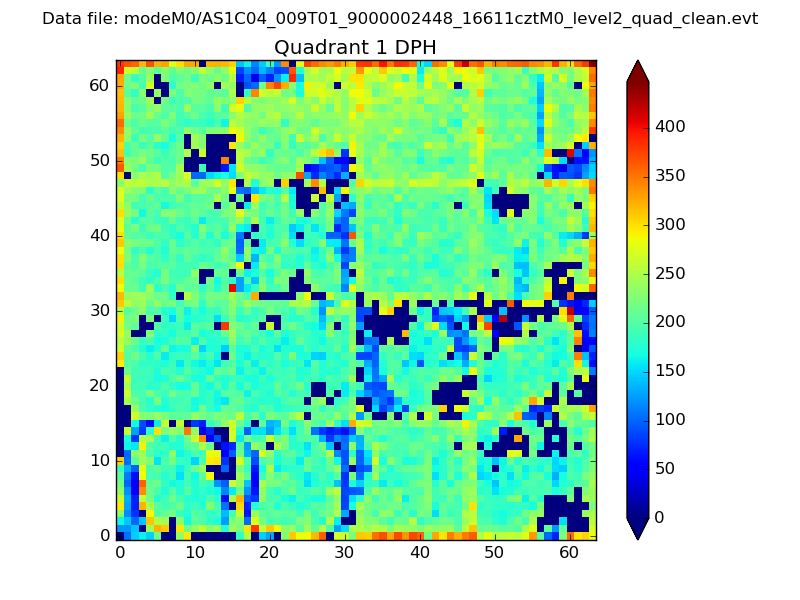 |
Quadrant B |
|---|---|---|---|
| Quadrant D | 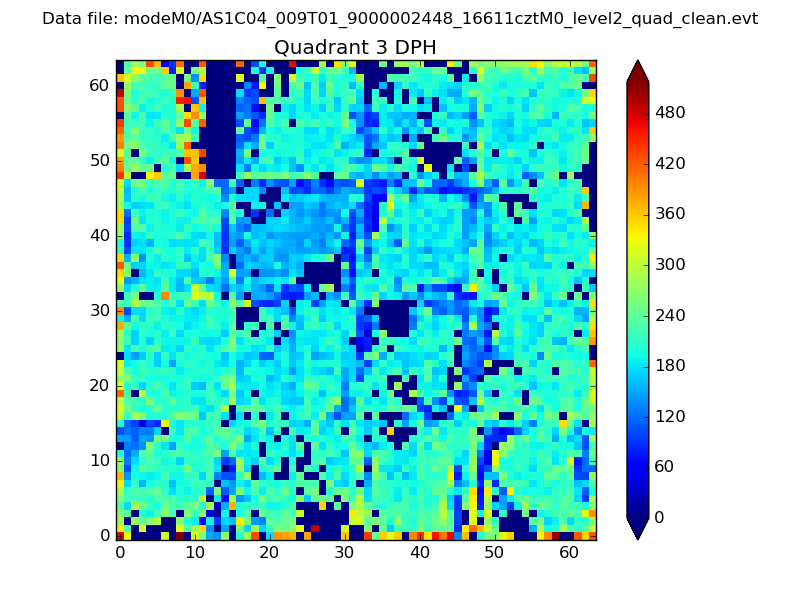 |
 |
Quadrant C |
| Plot type | Count rate plots | Images |
|---|---|---|
| Comparison with Poisson distribution Blue bars denote a histogram of data divided into 1 sec bins. Red curve is a Poisson curve with rate = median count rate of data. |
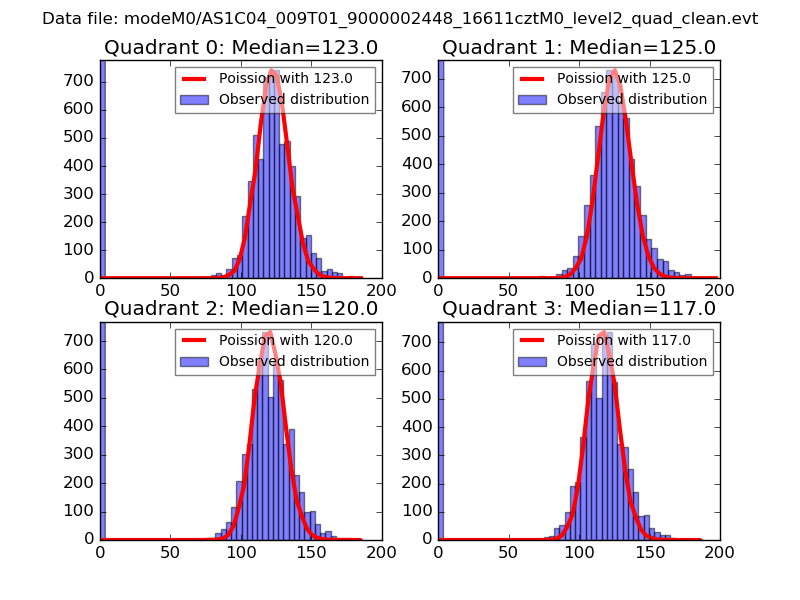 |
 |
| Quadrant-wise count rates Data is divided into 100 sec bins |
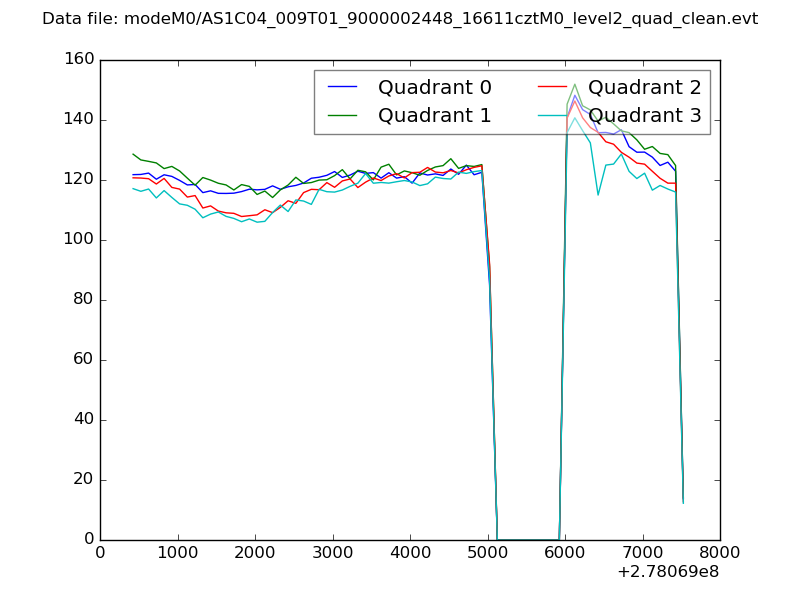 |
|
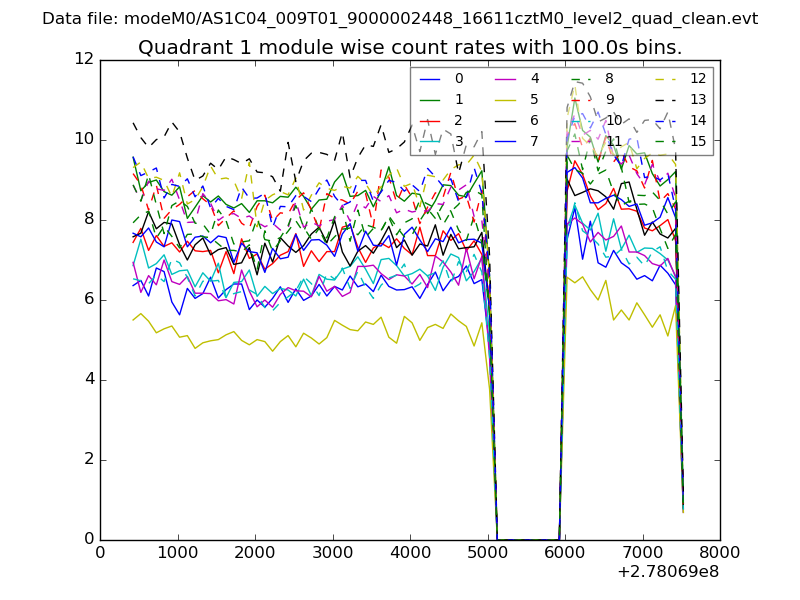
| Module-wise count rates for Quadrant A Data is divided into 100 sec bins |
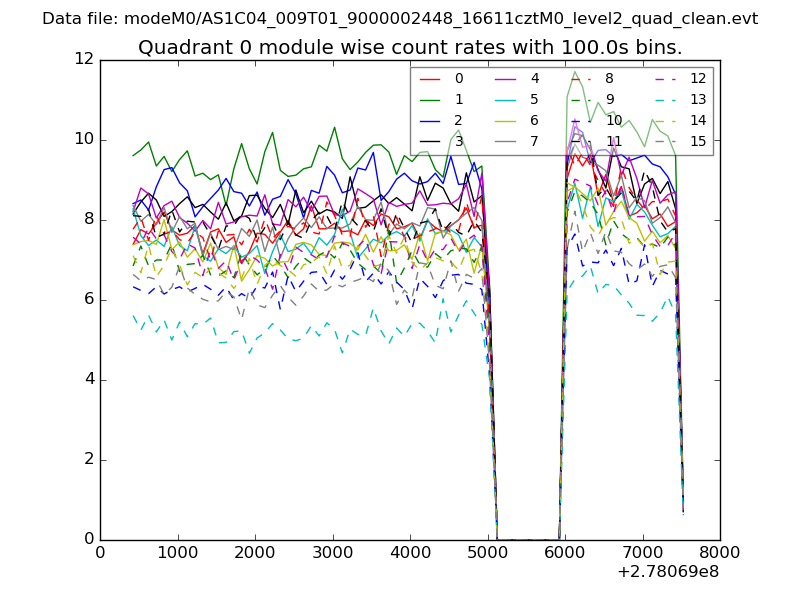 |
 |
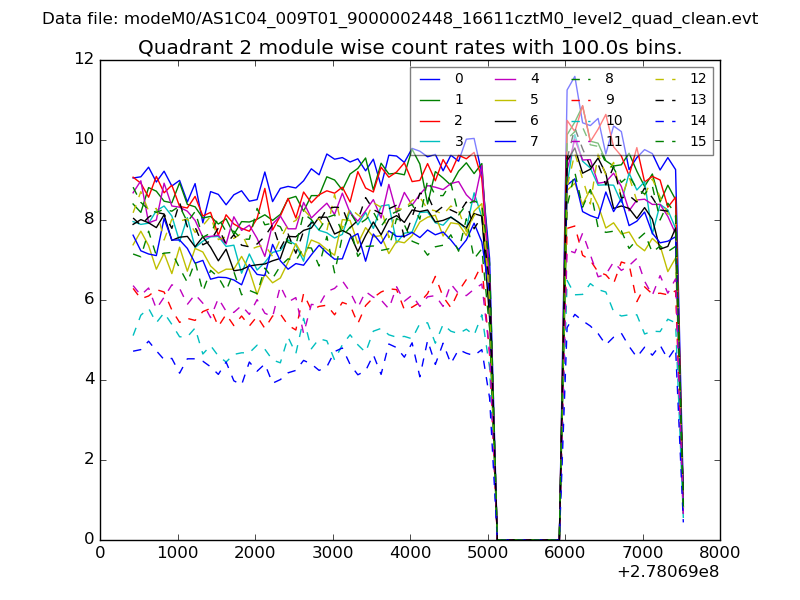
| Module-wise count rates for Quadrant B Data is divided into 100 sec bins |
 |
 |
| Module-wise count rates for Quadrant C Data is divided into 100 sec bins |
 |
 |
| Module-wise count rates for Quadrant D Data is divided into 100 sec bins |
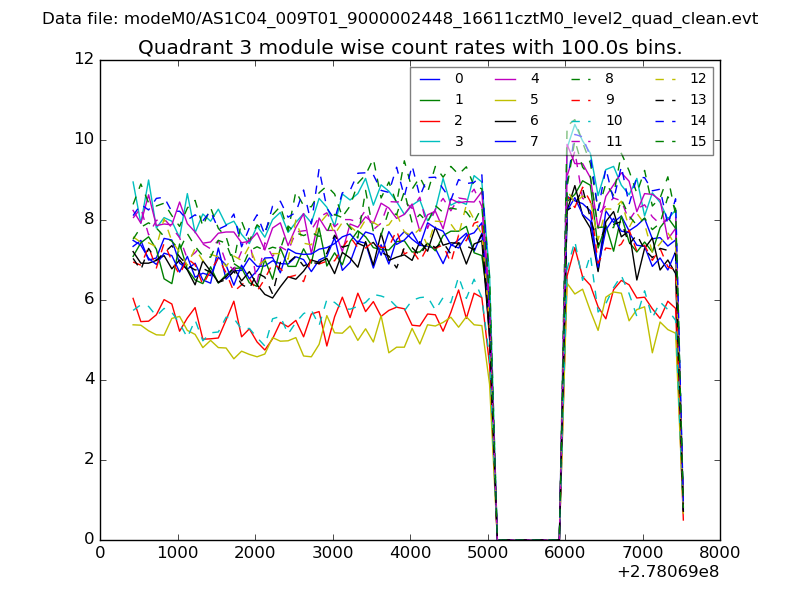 |
 |
| Parameter | Plot |
|---|---|
| CZT HV Monitor | 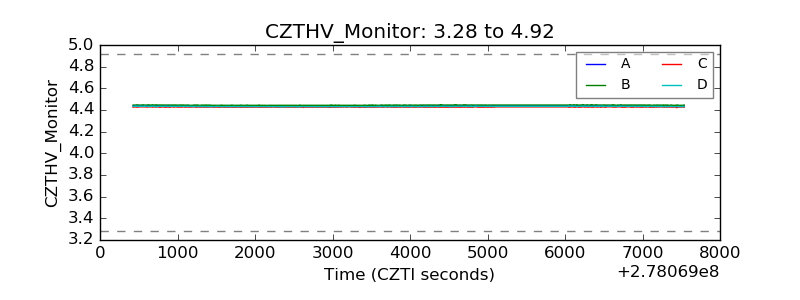 |
| D_VDD | 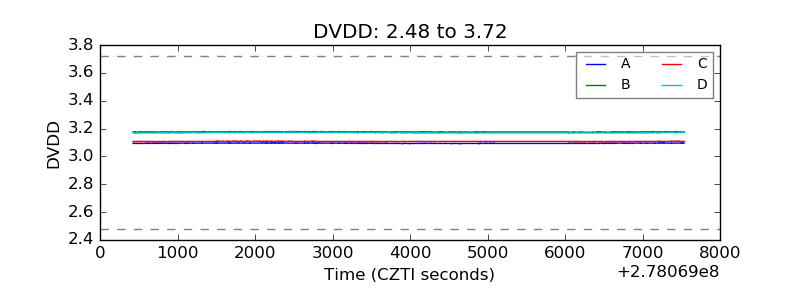 |
| Temperature 1 | 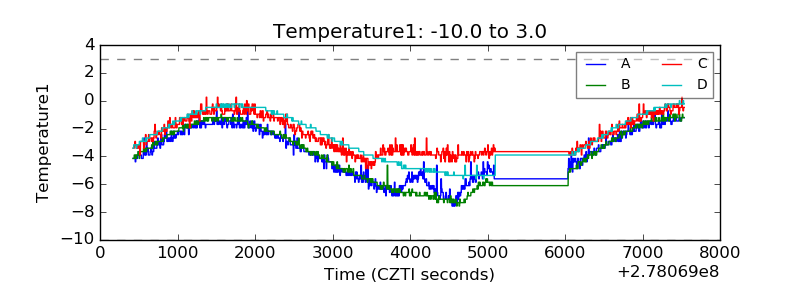 |
| Veto HV Monitor | 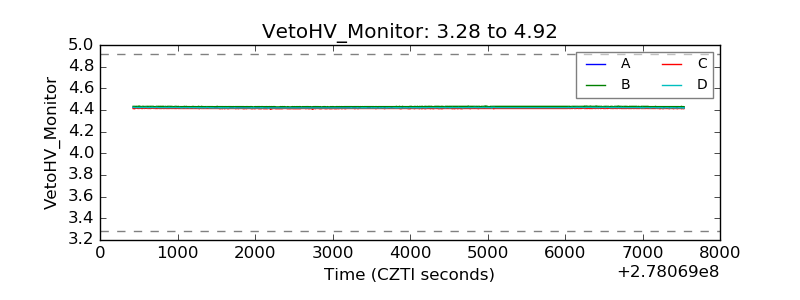 |
| Veto LLD | 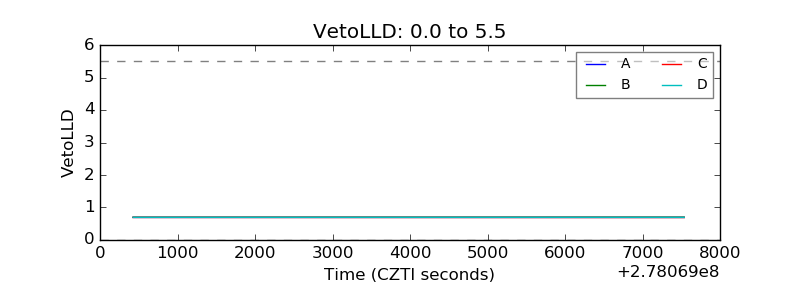 |
| Alpha Counter | 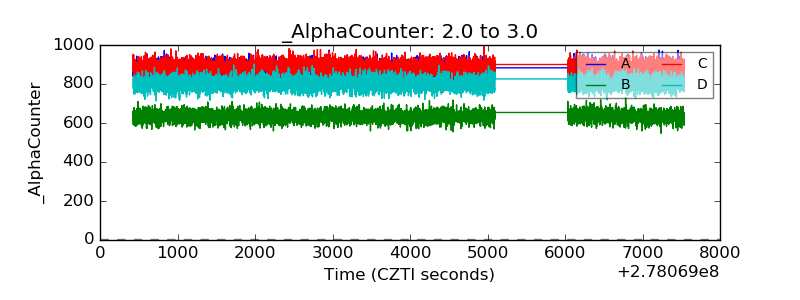 |
| _CPM_Rate | 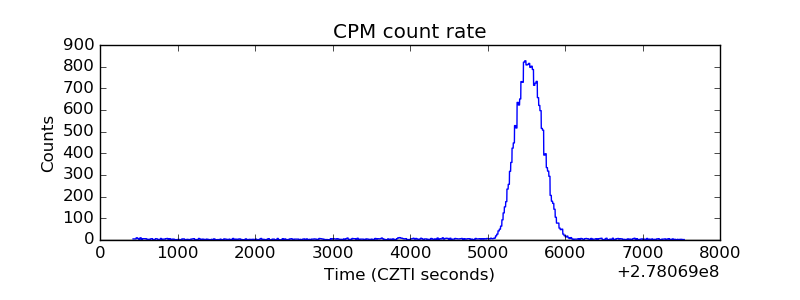 |
| CZT Counter | 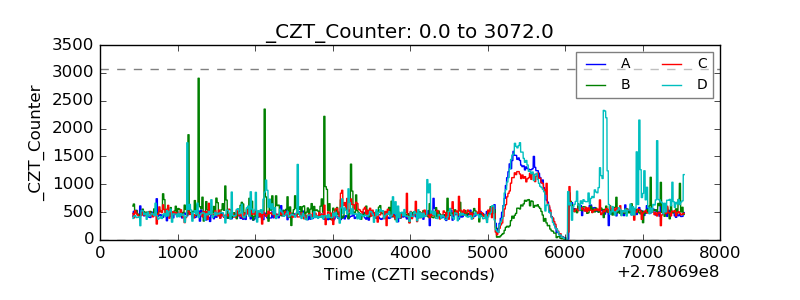 |
| +2.5 Volts monitor |  |
| +5 Volts monitor |  |
| _ROLL_ROT | 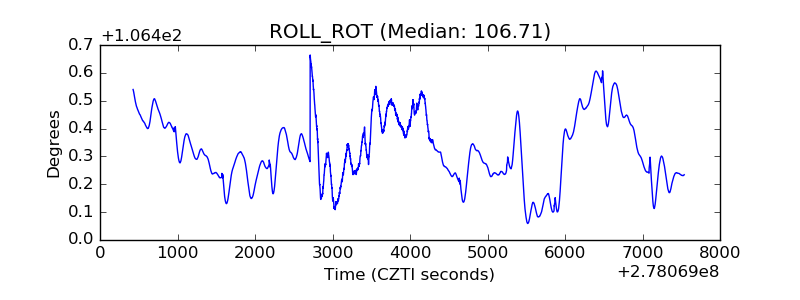 |
| _Roll_DEC |  |
| _Roll_RA | 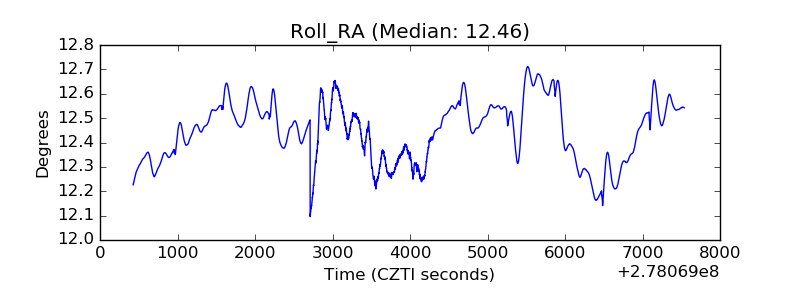 |
| Veto Counter | 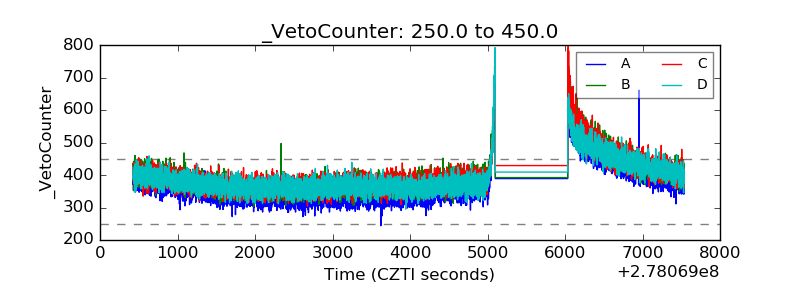 |