| Param | Original file | Final file |
|---|---|---|
| Filename | modeM0/AS1C04_009T01_9000002448_16612cztM0_level2.evt | modeM0/AS1C04_009T01_9000002448_16612cztM0_level2_quad_clean.evt |
| Size (bytes) | 446,212,800 | 90,504,000 |
| Size | 425.5 MB | 86.3 MB |
| Events in quadrant A | 2,436,632 | 621,745 |
| Events in quadrant B | 2,530,699 | 631,485 |
| Events in quadrant C | 2,320,864 | 610,331 |
| Events in quadrant D | 5,890,058 | 530,709 |
| Mode M0 | |||
|---|---|---|---|
| Quadrant | BADHDUFLAG | Total packets | Discarded packets |
| A | 0 | 10660 | 1 |
| B | 0 | 10829 | 1 |
| C | 0 | 10185 | 1 |
| D | 0 | 20864 | 1 |
| Mode SS | |||
|---|---|---|---|
| Quadrant | BADHDUFLAG | Total packets | Discarded packets |
| A | 0 | 102 | 0 |
| B | 0 | 102 | 0 |
| C | 0 | 102 | 0 |
| D | 0 | 102 | 0 |
| Mode M9 | |||
|---|---|---|---|
| Quadrant | BADHDUFLAG | Total packets | Discarded packets |
| A | 0 | 11 | 0 |
| B | 0 | 11 | 0 |
| C | 0 | 11 | 0 |
| D | 0 | 11 | 0 |
| Quadrant | Total seconds | Saturated seconds | Saturation percentage |
|---|---|---|---|
| A | 4930 | 51 | 1.034483% |
| B | 4930 | 55 | 1.115619% |
| C | 4930 | 58 | 1.176471% |
| D | 4930 | 1034 | 20.973631% |
Noise dominated data is calculated using 1-second bins in cleaned event files. If a bin has >2000 counts, and if more than 50% of those come from <1% of pixels, then it is considered to be noise-dominated and hence unusable.
| Quadrant | # 1 sec bins | Bins with >0 counts | Bins with >2000 counts | High rate bins dominated by noise | Noise dominated (total time) | Noise dominated (detector-on time) | Marked lightcurve |
|---|---|---|---|---|---|---|---|
| A | 6021 | 4932 | 13 | 13 | 0.22% | 0.26% | 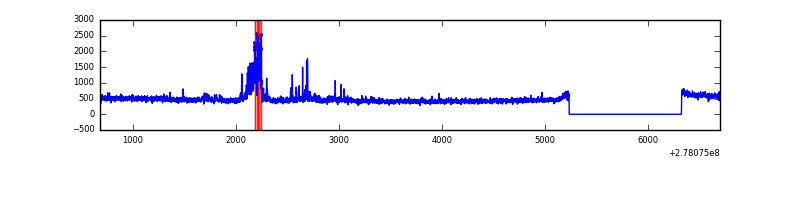 |
| B | 6021 | 4932 | 3 | 3 | 0.05% | 0.06% |  |
| C | 6021 | 4932 | 0 | 0 | 0.00% | 0.00% | 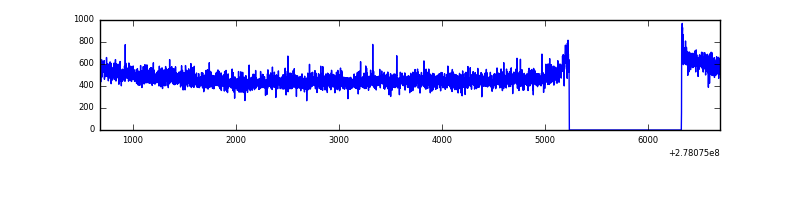 |
| D | 6021 | 4932 | 942 | 942 | 15.65% | 19.10% | 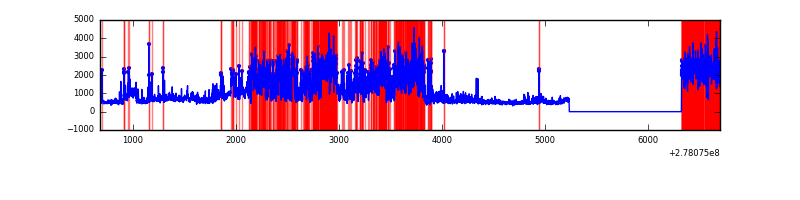 |
Top three noisy pixels from each quadrant. If the there are fewer than three noisy pixels in the level2.evt file, extra rows are filled as -1
| Pixel properties | Quadrant properties | ||||||
|---|---|---|---|---|---|---|---|
| Quadrant | DetID | PixID | Counts | Sigma | Mean | Median | Sigma |
| A | 15 | 69 | 171577 | 1458.05 | 572 | 560 | 117.3 |
| A | 15 | 174 | 35595 | 298.7 | 572 | 560 | 117.3 |
| A | 9 | 143 | 24389 | 203.16 | 572 | 560 | 117.3 |
| B | 15 | 35 | 89886 | 827.81 | 573 | 558 | 107.9 |
| B | 7 | 220 | 48818 | 447.23 | 573 | 558 | 107.9 |
| B | 0 | 198 | 36321 | 331.42 | 573 | 558 | 107.9 |
| C | 14 | 238 | 85039 | 657.14 | 552 | 555 | 128.6 |
| C | 3 | 233 | 50718 | 390.18 | 552 | 555 | 128.6 |
| C | 7 | 247 | 31629 | 241.7 | 552 | 555 | 128.6 |
| D | 1 | 52 | 3824028 | 31045.53 | 510 | 495 | 123.2 |
| D | 10 | 70 | 55727 | 448.46 | 510 | 495 | 123.2 |
| D | 12 | 110 | 41878 | 336.01 | 510 | 495 | 123.2 |
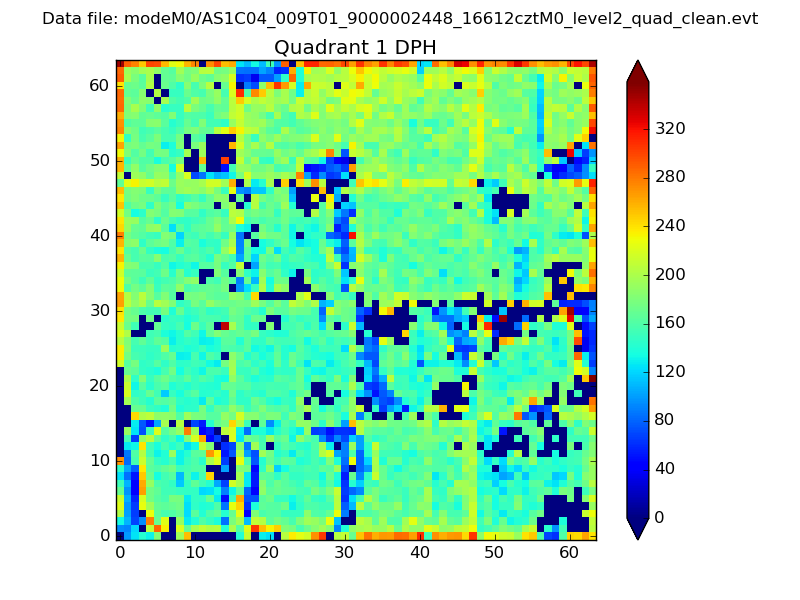
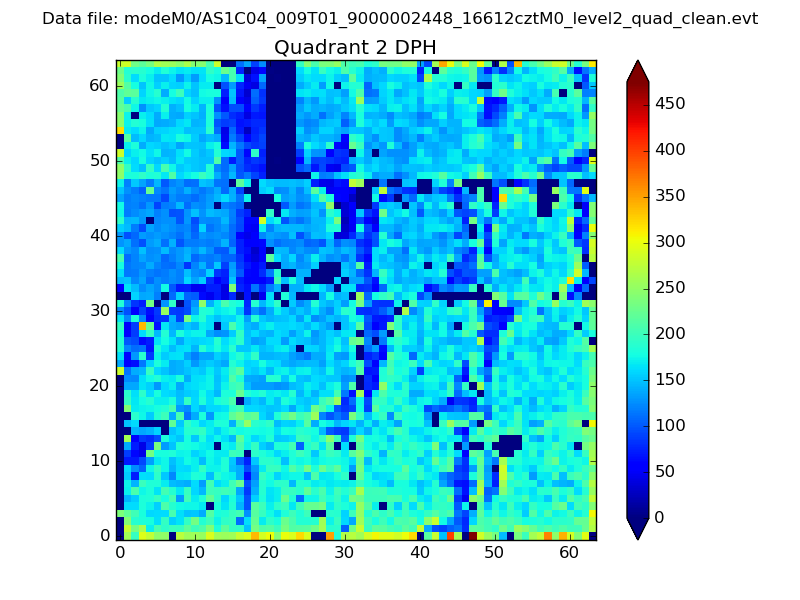
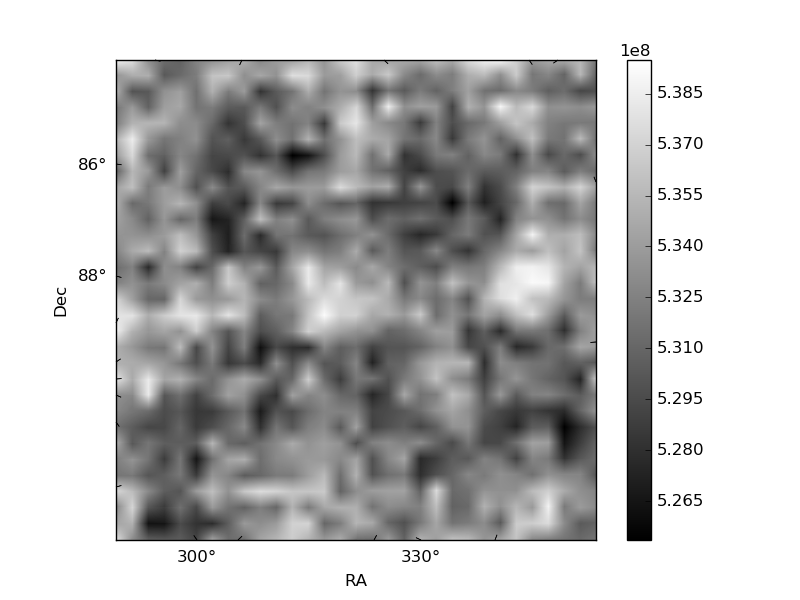
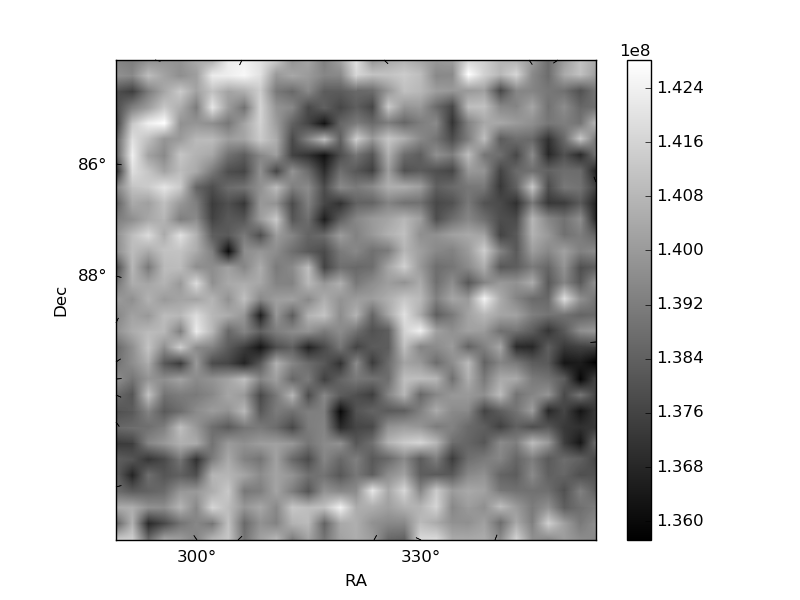
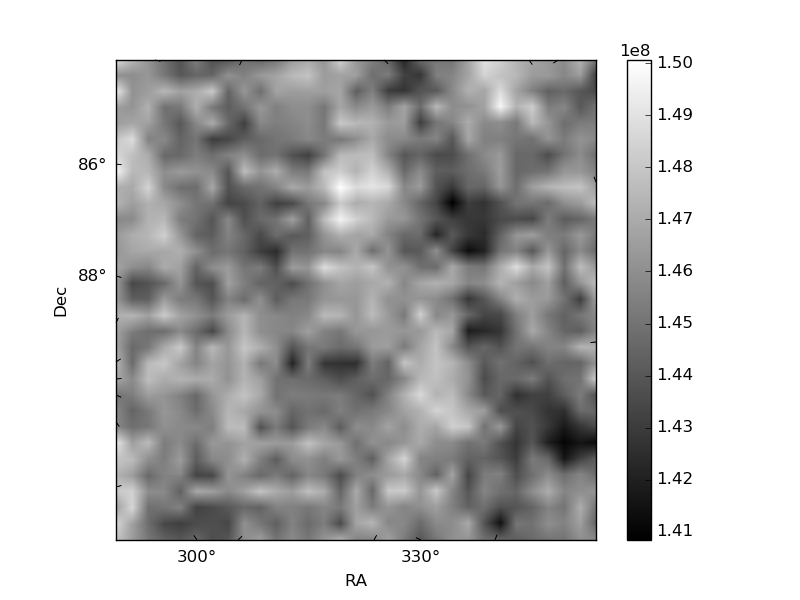
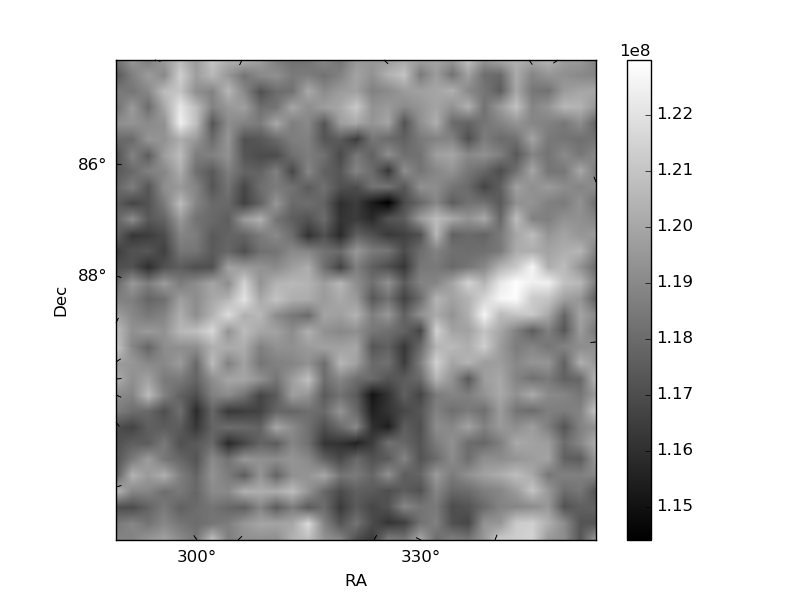
Histogram calculated using DETX and DETY for each event in the final _common_clean file
| Quadrant A | 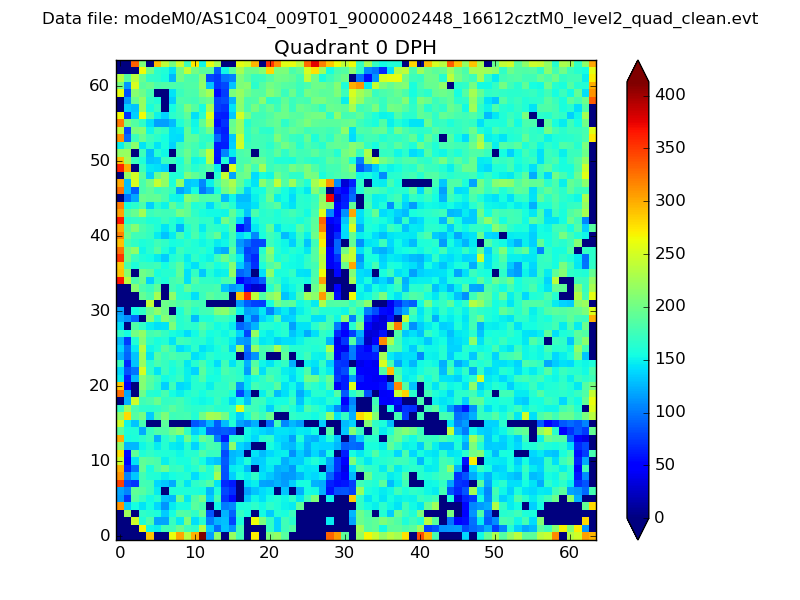 |
 |
Quadrant B |
|---|---|---|---|
| Quadrant D | 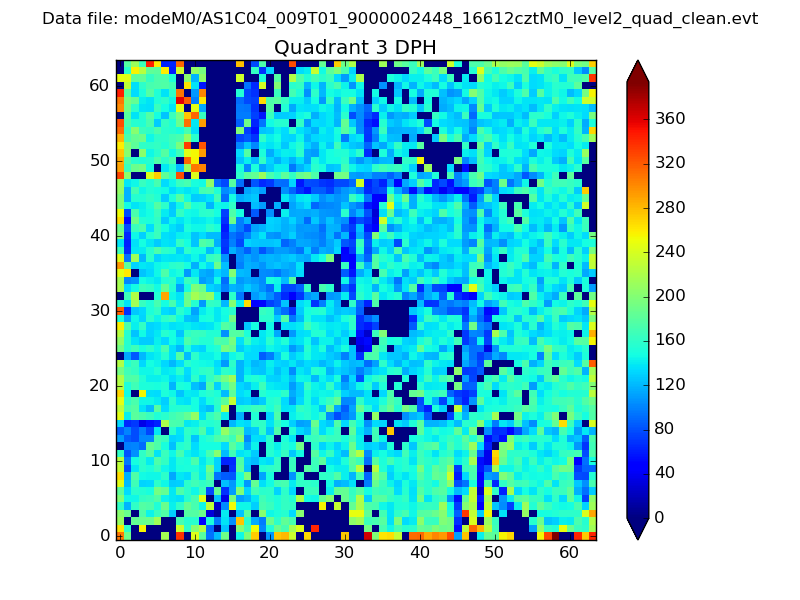 |
 |
Quadrant C |
| Plot type | Count rate plots | Images |
|---|---|---|
| Comparison with Poisson distribution Blue bars denote a histogram of data divided into 1 sec bins. Red curve is a Poisson curve with rate = median count rate of data. |
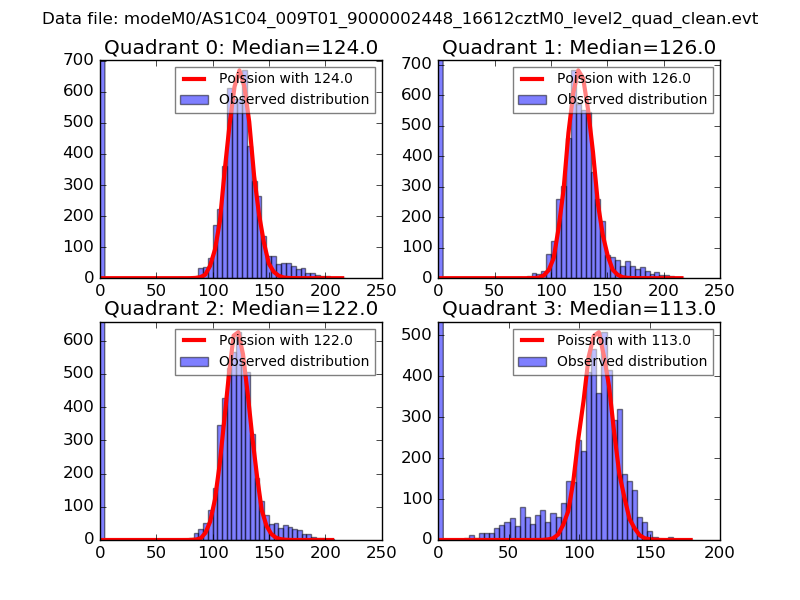 |
 |
| Quadrant-wise count rates Data is divided into 100 sec bins |
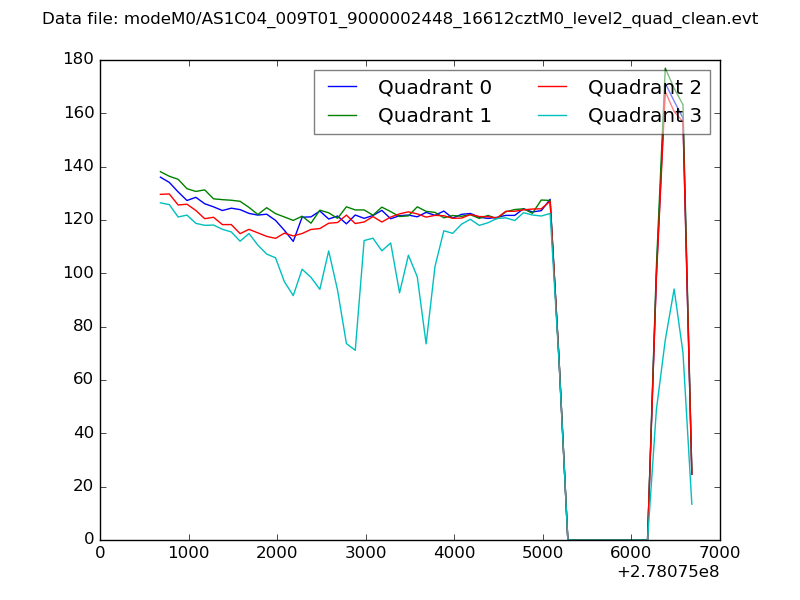 |
|
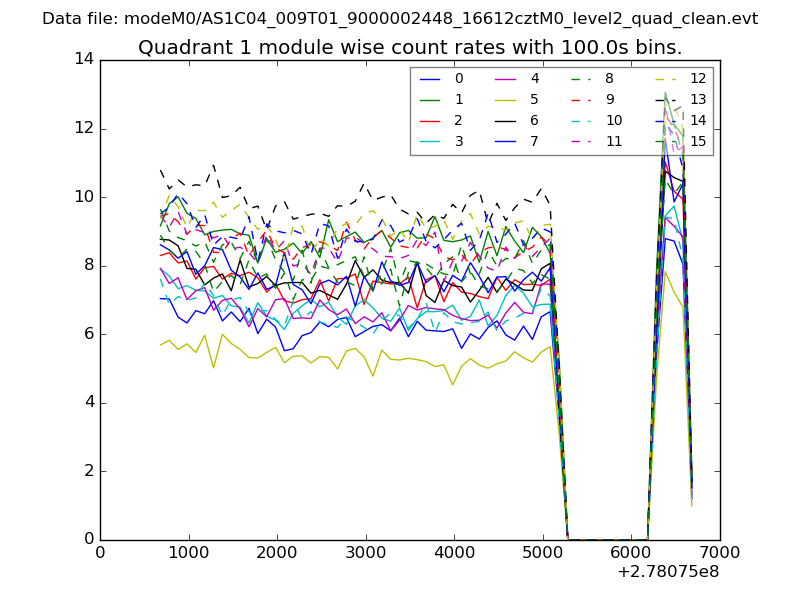
| Module-wise count rates for Quadrant A Data is divided into 100 sec bins |
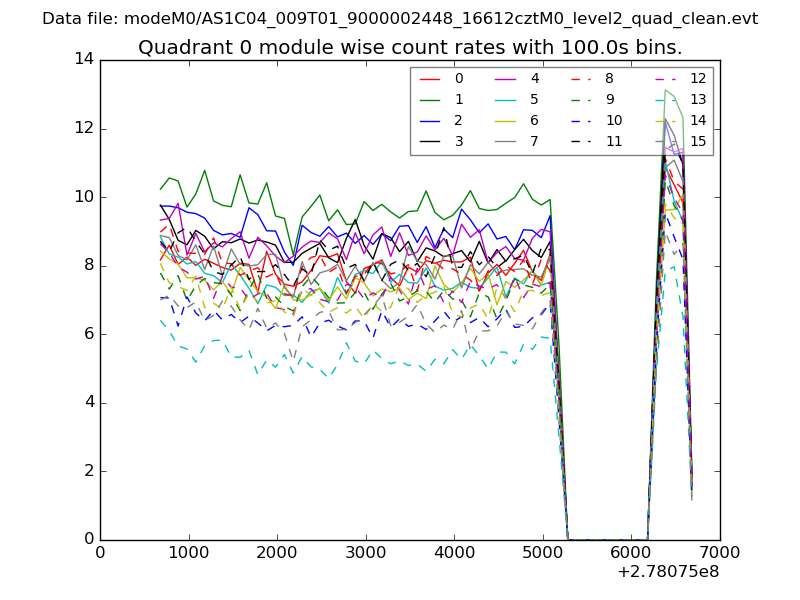 |
 |
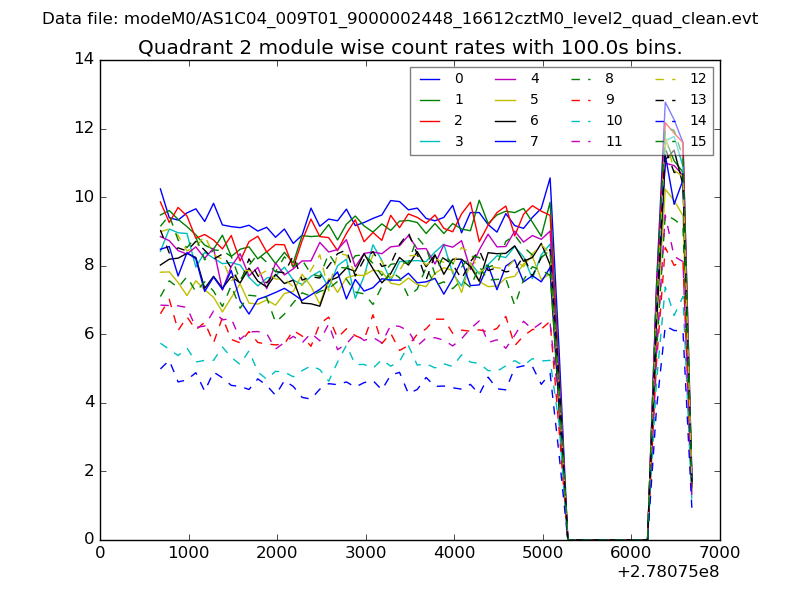
| Module-wise count rates for Quadrant B Data is divided into 100 sec bins |
 |
 |
| Module-wise count rates for Quadrant C Data is divided into 100 sec bins |
 |
 |
| Module-wise count rates for Quadrant D Data is divided into 100 sec bins |
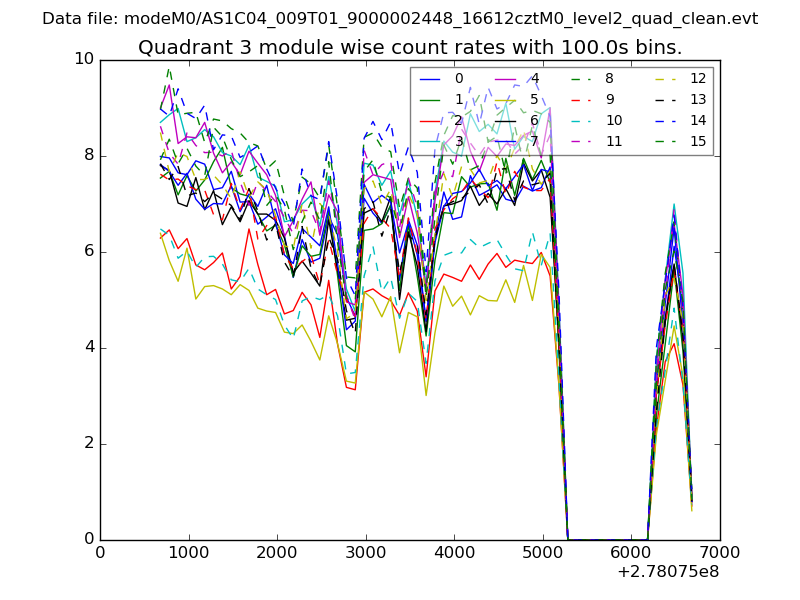 |
 |
| Parameter | Plot |
|---|---|
| CZT HV Monitor | 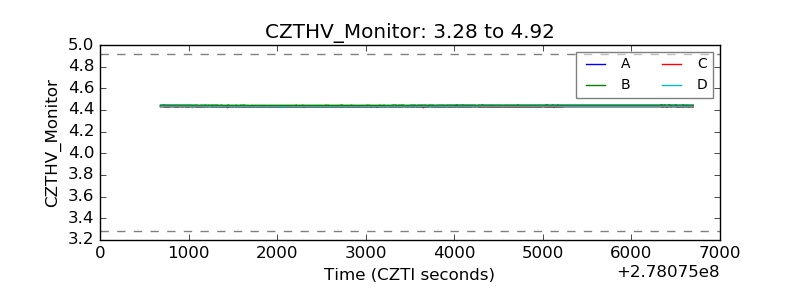 |
| D_VDD | 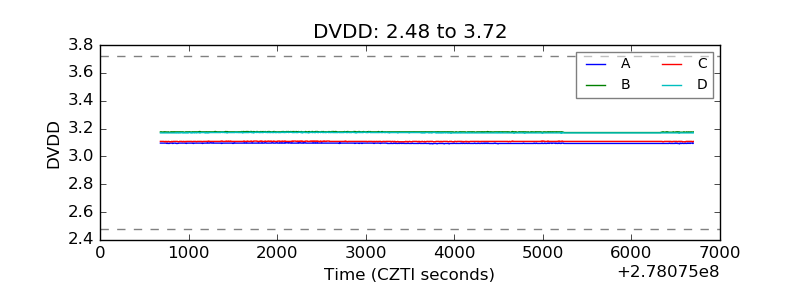 |
| Temperature 1 | 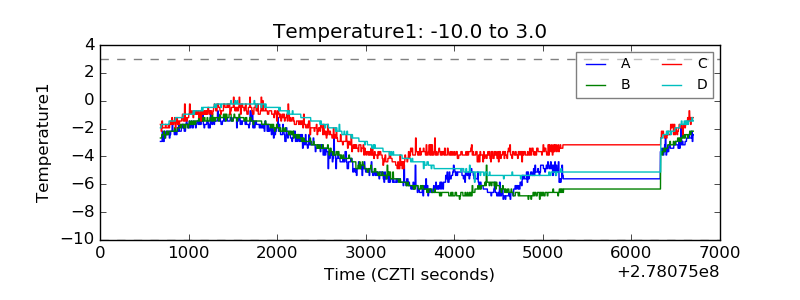 |
| Veto HV Monitor | 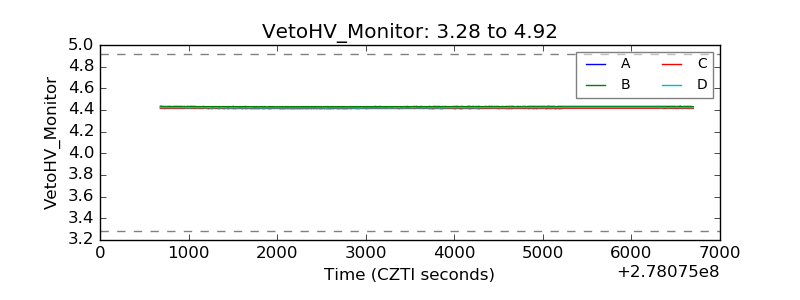 |
| Veto LLD |  |
| Alpha Counter | 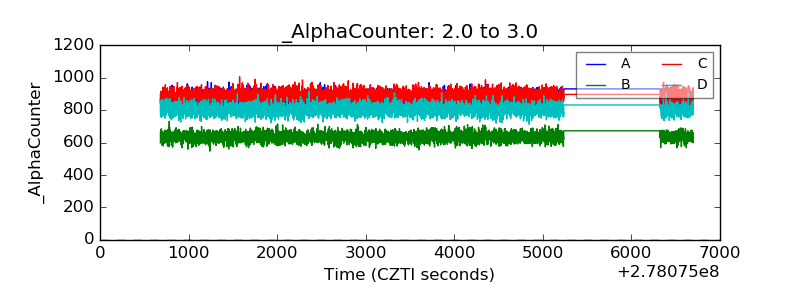 |
| _CPM_Rate | 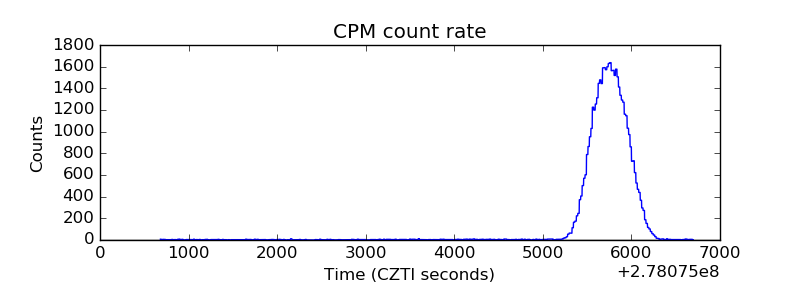 |
| CZT Counter |  |
| +2.5 Volts monitor |  |
| +5 Volts monitor |  |
| _ROLL_ROT | 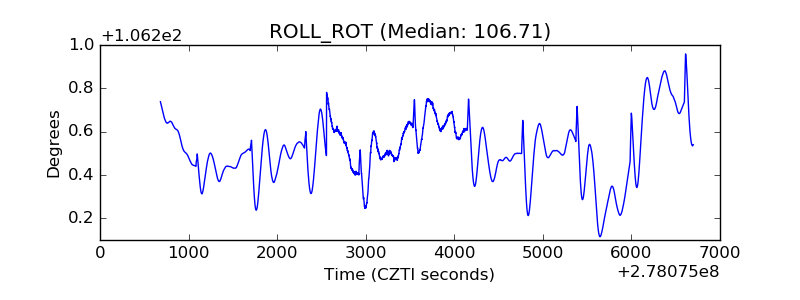 |
| _Roll_DEC | 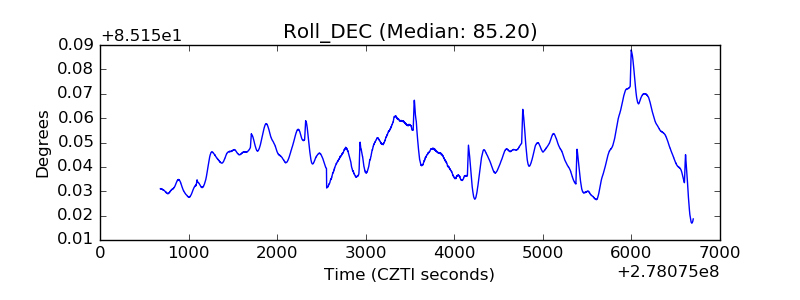 |
| _Roll_RA | 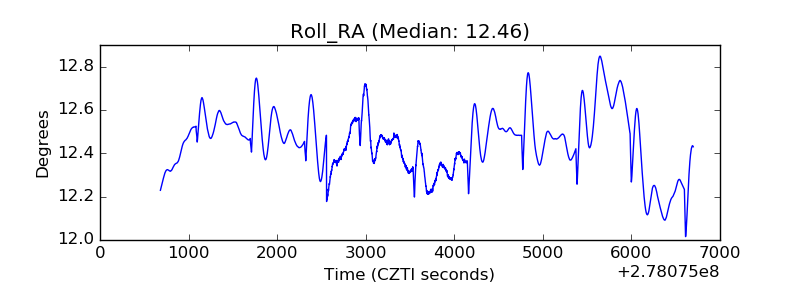 |
| Veto Counter | 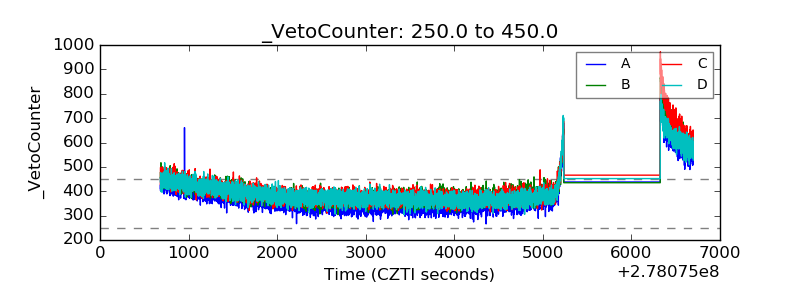 |