| Param | Original file | Final file |
|---|---|---|
| Filename | modeM0/AS1A05_064T01_9000002450_16612cztM0_level2.evt | modeM0/AS1A05_064T01_9000002450_16612cztM0_level2_quad_clean.evt |
| Size (bytes) | 65,462,400 | 8,156,160 |
| Size | 62.4 MB | 7.8 MB |
| Events in quadrant A | 225,809 | 62,643 |
| Events in quadrant B | 274,765 | 62,743 |
| Events in quadrant C | 312,150 | 58,391 |
| Events in quadrant D | 1,135,839 | 22,986 |
| Mode M0 | |||
|---|---|---|---|
| Quadrant | BADHDUFLAG | Total packets | Discarded packets |
| A | 0 | 909 | 1 |
| B | 0 | 1092 | 0 |
| C | 0 | 1252 | 0 |
| D | 0 | 3672 | 0 |
| Mode SS | |||
|---|---|---|---|
| Quadrant | BADHDUFLAG | Total packets | Discarded packets |
| A | 0 | 10 | 0 |
| B | 0 | 10 | 0 |
| C | 0 | 10 | 0 |
| D | 0 | 10 | 0 |
| Quadrant | Total seconds | Saturated seconds | Saturation percentage |
|---|---|---|---|
| A | 447 | 2 | 0.447427% |
| B | 447 | 3 | 0.671141% |
| C | 447 | 3 | 0.671141% |
| D | 447 | 446 | 99.776286% |
Noise dominated data is calculated using 1-second bins in cleaned event files. If a bin has >2000 counts, and if more than 50% of those come from <1% of pixels, then it is considered to be noise-dominated and hence unusable.
| Quadrant | # 1 sec bins | Bins with >0 counts | Bins with >2000 counts | High rate bins dominated by noise | Noise dominated (total time) | Noise dominated (detector-on time) | Marked lightcurve |
|---|---|---|---|---|---|---|---|
| A | 448 | 448 | 0 | 0 | 0.00% | 0.00% | 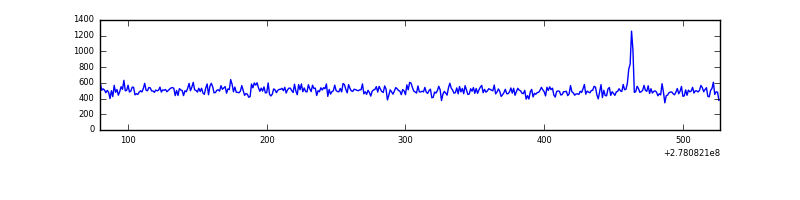 |
| B | 448 | 448 | 1 | 1 | 0.22% | 0.22% | 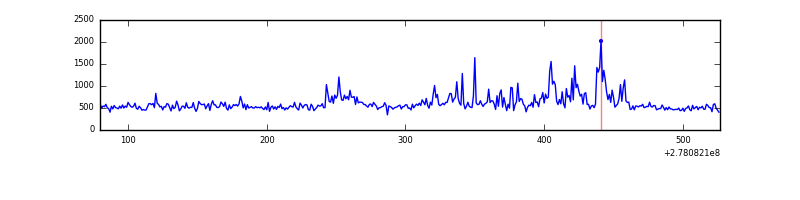 |
| C | 448 | 448 | 0 | 0 | 0.00% | 0.00% | 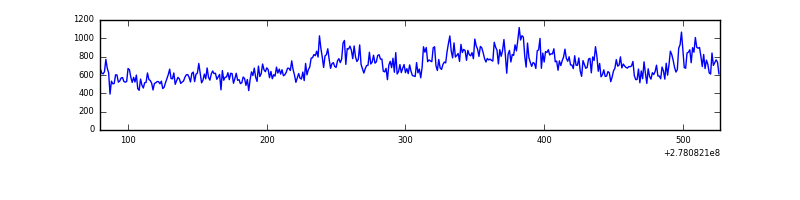 |
| D | 448 | 448 | 386 | 386 | 86.16% | 86.16% | 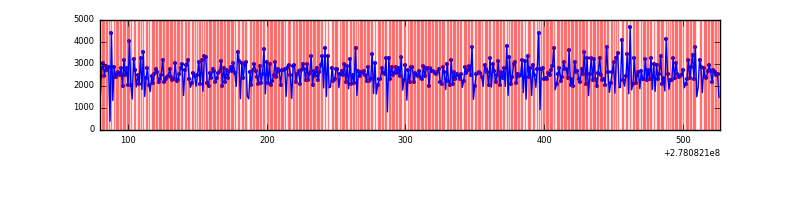 |
Top three noisy pixels from each quadrant. If the there are fewer than three noisy pixels in the level2.evt file, extra rows are filled as -1
| Pixel properties | Quadrant properties | ||||||
|---|---|---|---|---|---|---|---|
| Quadrant | DetID | PixID | Counts | Sigma | Mean | Median | Sigma |
| A | 15 | 174 | 2850 | 205.26 | 57 | 56 | 13.6 |
| A | 15 | 69 | 1119 | 78.09 | 57 | 56 | 13.6 |
| A | 0 | 226 | 502 | 32.77 | 57 | 56 | 13.6 |
| B | 15 | 35 | 32558 | 2515.64 | 56 | 54 | 12.9 |
| B | 0 | 198 | 14107 | 1087.63 | 56 | 54 | 12.9 |
| B | 3 | 209 | 2650 | 200.92 | 56 | 54 | 12.9 |
| C | 3 | 233 | 94797 | 6735.89 | 53 | 53 | 14.1 |
| C | 14 | 238 | 8118 | 573.39 | 53 | 53 | 14.1 |
| C | 13 | 61 | 388 | 23.82 | 53 | 53 | 14.1 |
| D | 1 | 52 | 1028268 | 122560.51 | 26 | 25 | 8.4 |
| D | 10 | 70 | 3247 | 384.04 | 26 | 25 | 8.4 |
| D | 2 | 14 | 1608 | 188.68 | 26 | 25 | 8.4 |
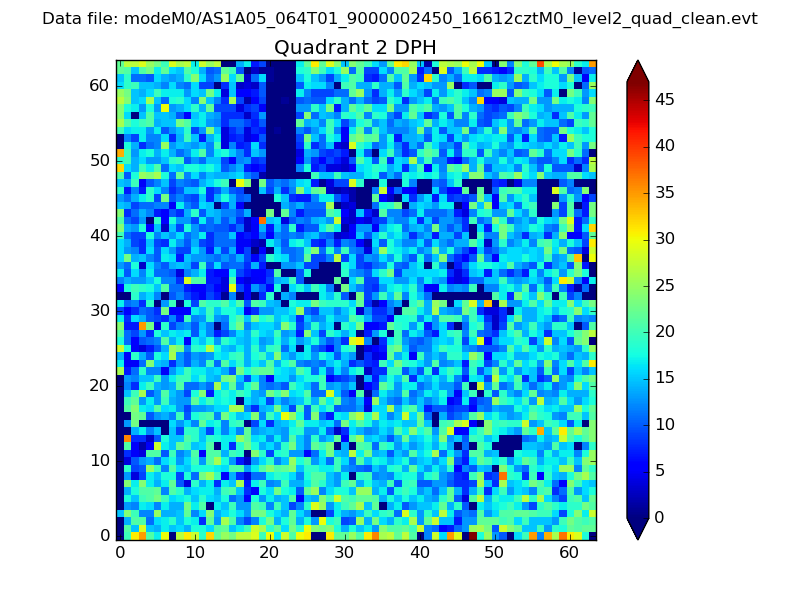
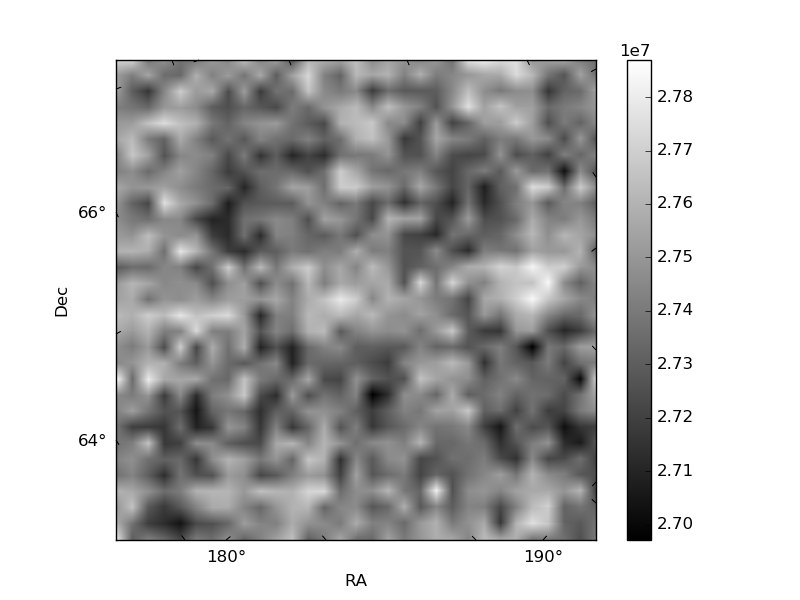
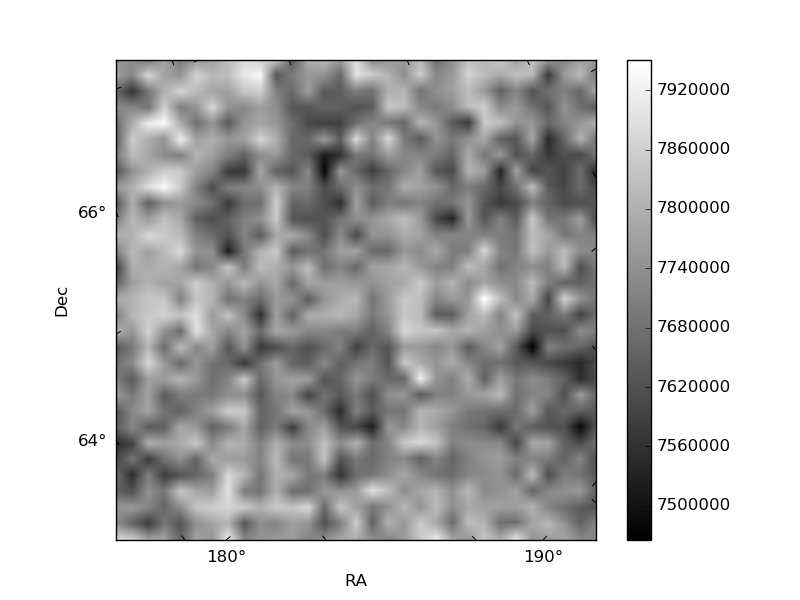
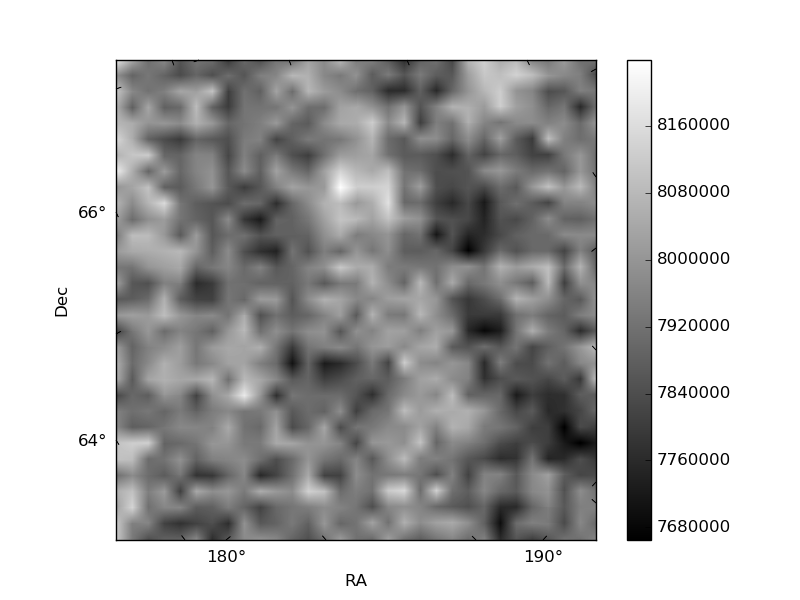
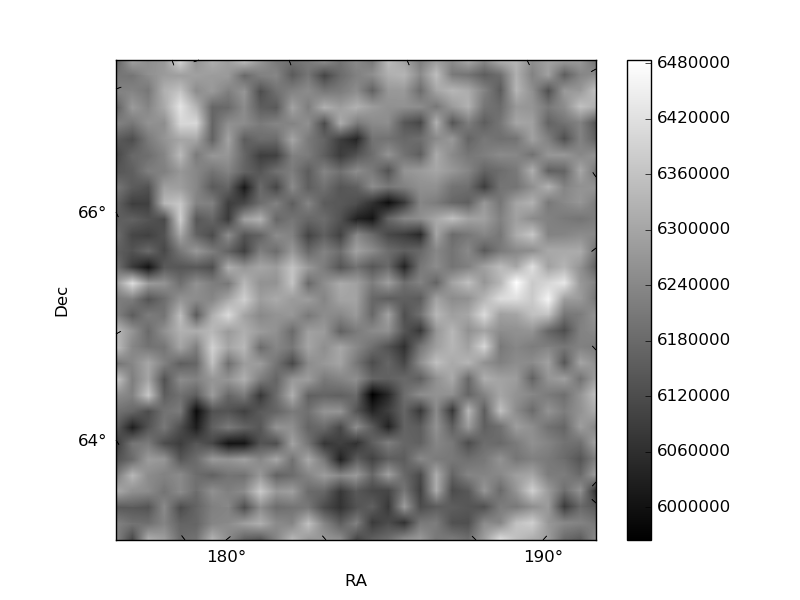
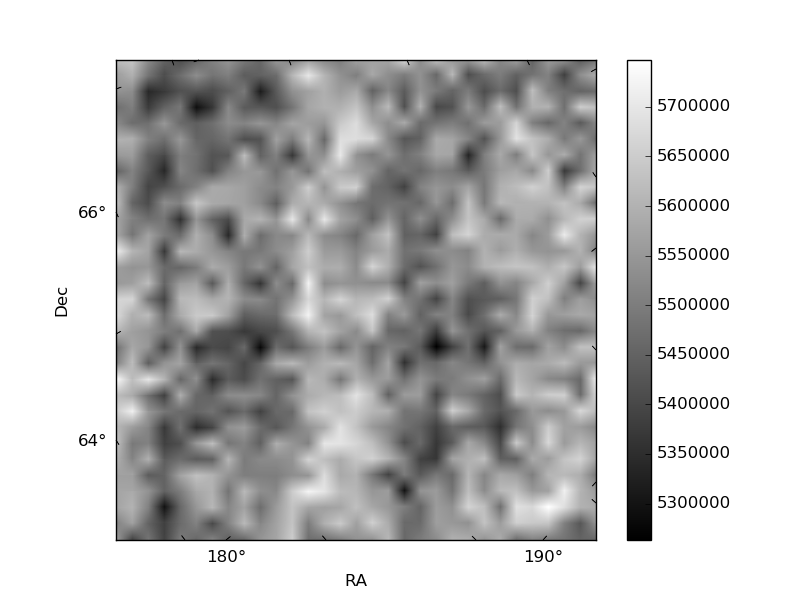
Histogram calculated using DETX and DETY for each event in the final _common_clean file
| Quadrant A | 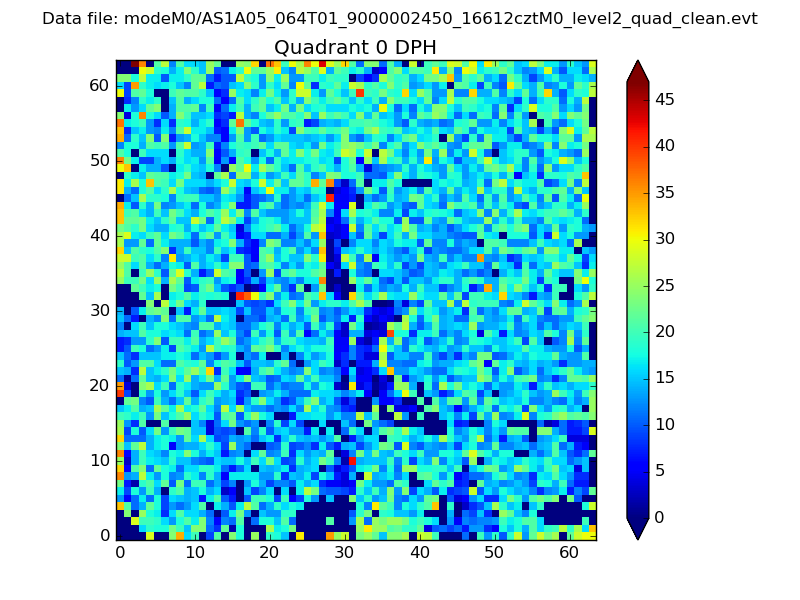 |
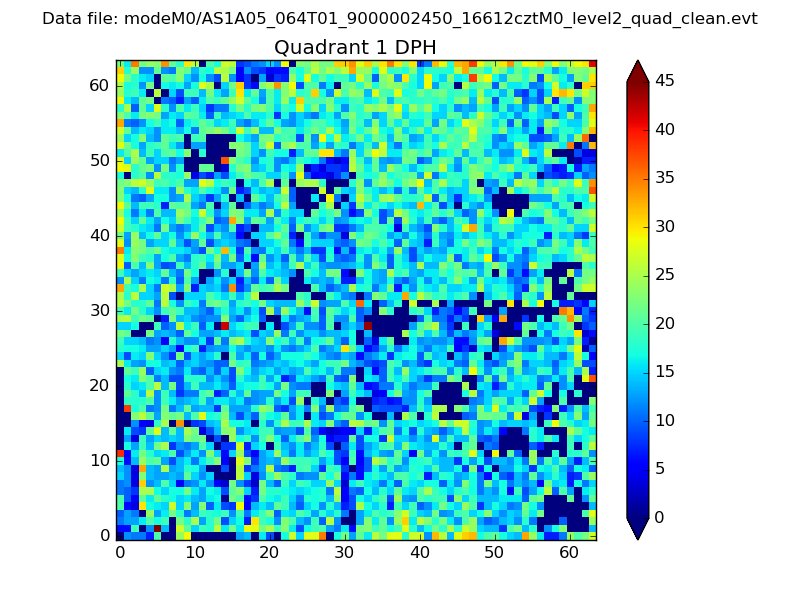 |
Quadrant B |
|---|---|---|---|
| Quadrant D | 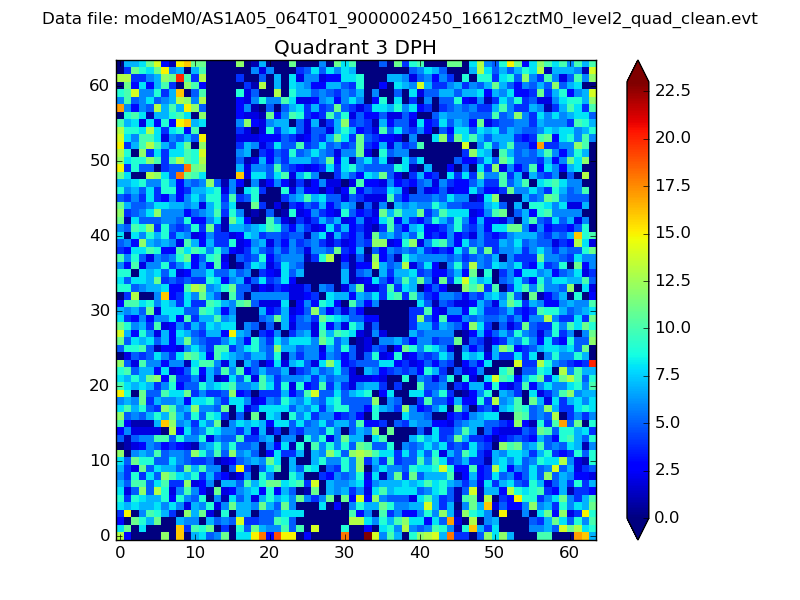 |
 |
Quadrant C |
| Plot type | Count rate plots | Images |
|---|---|---|
| Comparison with Poisson distribution Blue bars denote a histogram of data divided into 1 sec bins. Red curve is a Poisson curve with rate = median count rate of data. |
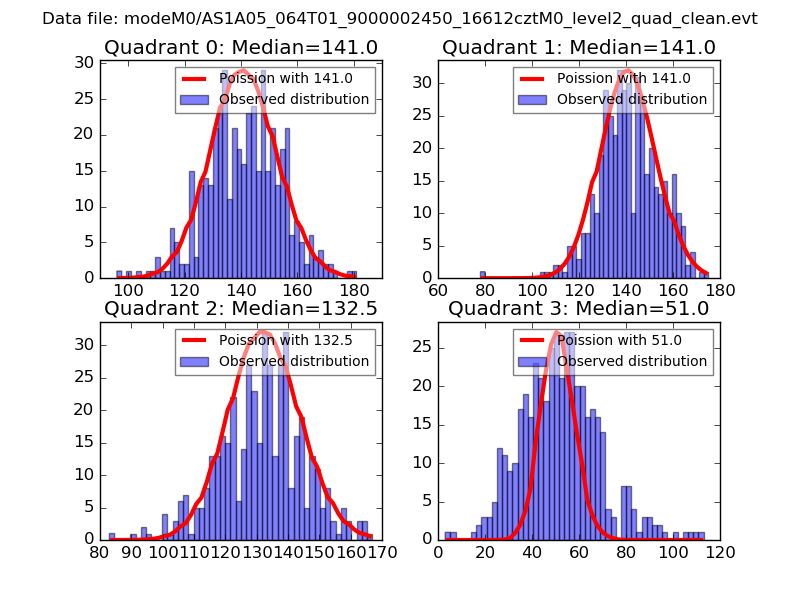 |
 |
| Quadrant-wise count rates Data is divided into 100 sec bins |
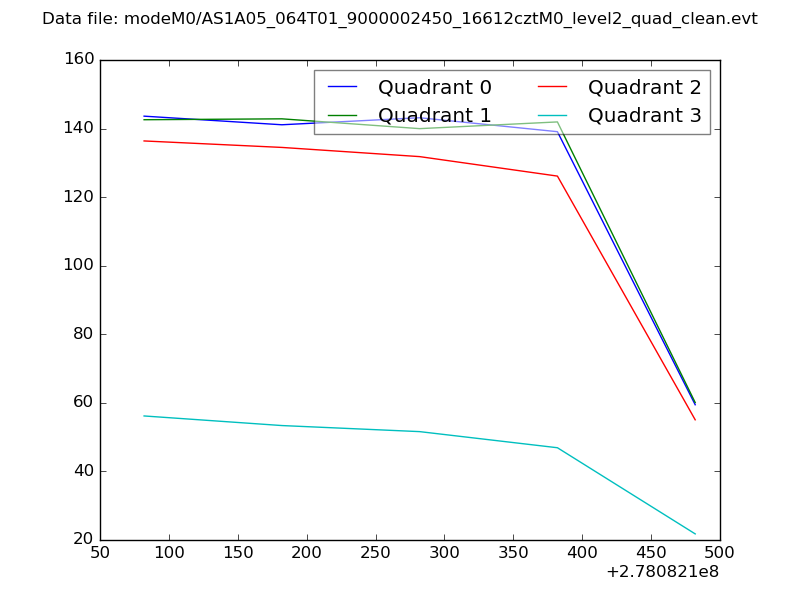 |
|
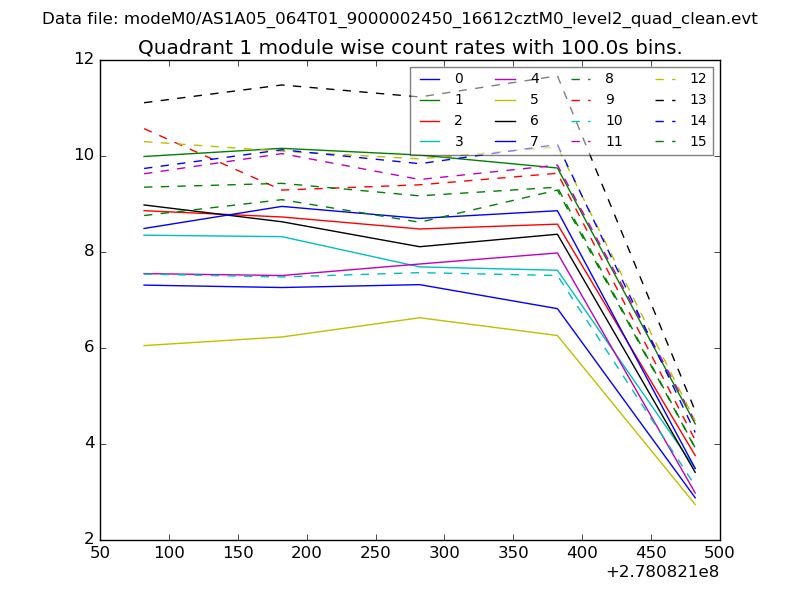
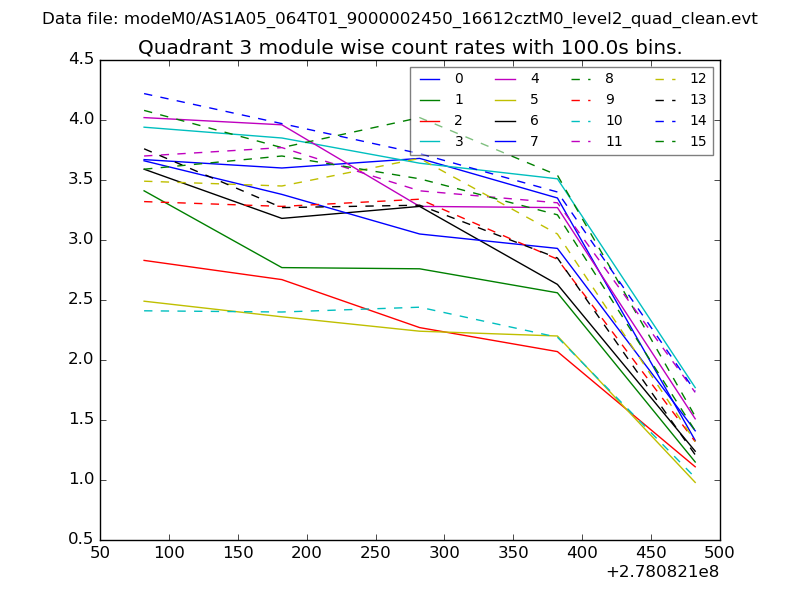
| Module-wise count rates for Quadrant A Data is divided into 100 sec bins |
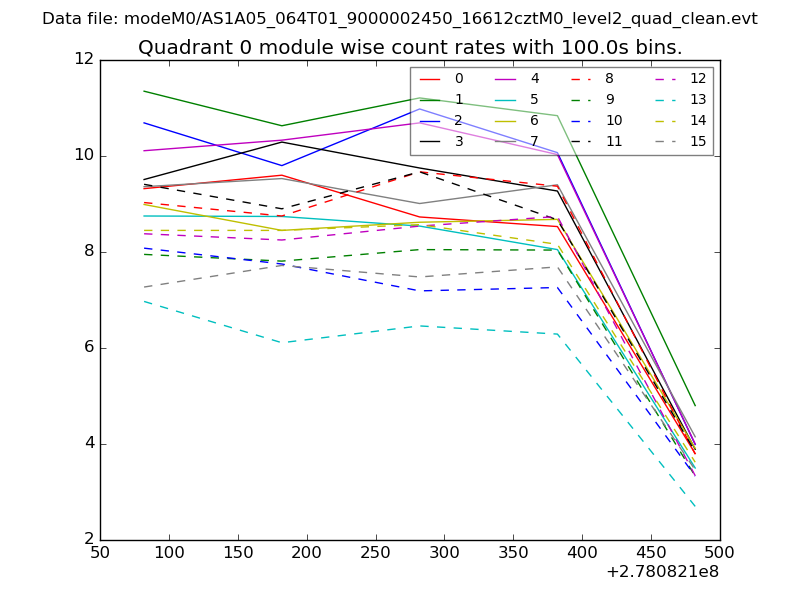 |
 |
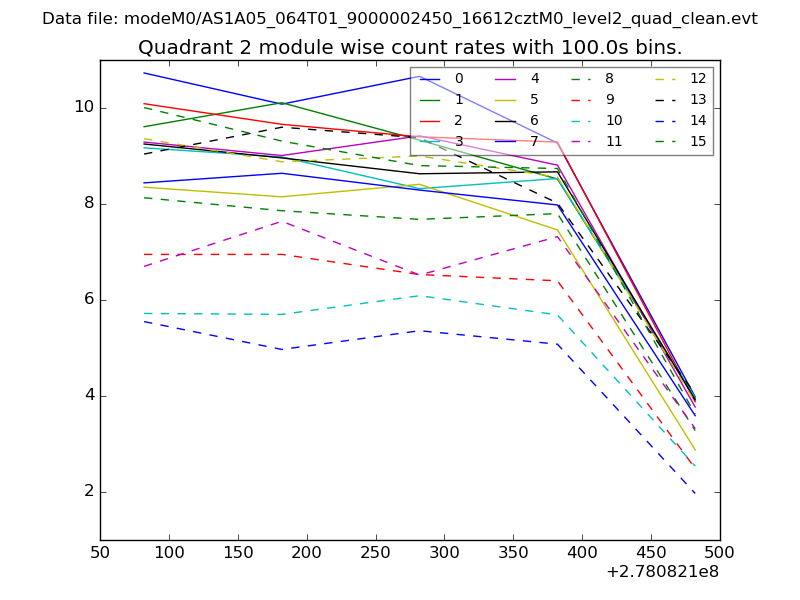
| Module-wise count rates for Quadrant B Data is divided into 100 sec bins |
 |
 |
| Module-wise count rates for Quadrant C Data is divided into 100 sec bins |
 |
 |
| Module-wise count rates for Quadrant D Data is divided into 100 sec bins |
 |
 |
| Parameter | Plot |
|---|---|
| CZT HV Monitor | 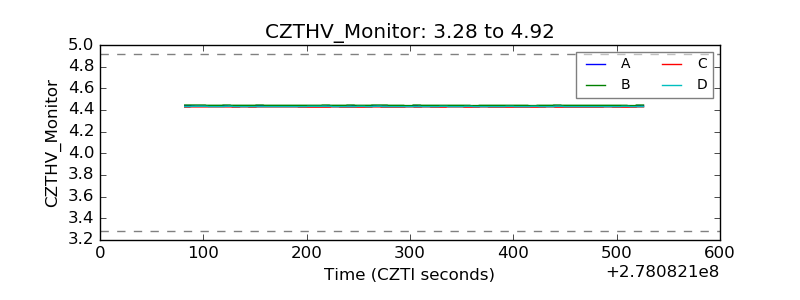 |
| D_VDD |  |
| Temperature 1 |  |
| Veto HV Monitor | 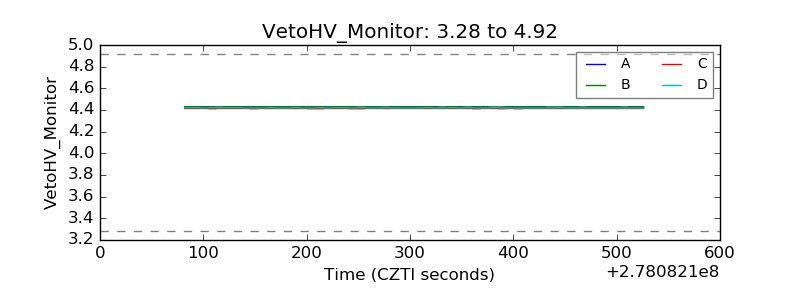 |
| Veto LLD | 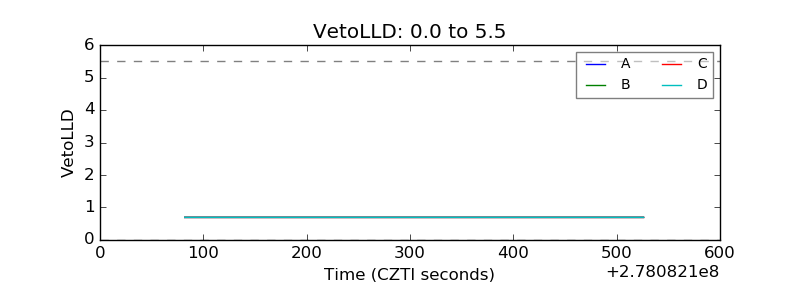 |
| Alpha Counter | 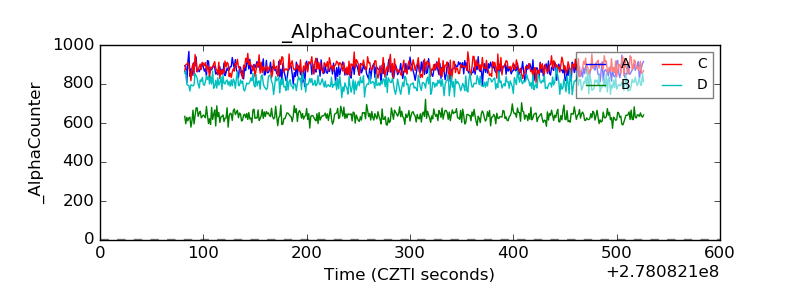 |
| _CPM_Rate | 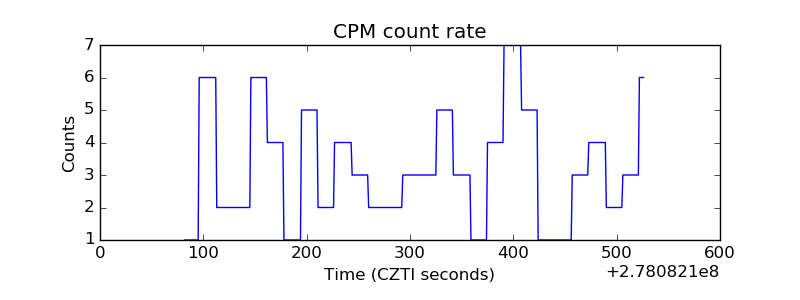 |
| CZT Counter | 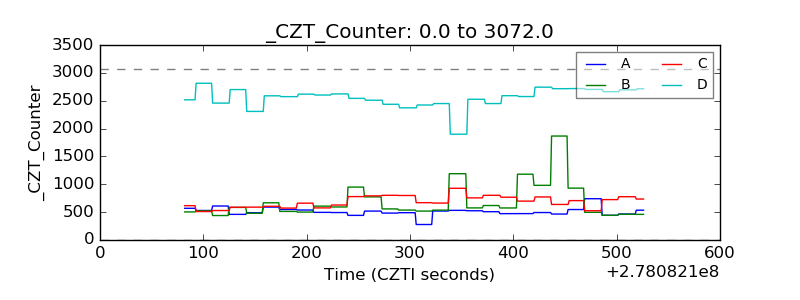 |
| +2.5 Volts monitor |  |
| +5 Volts monitor |  |
| _ROLL_ROT | 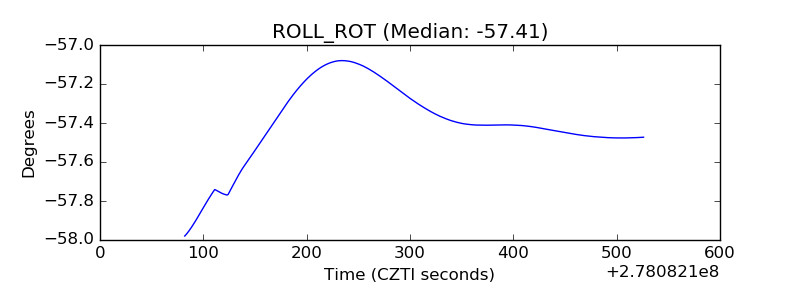 |
| _Roll_DEC | 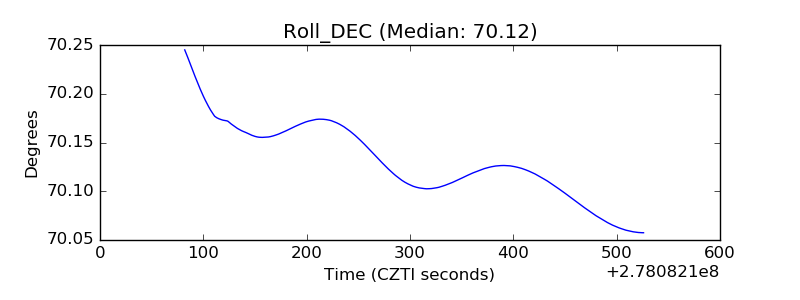 |
| _Roll_RA | 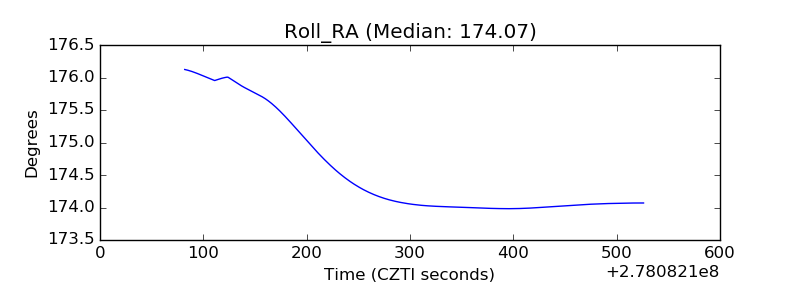 |
| Veto Counter | 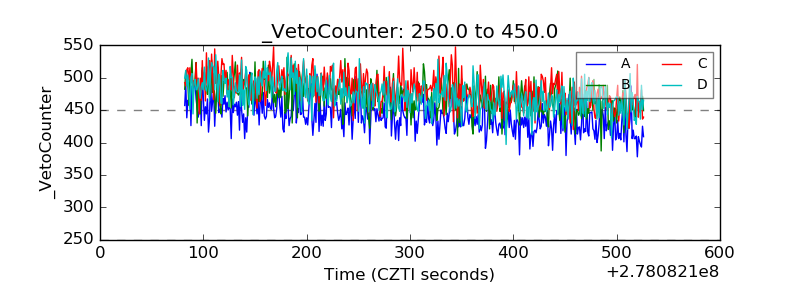 |