| Param | Original file | Final file |
|---|---|---|
| Filename | modeM0/AS1A05_064T01_9000002450_16614cztM0_level2.evt | modeM0/AS1A05_064T01_9000002450_16614cztM0_level2_quad_clean.evt |
| Size (bytes) | 583,513,920 | 108,889,920 |
| Size | 556.5 MB | 103.8 MB |
| Events in quadrant A | 2,735,983 | 779,891 |
| Events in quadrant B | 3,250,821 | 777,923 |
| Events in quadrant C | 3,704,568 | 748,852 |
| Events in quadrant D | 7,596,341 | 594,081 |
| Mode M0 | |||
|---|---|---|---|
| Quadrant | BADHDUFLAG | Total packets | Discarded packets |
| A | 0 | 11907 | 2 |
| B | 0 | 13461 | 1 |
| C | 0 | 14686 | 1 |
| D | 0 | 26418 | 1 |
| Mode SS | |||
|---|---|---|---|
| Quadrant | BADHDUFLAG | Total packets | Discarded packets |
| A | 0 | 118 | 0 |
| B | 0 | 118 | 0 |
| C | 0 | 118 | 0 |
| D | 0 | 118 | 0 |
| Mode M9 | |||
|---|---|---|---|
| Quadrant | BADHDUFLAG | Total packets | Discarded packets |
| A | 0 | 11 | 0 |
| B | 0 | 11 | 0 |
| C | 0 | 11 | 0 |
| D | 0 | 11 | 0 |
| Quadrant | Total seconds | Saturated seconds | Saturation percentage |
|---|---|---|---|
| A | 5656 | 62 | 1.096181% |
| B | 5656 | 92 | 1.626591% |
| C | 5656 | 175 | 3.094059% |
| D | 5656 | 2045 | 36.156294% |
Noise dominated data is calculated using 1-second bins in cleaned event files. If a bin has >2000 counts, and if more than 50% of those come from <1% of pixels, then it is considered to be noise-dominated and hence unusable.
| Quadrant | # 1 sec bins | Bins with >0 counts | Bins with >2000 counts | High rate bins dominated by noise | Noise dominated (total time) | Noise dominated (detector-on time) | Marked lightcurve |
|---|---|---|---|---|---|---|---|
| A | 6852 | 5658 | 2 | 2 | 0.03% | 0.04% | 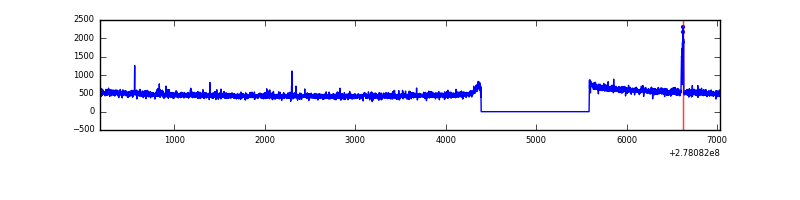 |
| B | 6852 | 5658 | 26 | 26 | 0.38% | 0.46% | 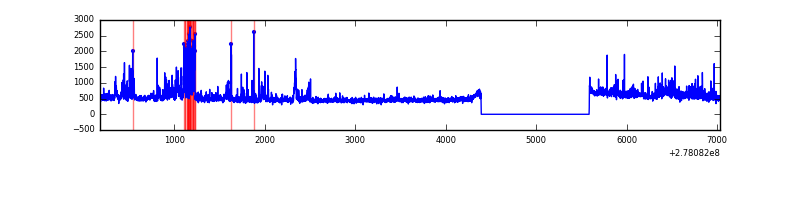 |
| C | 6852 | 5658 | 36 | 36 | 0.53% | 0.64% |  |
| D | 6852 | 5658 | 1577 | 1577 | 23.02% | 27.87% | 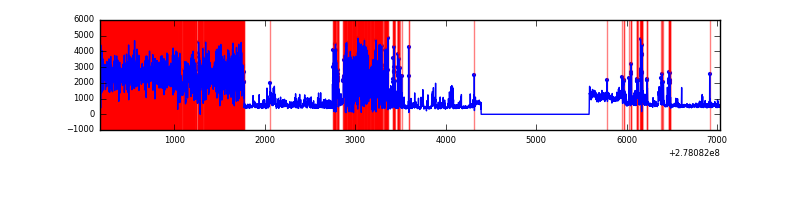 |
Top three noisy pixels from each quadrant. If the there are fewer than three noisy pixels in the level2.evt file, extra rows are filled as -1
| Pixel properties | Quadrant properties | ||||||
|---|---|---|---|---|---|---|---|
| Quadrant | DetID | PixID | Counts | Sigma | Mean | Median | Sigma |
| A | 15 | 174 | 40702 | 286.22 | 696 | 682 | 139.8 |
| A | 15 | 69 | 18005 | 123.89 | 696 | 682 | 139.8 |
| A | 0 | 226 | 6227 | 39.66 | 696 | 682 | 139.8 |
| B | 15 | 35 | 302773 | 2338.17 | 691 | 674 | 129.2 |
| B | 0 | 198 | 112690 | 866.98 | 691 | 674 | 129.2 |
| B | 7 | 220 | 23453 | 176.3 | 691 | 674 | 129.2 |
| C | 3 | 233 | 957980 | 6183.68 | 670 | 675 | 154.8 |
| C | 14 | 238 | 104152 | 668.4 | 670 | 675 | 154.8 |
| C | 7 | 247 | 28820 | 181.8 | 670 | 675 | 154.8 |
| D | 1 | 52 | 5341175 | 38955.41 | 562 | 546 | 137.1 |
| D | 2 | 16 | 61185 | 442.31 | 562 | 546 | 137.1 |
| D | 10 | 70 | 33479 | 240.22 | 562 | 546 | 137.1 |
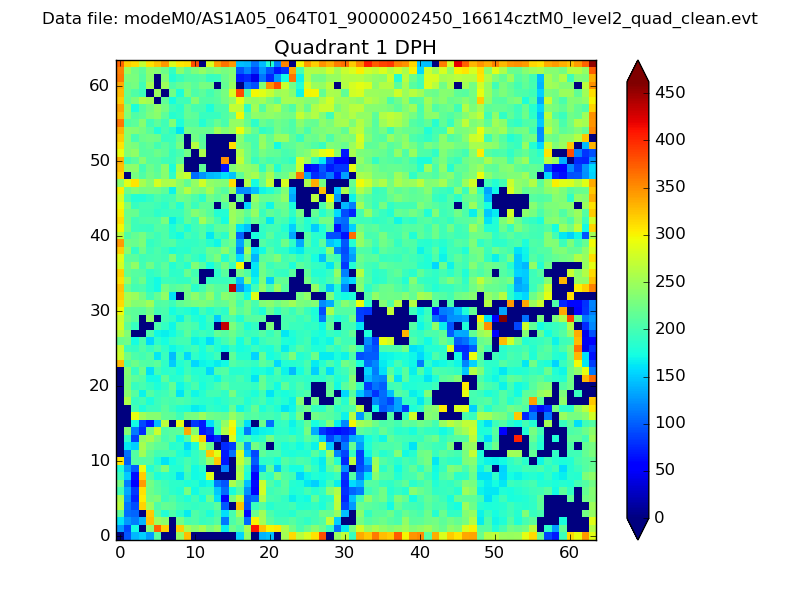
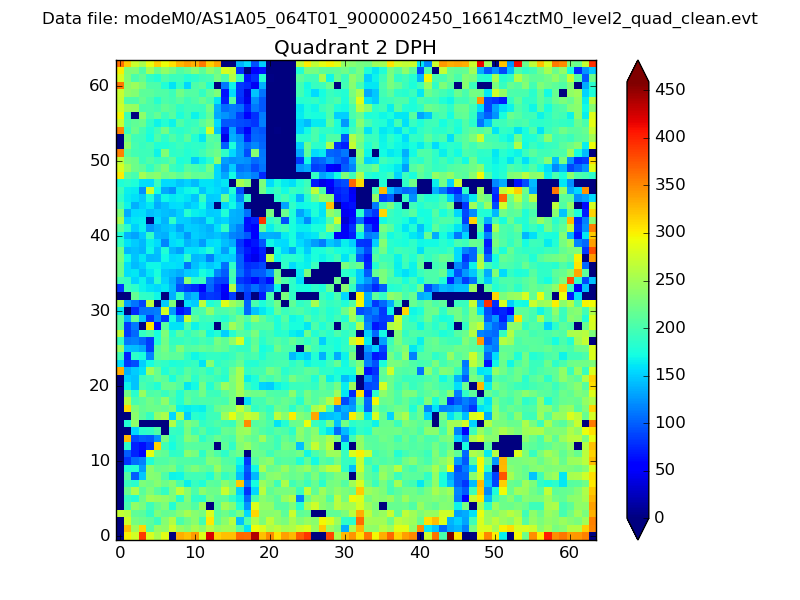
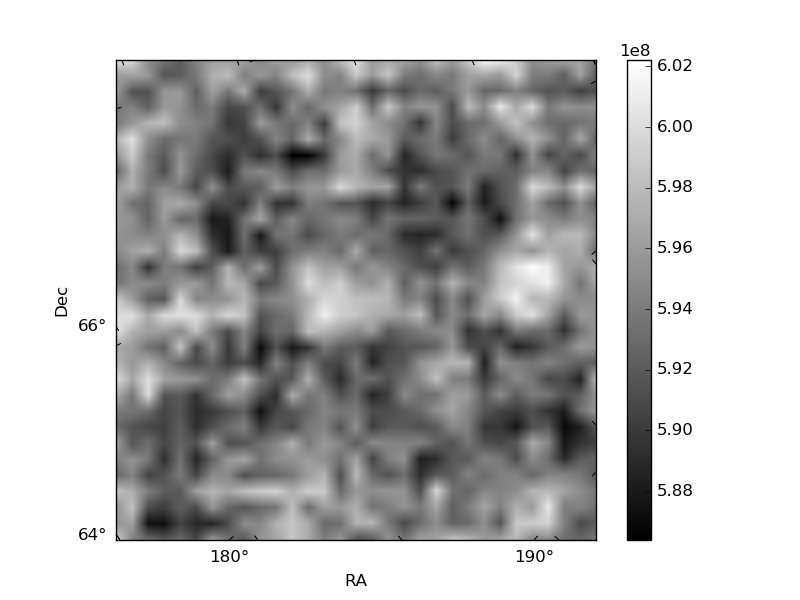
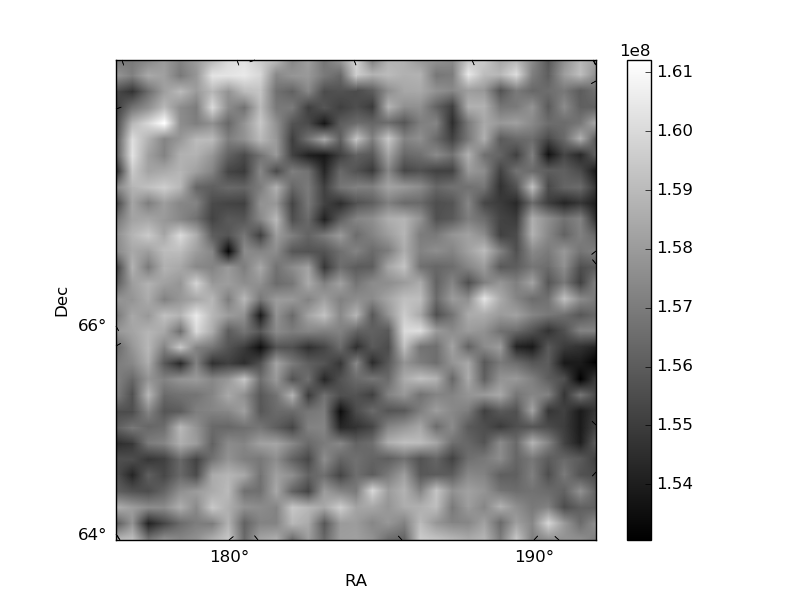
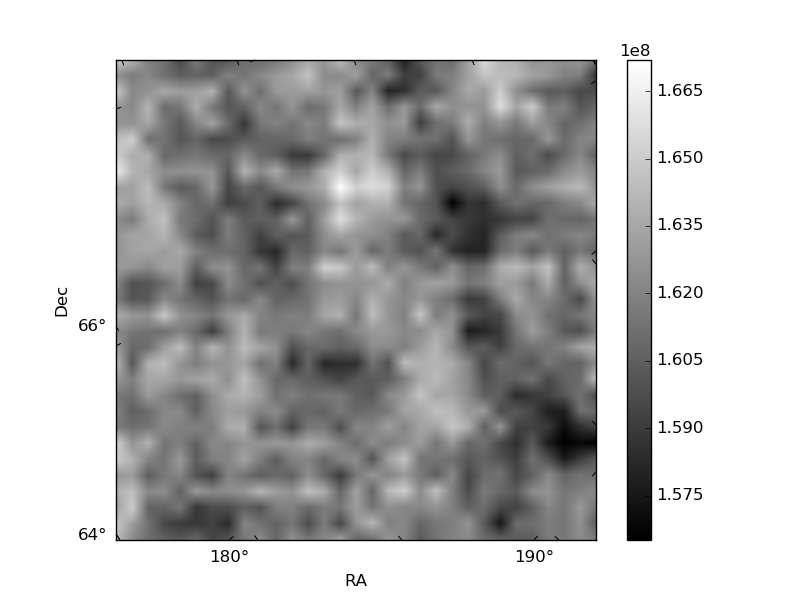
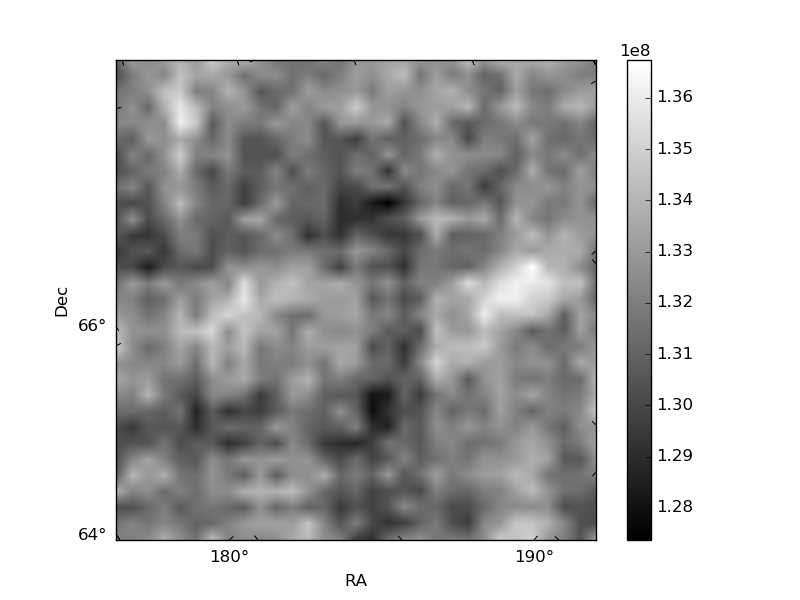
Histogram calculated using DETX and DETY for each event in the final _common_clean file
| Quadrant A | 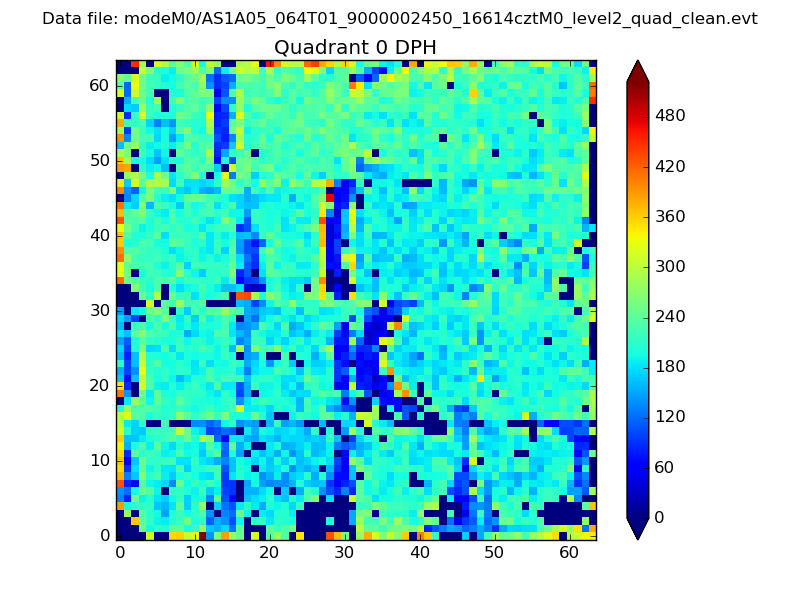 |
 |
Quadrant B |
|---|---|---|---|
| Quadrant D | 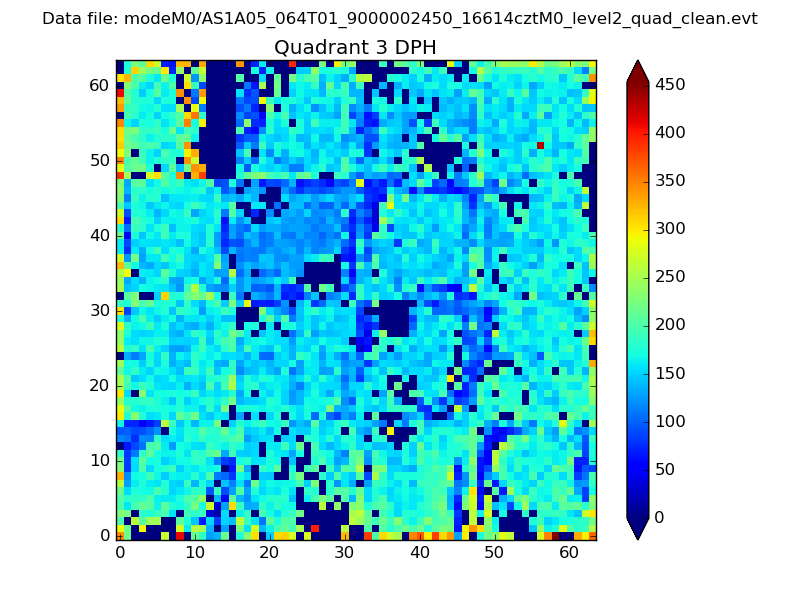 |
 |
Quadrant C |
| Plot type | Count rate plots | Images |
|---|---|---|
| Comparison with Poisson distribution Blue bars denote a histogram of data divided into 1 sec bins. Red curve is a Poisson curve with rate = median count rate of data. |
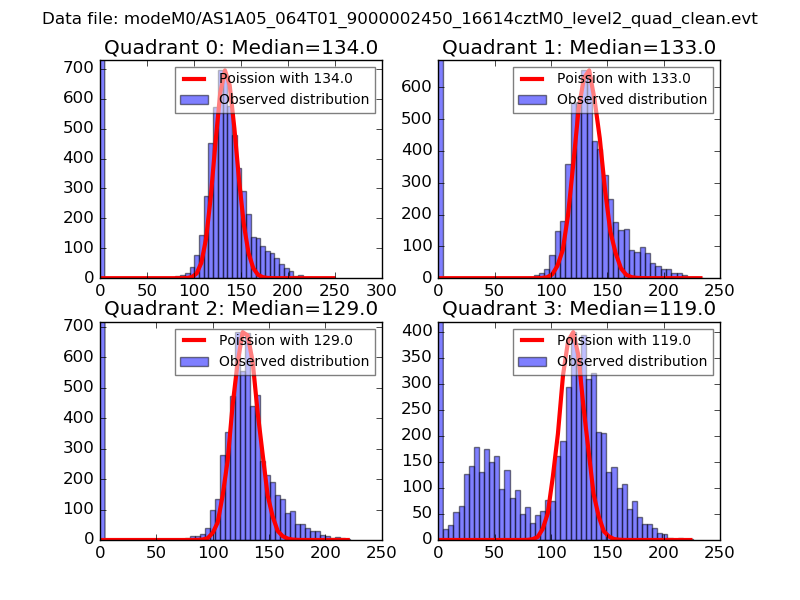 |
 |
| Quadrant-wise count rates Data is divided into 100 sec bins |
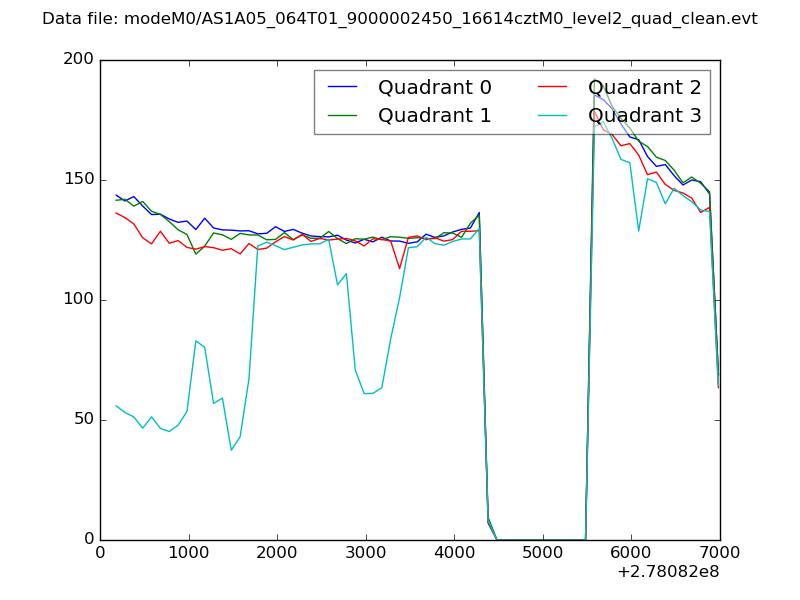 |
|
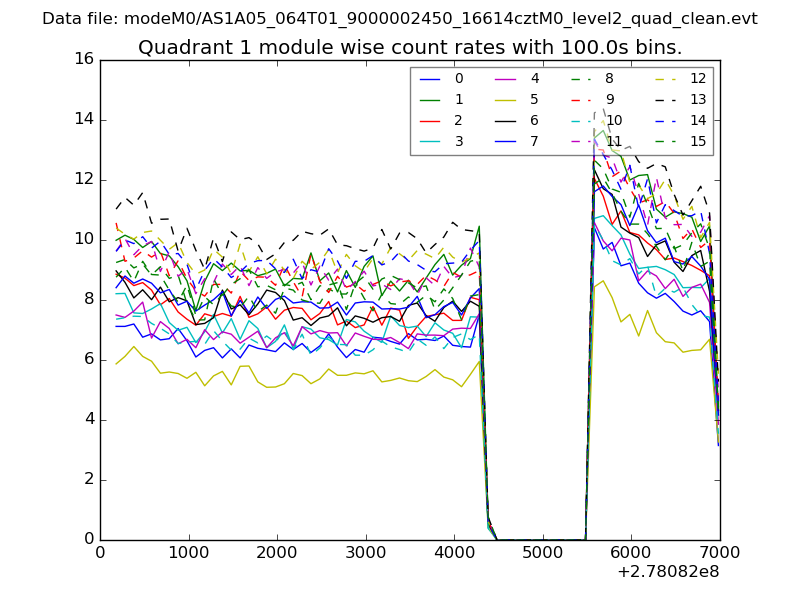
| Module-wise count rates for Quadrant A Data is divided into 100 sec bins |
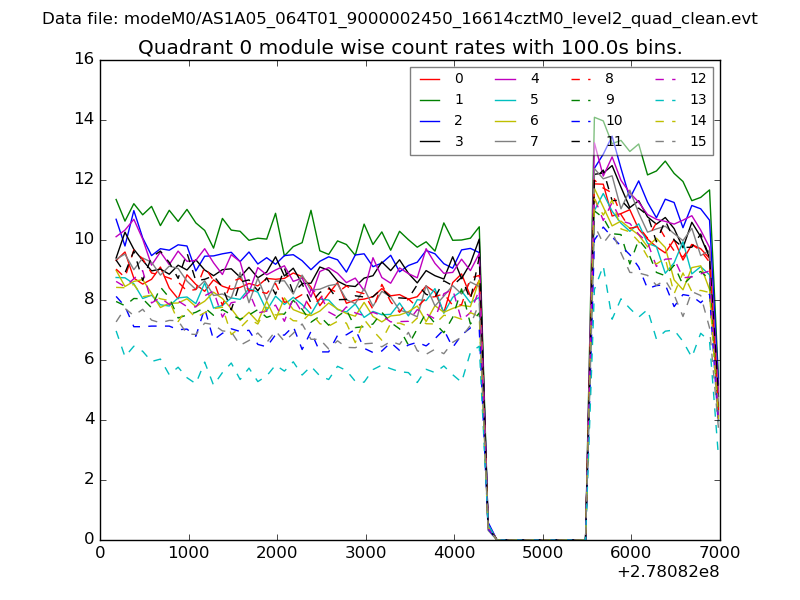 |
 |
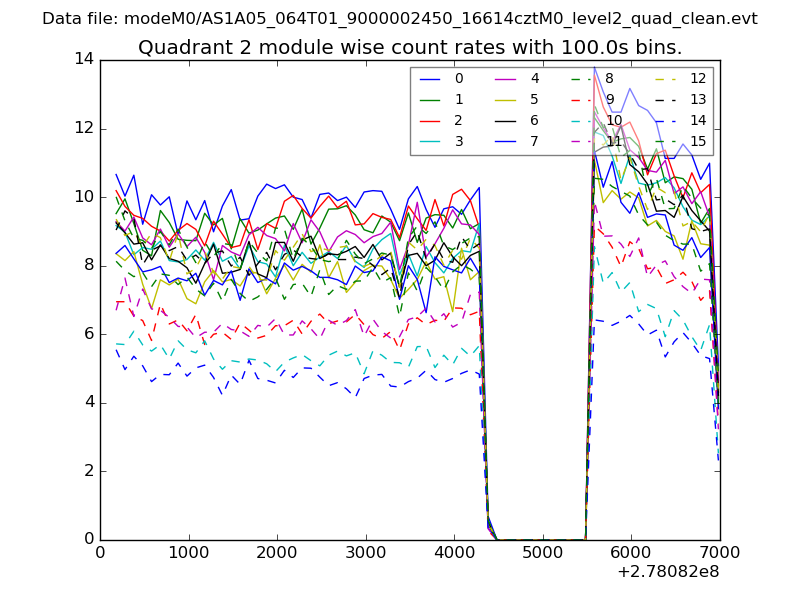
| Module-wise count rates for Quadrant B Data is divided into 100 sec bins |
 |
 |
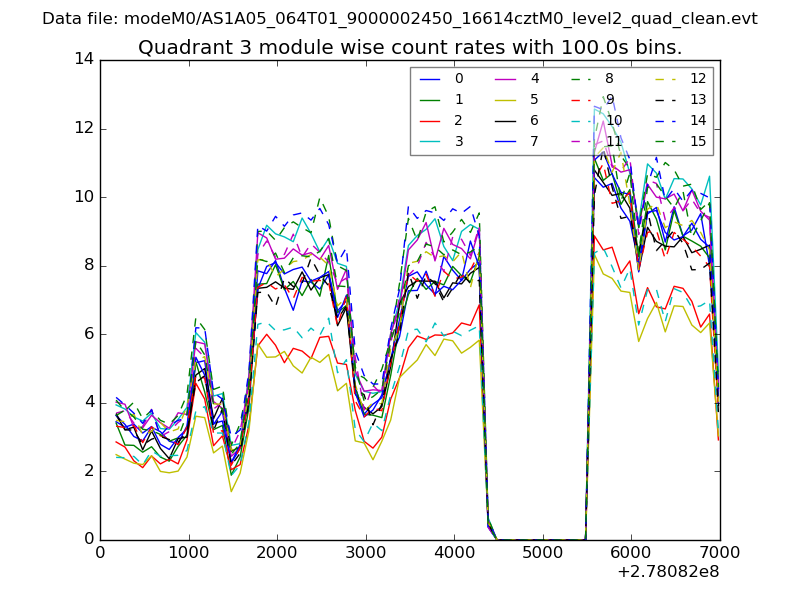
| Module-wise count rates for Quadrant C Data is divided into 100 sec bins |
 |
 |
| Module-wise count rates for Quadrant D Data is divided into 100 sec bins |
 |
 |
| Parameter | Plot |
|---|---|
| CZT HV Monitor | 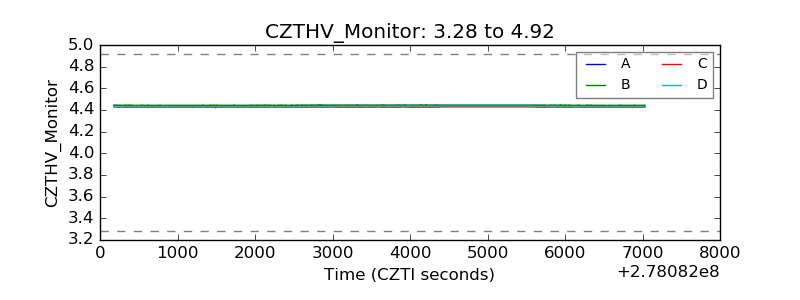 |
| D_VDD | 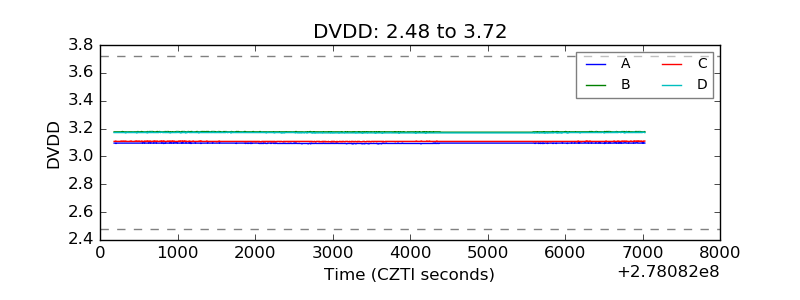 |
| Temperature 1 | 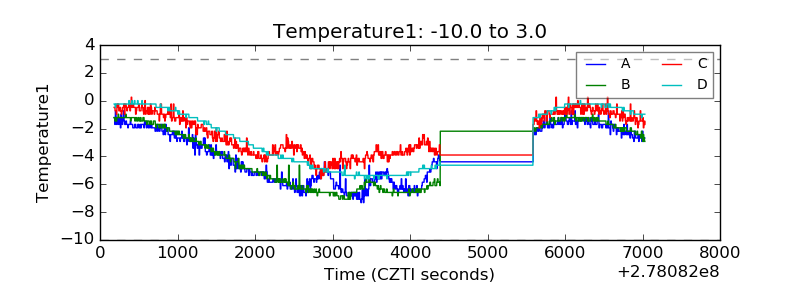 |
| Veto HV Monitor | 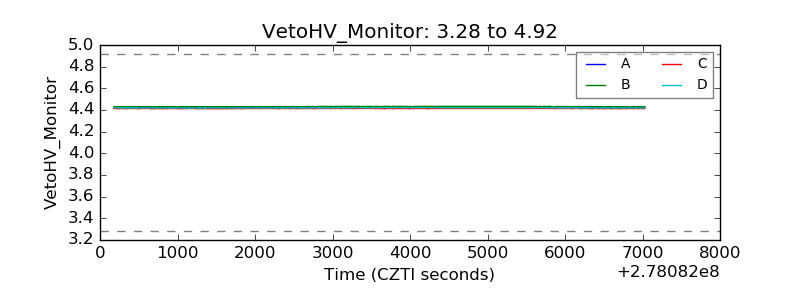 |
| Veto LLD | 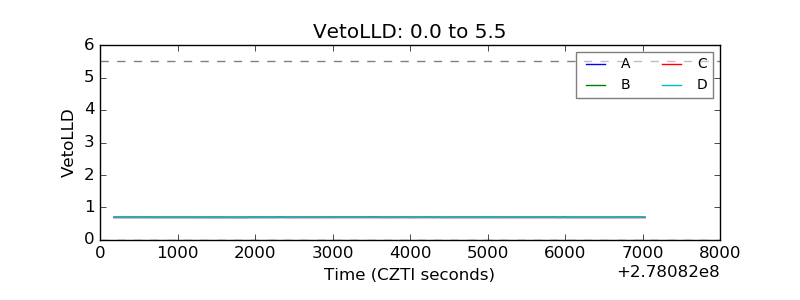 |
| Alpha Counter | 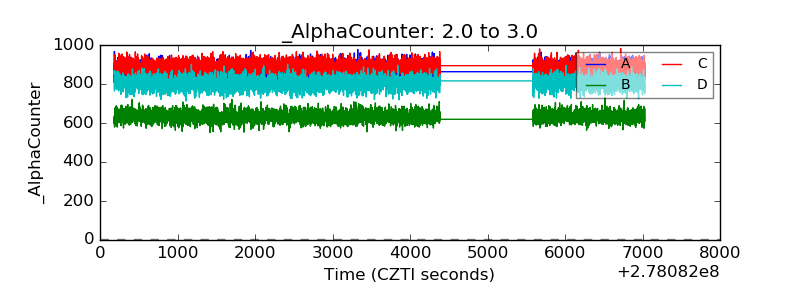 |
| _CPM_Rate | 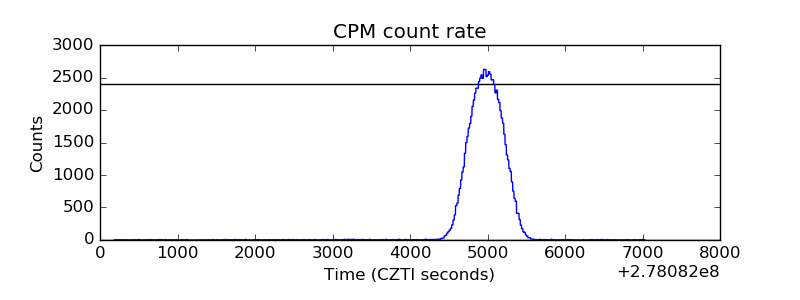 |
| CZT Counter | 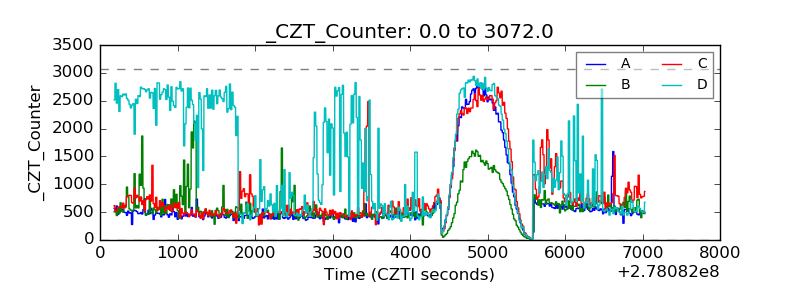 |
| +2.5 Volts monitor |  |
| +5 Volts monitor |  |
| _ROLL_ROT | 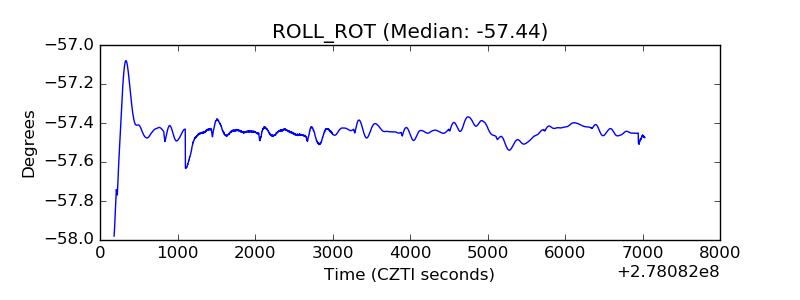 |
| _Roll_DEC |  |
| _Roll_RA | 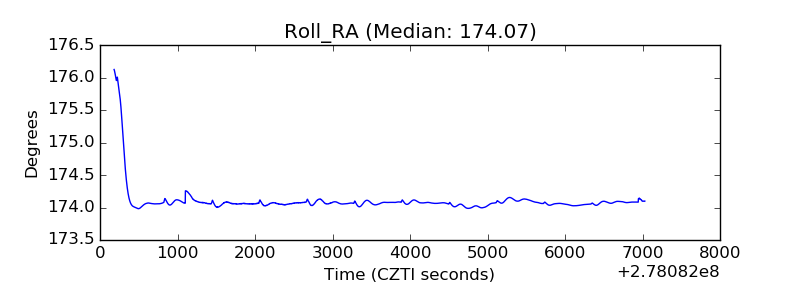 |
| Veto Counter |  |