| Param | Original file | Final file |
|---|---|---|
| Filename | modeM0/AS1A05_064T01_9000002450_16616cztM0_level2.evt | modeM0/AS1A05_064T01_9000002450_16616cztM0_level2_quad_clean.evt |
| Size (bytes) | 435,695,040 | 124,542,720 |
| Size | 415.5 MB | 118.8 MB |
| Events in quadrant A | 2,901,523 | 846,675 |
| Events in quadrant B | 3,337,712 | 857,342 |
| Events in quadrant C | 3,208,328 | 843,646 |
| Events in quadrant D | 3,355,067 | 820,846 |
| Mode M0 | |||
|---|---|---|---|
| Quadrant | BADHDUFLAG | Total packets | Discarded packets |
| A | 0 | 12360 | 2 |
| B | 0 | 13828 | 1 |
| C | 0 | 13476 | 1 |
| D | 0 | 13554 | 1 |
| Mode SS | |||
|---|---|---|---|
| Quadrant | BADHDUFLAG | Total packets | Discarded packets |
| A | 0 | 118 | 0 |
| B | 0 | 118 | 0 |
| C | 0 | 118 | 0 |
| D | 0 | 118 | 0 |
| Mode M9 | |||
|---|---|---|---|
| Quadrant | BADHDUFLAG | Total packets | Discarded packets |
| A | 0 | 13 | 0 |
| B | 0 | 13 | 0 |
| C | 0 | 13 | 0 |
| D | 0 | 13 | 0 |
| Quadrant | Total seconds | Saturated seconds | Saturation percentage |
|---|---|---|---|
| A | 5776 | 75 | 1.298476% |
| B | 5776 | 93 | 1.610111% |
| C | 5776 | 94 | 1.627424% |
| D | 5776 | 107 | 1.852493% |
Noise dominated data is calculated using 1-second bins in cleaned event files. If a bin has >2000 counts, and if more than 50% of those come from <1% of pixels, then it is considered to be noise-dominated and hence unusable.
| Quadrant | # 1 sec bins | Bins with >0 counts | Bins with >2000 counts | High rate bins dominated by noise | Noise dominated (total time) | Noise dominated (detector-on time) | Marked lightcurve |
|---|---|---|---|---|---|---|---|
| A | 7132 | 5778 | 1 | 1 | 0.01% | 0.02% | 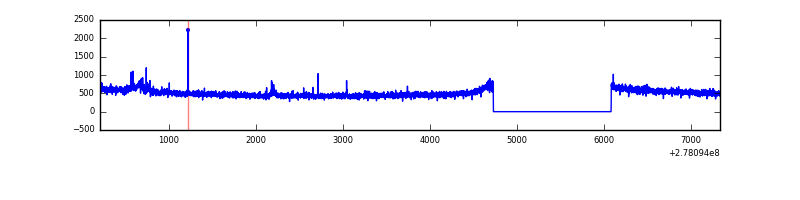 |
| B | 7132 | 5778 | 10 | 10 | 0.14% | 0.17% | 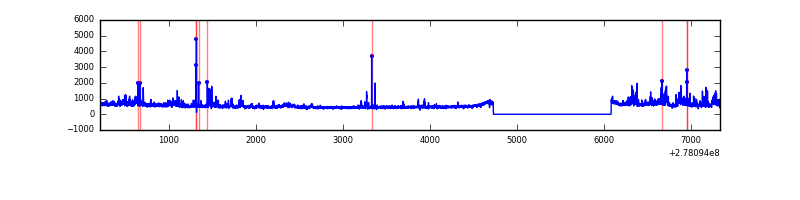 |
| C | 7132 | 5778 | 0 | 0 | 0.00% | 0.00% | 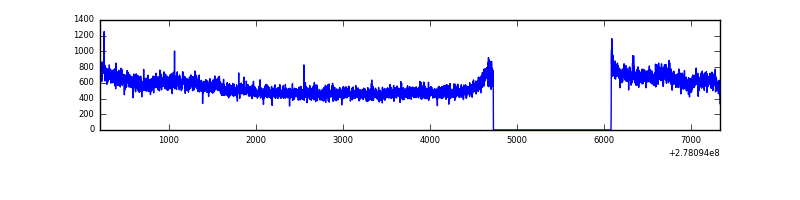 |
| D | 7132 | 5778 | 25 | 25 | 0.35% | 0.43% | 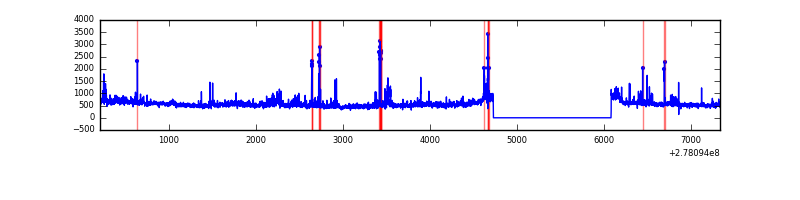 |
Top three noisy pixels from each quadrant. If the there are fewer than three noisy pixels in the level2.evt file, extra rows are filled as -1
| Pixel properties | Quadrant properties | ||||||
|---|---|---|---|---|---|---|---|
| Quadrant | DetID | PixID | Counts | Sigma | Mean | Median | Sigma |
| A | 15 | 69 | 35755 | 239.75 | 738 | 724 | 146.1 |
| A | 15 | 174 | 13198 | 85.37 | 738 | 724 | 146.1 |
| A | 15 | 223 | 7557 | 46.76 | 738 | 724 | 146.1 |
| B | 15 | 35 | 171476 | 1262.91 | 738 | 720 | 135.2 |
| B | 7 | 220 | 76497 | 560.45 | 738 | 720 | 135.2 |
| B | 0 | 189 | 70391 | 515.29 | 738 | 720 | 135.2 |
| C | 3 | 233 | 204336 | 1228.41 | 724 | 729 | 165.7 |
| C | 14 | 238 | 112154 | 672.25 | 724 | 729 | 165.7 |
| C | 7 | 247 | 66271 | 395.43 | 724 | 729 | 165.7 |
| D | 1 | 52 | 387577 | 2203.77 | 731 | 710 | 175.5 |
| D | 10 | 70 | 143362 | 812.61 | 731 | 710 | 175.5 |
| D | 2 | 234 | 26538 | 147.13 | 731 | 710 | 175.5 |
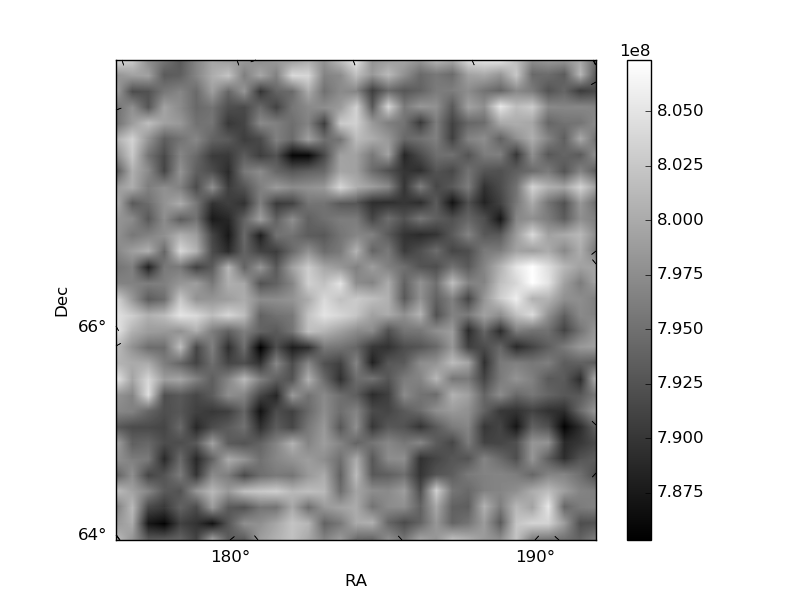
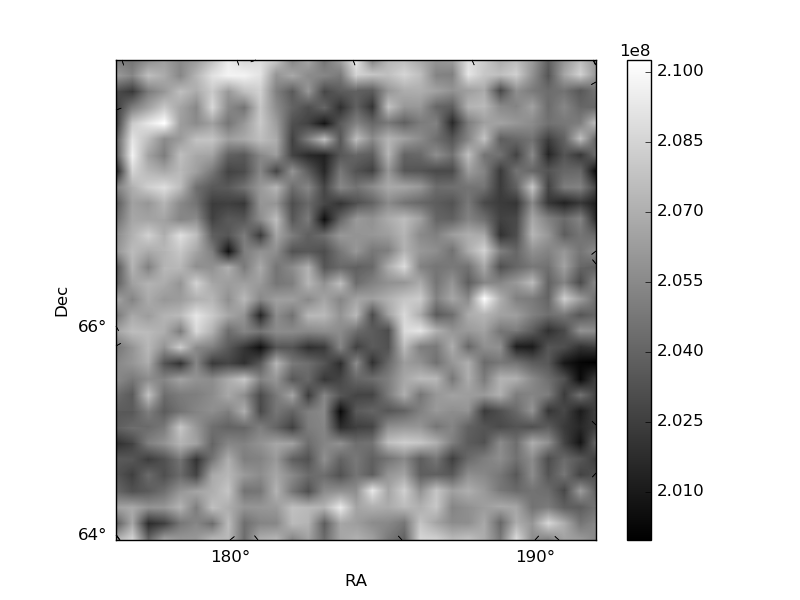
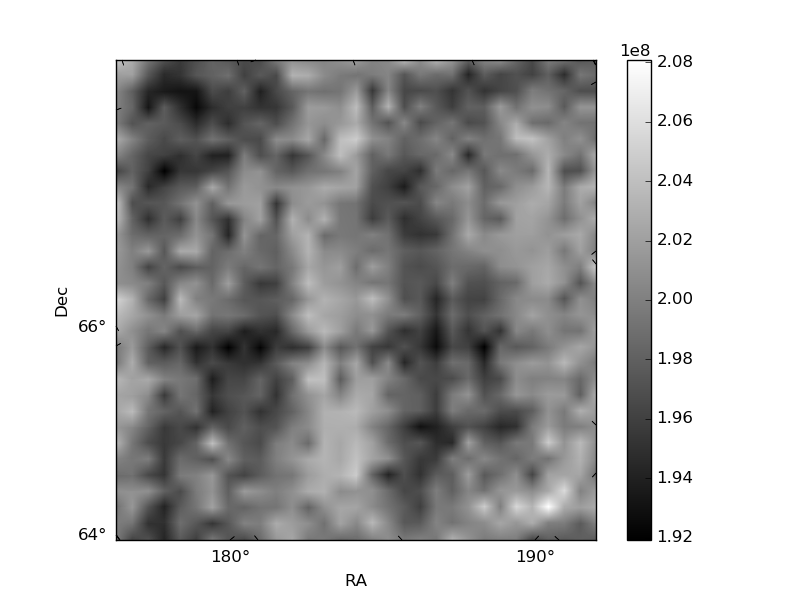
Histogram calculated using DETX and DETY for each event in the final _common_clean file
| Quadrant A | 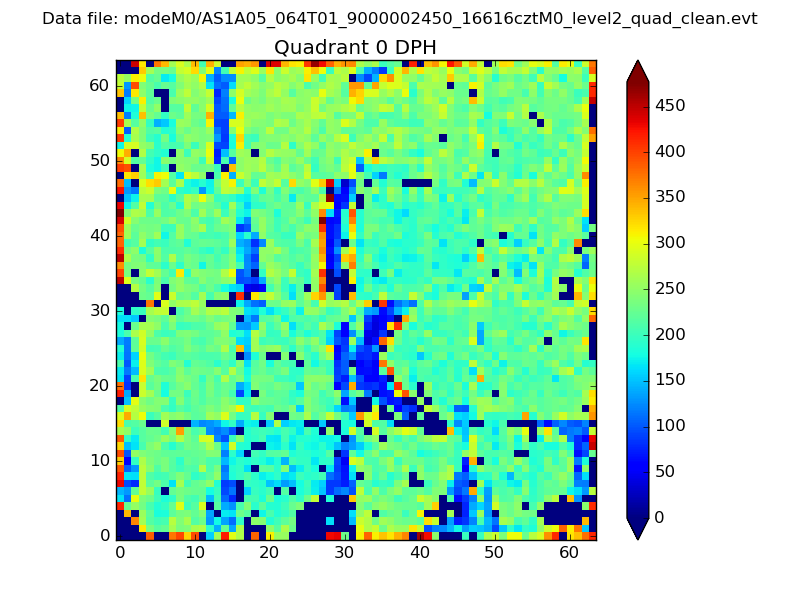 |
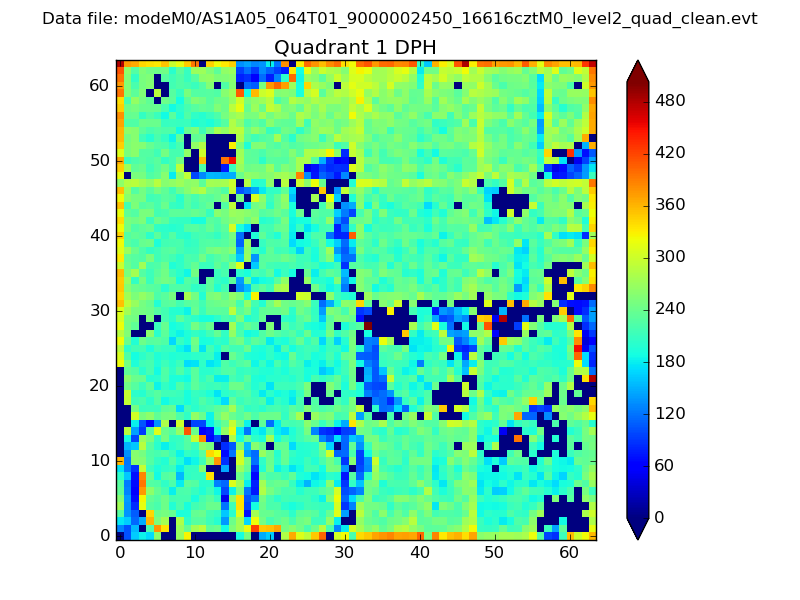 |
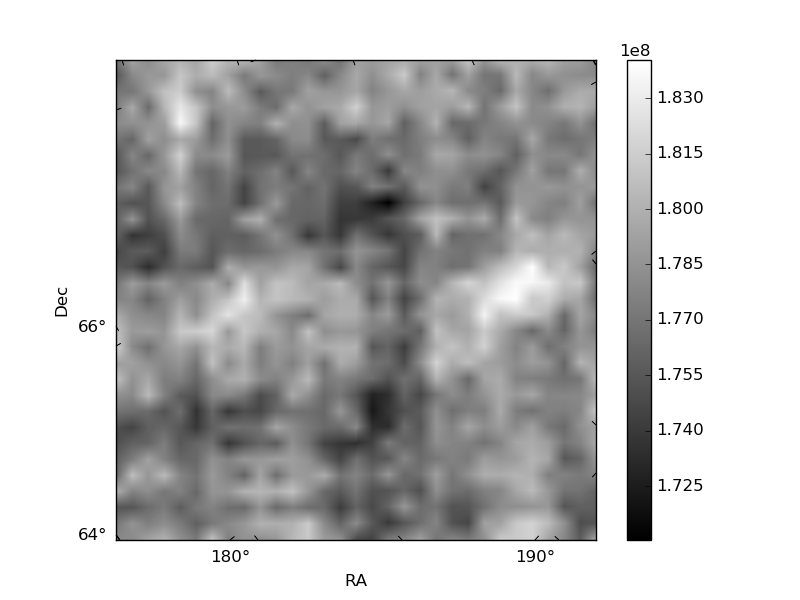
Quadrant B |
|---|---|---|---|
| Quadrant D | 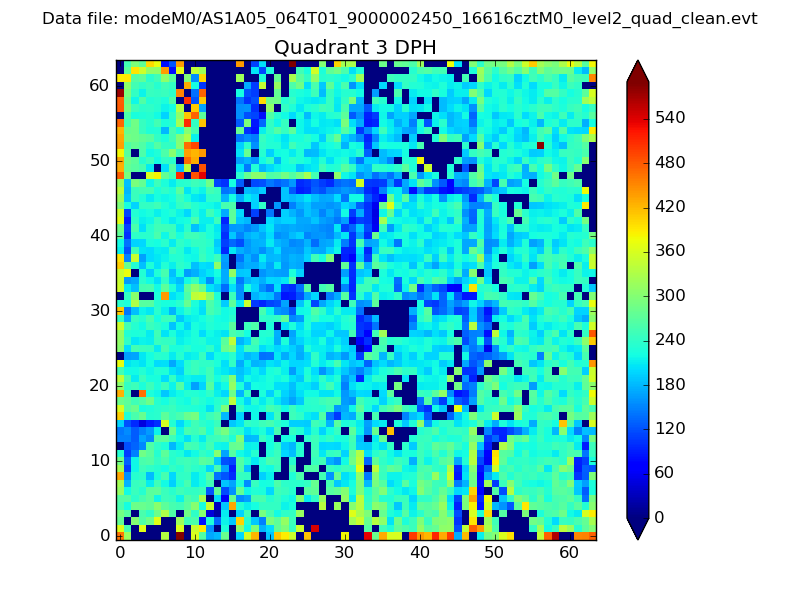 |
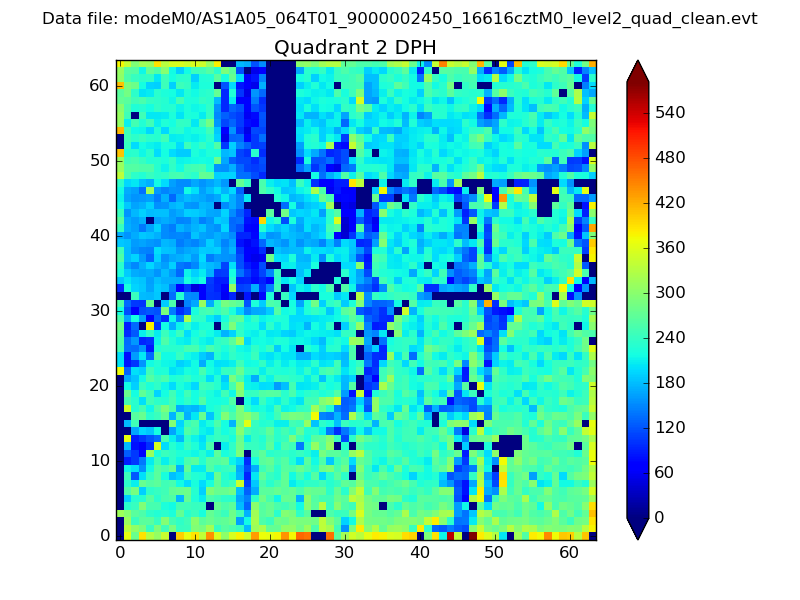 |
Quadrant C |
| Plot type | Count rate plots | Images |
|---|---|---|
| Comparison with Poisson distribution Blue bars denote a histogram of data divided into 1 sec bins. Red curve is a Poisson curve with rate = median count rate of data. |
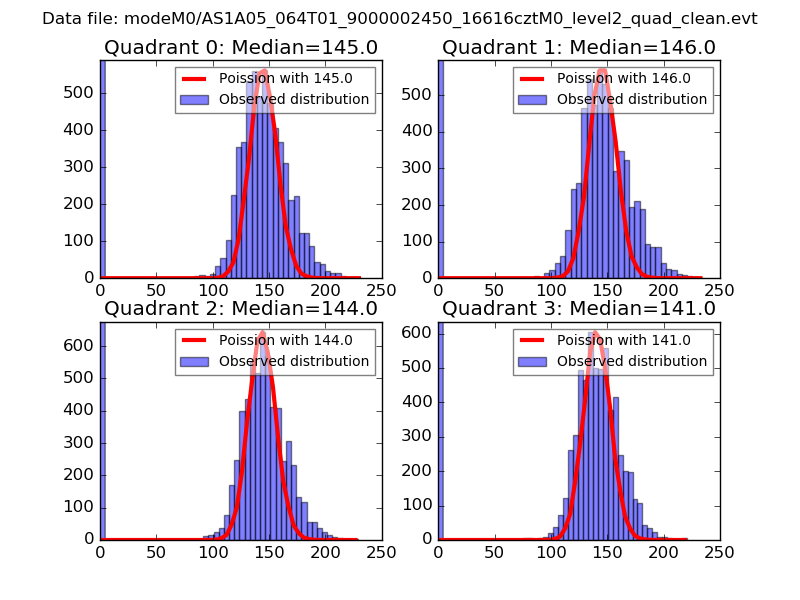 |
 |
| Quadrant-wise count rates Data is divided into 100 sec bins |
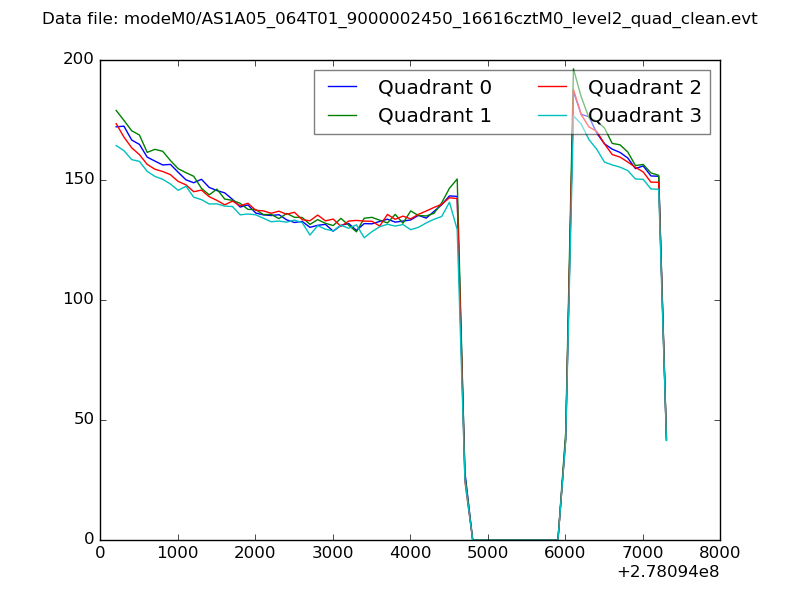 |
|
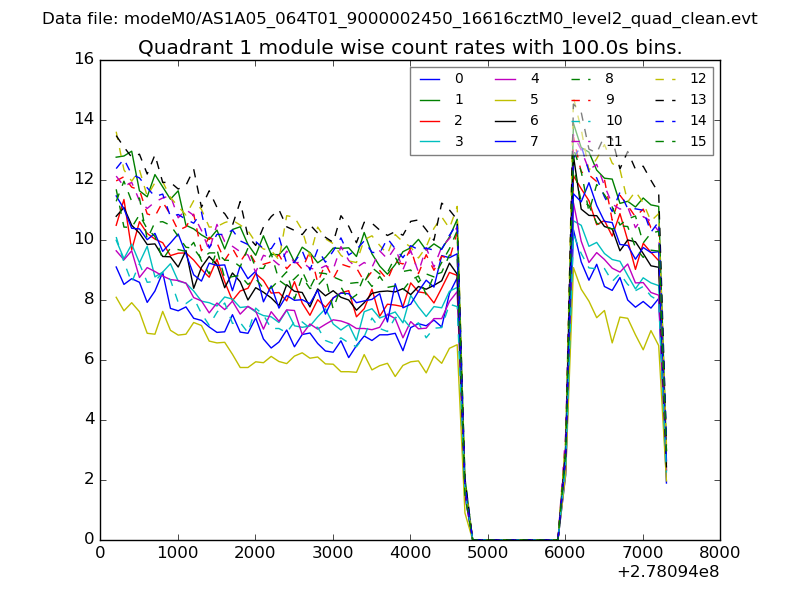
| Module-wise count rates for Quadrant A Data is divided into 100 sec bins |
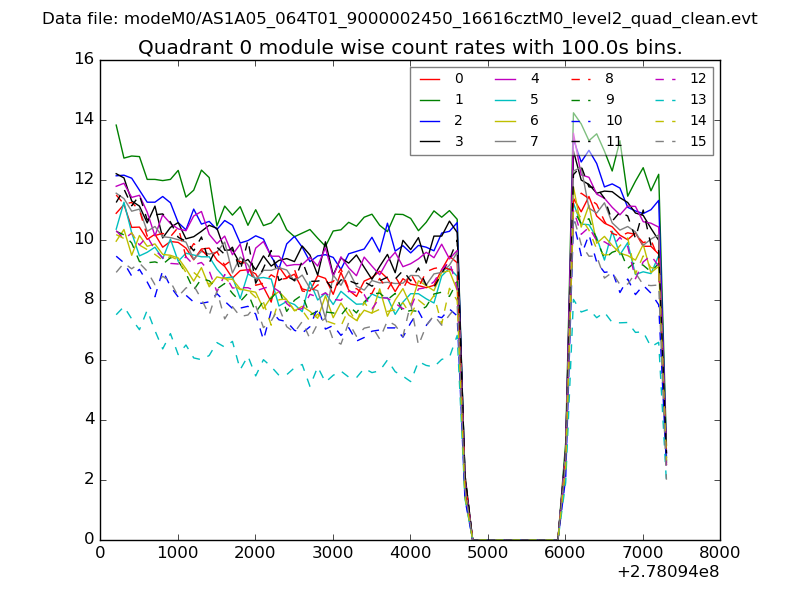 |
 |
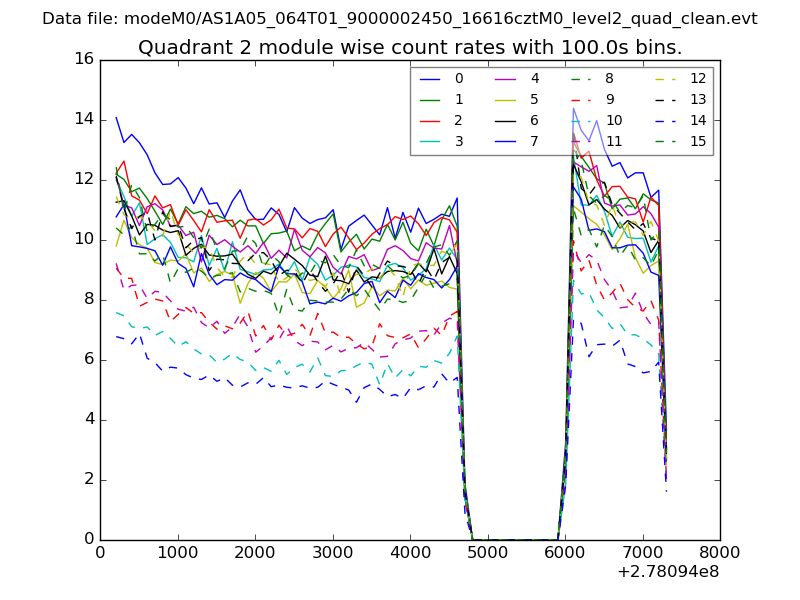
| Module-wise count rates for Quadrant B Data is divided into 100 sec bins |
 |
 |
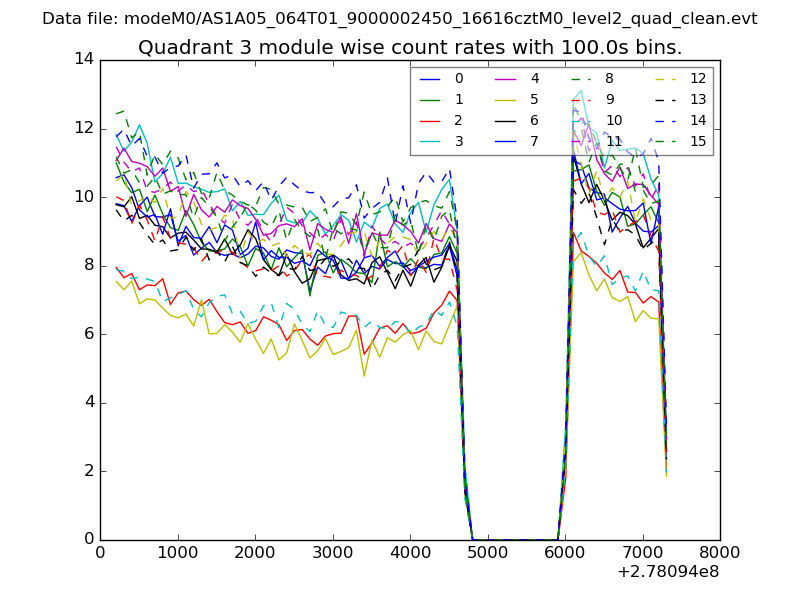
| Module-wise count rates for Quadrant C Data is divided into 100 sec bins |
 |
 |
| Module-wise count rates for Quadrant D Data is divided into 100 sec bins |
 |
 |
| Parameter | Plot |
|---|---|
| CZT HV Monitor | 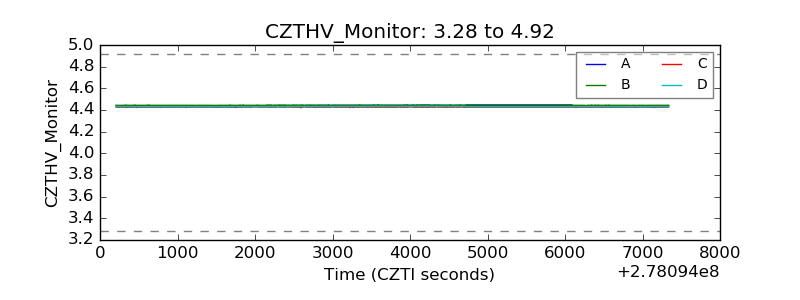 |
| D_VDD | 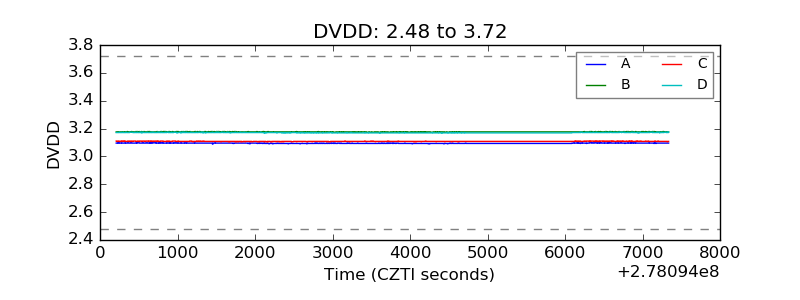 |
| Temperature 1 |  |
| Veto HV Monitor | 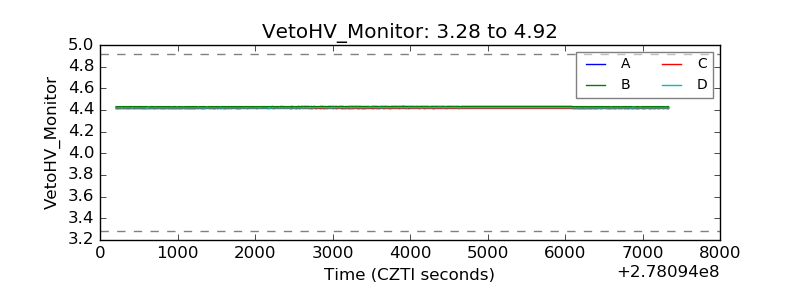 |
| Veto LLD | 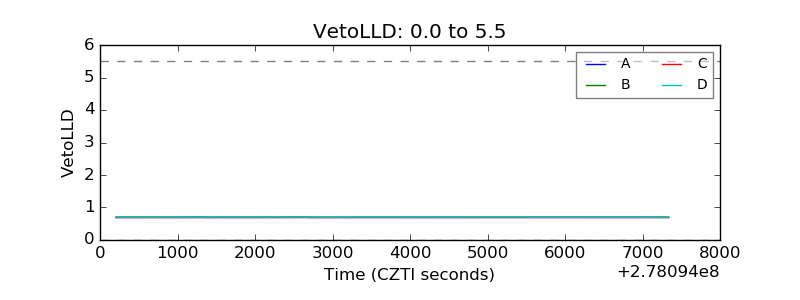 |
| Alpha Counter | 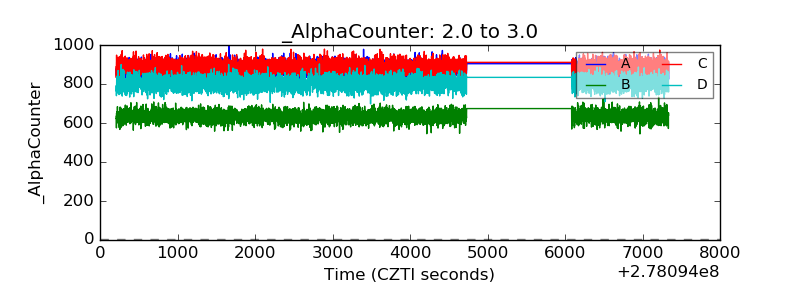 |
| _CPM_Rate | 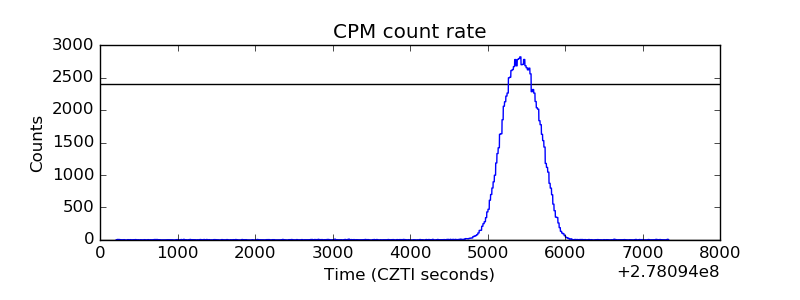 |
| CZT Counter | 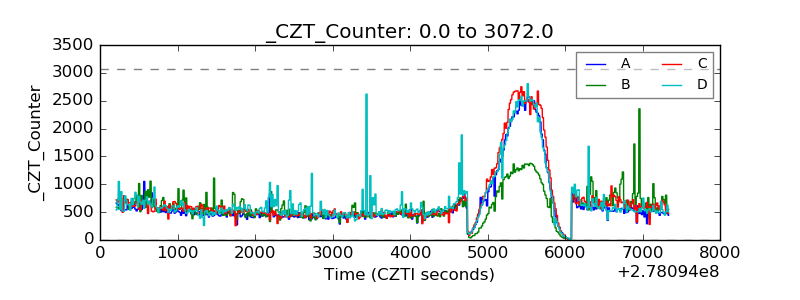 |
| +2.5 Volts monitor |  |
| +5 Volts monitor | 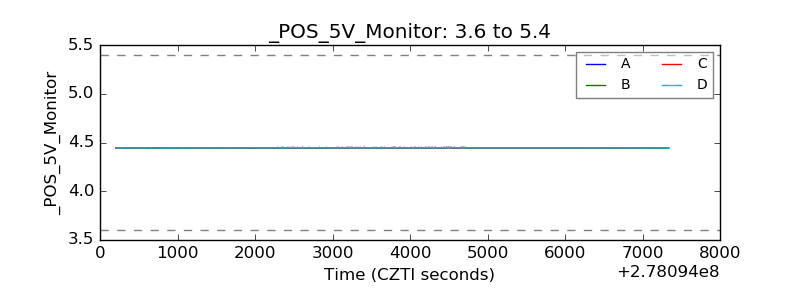 |
| _ROLL_ROT | 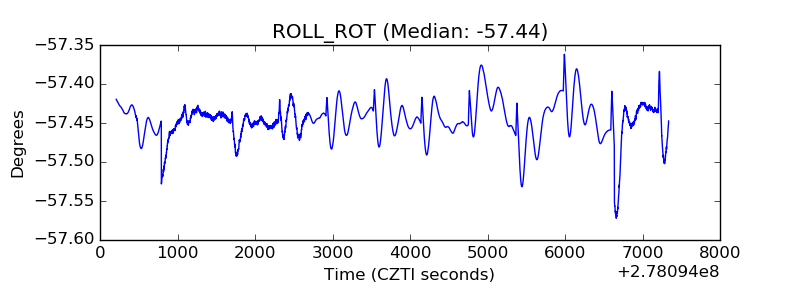 |
| _Roll_DEC | 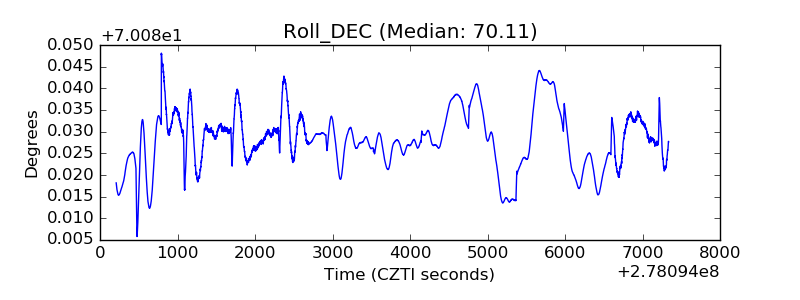 |
| _Roll_RA | 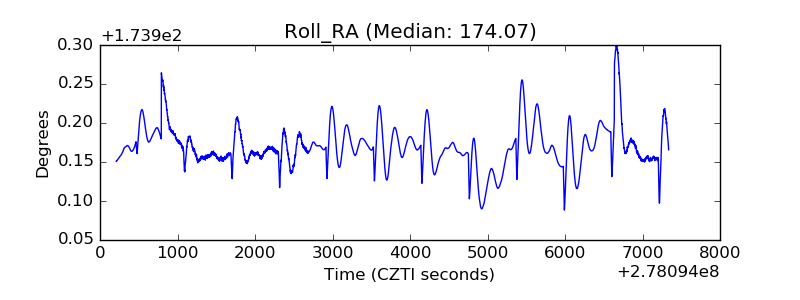 |
| Veto Counter | 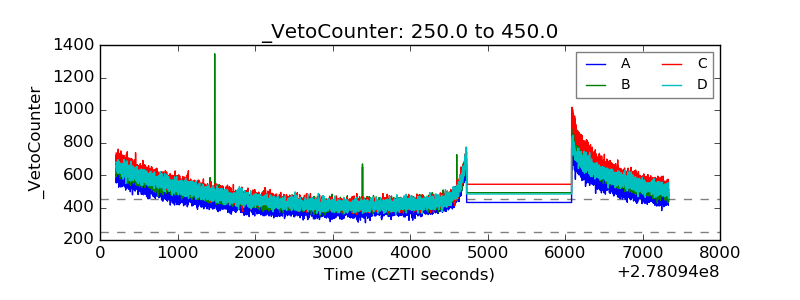 |